Electrostatic Precipitator Market by Type (Dry Electrostatic Precipitator and Wet Electrostatic Precipitator), Vertical (Power & Electricity, Metals, Cement, Chemicals), Offering, and Geography - Global Forecast 2018 to 2023


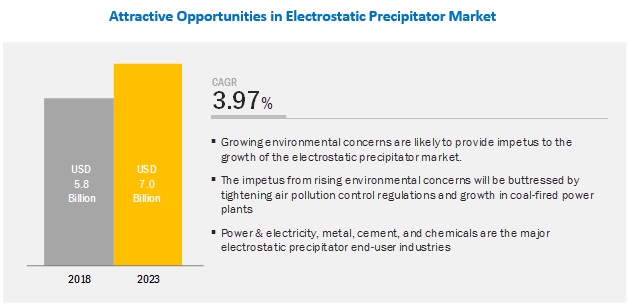
[151 Pages Report] The overall electrostatic precipitator market is expected to grow from USD 5.8 billion in 2018 to USD 7.0 billion by 2023, at a CAGR of 3.97%. The study involved 4 major activities in estimating the size of the market. Exhaustive secondary research was done to collect information on the market, peer market and parent market. The next step was to validate these findings, assumptions, and sizing with industry experts across value chain through primary research. Both top-down and bottom-up approaches were employed to estimate the complete market size. Thereafter, market breakdown and data triangulation were used to estimate the market size of segments and subsegments.
Secondary Research
The research methodology used to estimate and forecast the electrostatic precipitator market begins with capturing data on revenues of key vendors in the market, through secondary research. This study incorporates the use of extensive secondary sources, directories, and databases, such as Hoovers, Bloomberg Businessweek, Factiva, and OneSource, to identify and collect information useful for a technical, market-oriented, and commercial study of the market. Vendor offerings have also been taken into consideration to determine the market segmentation. The entire research methodology includes the study of annual reports, press releases, and investor presentations of companies; white papers; and certified publications and articles from recognized authors, directories, and databases.
Primary Research
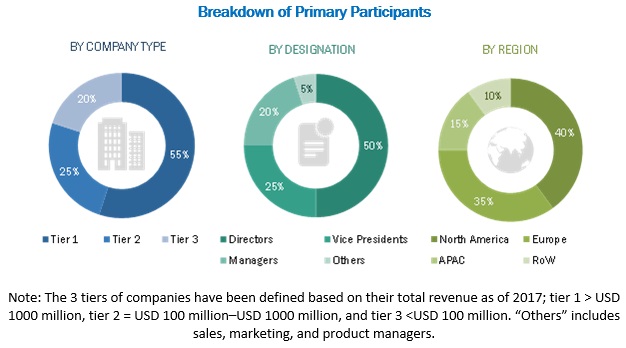
The electrostatic precipitator market comprises several stakeholders, such as suppliers of standard components and original equipment manufacturers (OEMs). The demand side of this market is characterized by the development of power and electricity sectors; metals, cement, and chemicals; among other end user. The supply side is characterized by advancements in types of electrostatic precipitators and diverse applications. Various primary sources from both the supply and demand sides of the market have been interviewed to obtain qualitative and quantitative information. Following is the breakdown of primary respondents.
To know about the assumptions considered for the study, download the pdf brochure
Market Size Estimation
Both top-down and bottom-up approaches have been used to estimate and validate the size of the electrostatic precipitator market and its subsegments. The research methodology used to estimate the market size includes the following:- Key players in major applications and markets have been identified through extensive secondary research.
- The industry�s supply chain and market size, in terms of value, have been determined through primary and secondary research processes.
- All percentage shares, splits, and breakdowns have been determined using secondary sources and verified through primary sources.
Data Triangulation
After arriving at the overall market size using the estimation processes as explained above the market was split into several segments and subsegments. To complete the overall market engineering process and arrive at the exact statistics of each market segment and subsegment, data triangulation and market breakdown procedures have been employed, wherever applicable. The data have been triangulated by studying various factors and trends in both the demand and supply sides in the electrostatic precipitator market.
Research Objective
- To describe and forecast the electrostatic precipitator market, in terms of value, by type, end user, offering, and region
- To describe and forecast the market, in terms of value, by region�Asia Pacific (APAC), Europe, North America, and Rest of the World (RoW), along with their respective countries
- To provide detailed information regarding major factors influencing market growth (drivers, restraints, opportunities, and challenges)
- To strategically analyze micromarkets with respect to individual growth trends, prospects, and contributions to the overall market
- To study the complete value chain of electrostatic precipitators in market
- To analyze opportunities in the market for stakeholders by identifying the high-growth segments of the electrostatic precipitator ecosystem
- To strategically profile key players and comprehensively analyze their market position in terms of ranking and core competencies, along with detailing competitive landscape for market leaders
- To analyze strategic approaches such as product launches, acquisitions, contracts, agreements, and partnerships in the electrostatic precipitator market
Get online access to the report on the World's First Market Intelligence Cloud
- Easy to Download Historical Data & Forecast Numbers
- Company Analysis Dashboard for high growth potential opportunities
- Research Analyst Access for customization & queries
- Competitor Analysis with Interactive dashboard
- Latest News, Updates & Trend analysis
Request Sample Scope of the Report
:
Get online access to the report on the World's First Market Intelligence Cloud
- Easy to Download Historical Data & Forecast Numbers
- Company Analysis Dashboard for high growth potential opportunities
- Research Analyst Access for customization & queries
- Competitor Analysis with Interactive dashboard
- Latest News, Updates & Trend analysis

|
Report Metric |
Details |
|
Market size available for years |
2015�2023 |
|
Base year |
2017 |
|
Forecast period |
2018�2023 |
|
Units |
Value (USD) |
|
Segments covered |
Type, End User, Offerings, and Region |
|
Geographic regions covered |
North America, APAC, Europe, and RoW |
|
Companies covered |
General Electric (US), Mitsubishi Hitachi Power Systems (Japan), Siemens (Germany), Amec Foster Wheeler (UK), Babcock & Wilcox (US), Thermax Global (India), Ducon Technologies (US), Fujian Longking (China), Hamon Group (Belgium), and Trion (US). |
This report categorizes the electrostatic precipitator market based on type, end user, offerings, and region.
By Type:
- Dry ESP
- Wet ESP
By End User:
- Power & Electricity
- Metal
- Cement
- Chemicals
- Others
By Offering:
- Hardware & Software
- Services
By Geography:
- North America
- US
- Canada
- Mexico
- Europe
- UK
- Germany
- France
- Rest of Europe (Russia, Italy, the Netherlands, Denmark, Slovenia, Sweden, Finland, Norway, Romania, Bulgaria, Switzerland, and Poland)
- Asia Pacific (APAC)
- China
- Japan
- India
- Rest of APAC (Taiwan, Australia, Singapore, South Korea, Indonesia, Malaysia, and Thailand)
- Rest of the World (RoW)
- Middle East and Africa
- South America
Available Customizations
Along with the market data, MarketsandMarkets offers customizations according to a company�s specific needs. The following customization options are available for the report:
Company Information
- Detailed analysis and profiling of additional market players (Up to 5)
Critical Questions
- What are new application areas which the electrostatic precipitator providers are exploring?
- Which are the key players in the market and how intense is the competition?
The overall electrostatic precipitator market is expected to grow from USD 5.8 billion in 2018 to USD 7.0 billion by 2023, at a CAGR of 3.97%. Tightening air pollution control regulations, growth in coal-fired power plants, and growing environmental concerns are the key factors driving the growth of this market.
Dry ESP to hold the largest share of the electrostatic precipitator market in 2018
Dry ESP type accounts for the largest share of the electrostatic precipitator market. The market dominance of dry ESP type, in terms of size, can be attributed to its ability to withstand high temperatures and high particulate volumes, cost-effectiveness, and low electricity consumption.
Market for hardware & software offering to hold the largest share of the electrostatic precipitator market in 2018
The market for hardware & software offering accounts for the largest share of the electrostatic precipitator market. The high requirement for hardware parts and software in several types of electrostatic precipitators has contributed to the leading position of the hardware & software segment, in terms of market size. Hardware components, such as discharge electrodes, high voltage electrical systems, collection electrodes, hoppers, rappers, and shell, are the building blocks of electrostatic precipitators and are elemental for their proper functioning.
Power & electricity industry to lead the electrostatic precipitator market during the forecast period
Power & electricity industry accounts for the largest share of the electrostatic precipitator market. Electrostatic precipitators are used by power & electricity generation companies across the world due to offered benefits in terms of better performance, improved particulate collection efficiency, and ability to handle large quantities of fly ash effectively. Implementation of these systems in thermal power plants and petroleum refineries has filliped due to enforcement of strict environmental laws and stringent emission standards, awarding the power & electricity industry the top spot in terms of market size.
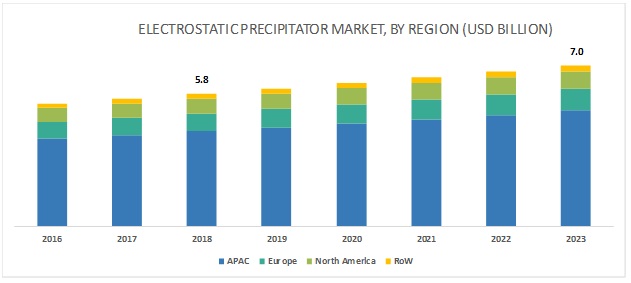
Market in APAC is expected to grow at a significant rate during 2018�2023
APAC accounts for the largest share of the electrostatic precipitator market. Increasing air pollution due to particulate emission, rapid industrialization, and presence of several thermal power plants and cement, steel, and chemical manufacturers in the region have led to increased demand for electrostatic precipitators in APAC.
Key Market Players
A few major companies in the electrostatic precipitator market are: General Electric (US), Mitsubishi Hitachi Power Systems (Japan), Siemens (Germany), Amec Foster Wheeler (UK), Babcock & Wilcox (US), Thermax Global (India), Ducon Technologies (US), Fujian Longking (China), Hamon Group (Belgium), and Trion (US). These players are increasingly undertaking contracts and expansions to increase their market shares.
Prominent players have adopted contracts, followed by expansions, as the key business strategy to strengthen their position in the electrostatic precipitator market. For instance, in November 2017, General Electric Company (US) delivered an electrostatic precipitator to replace an old air filtration system at a copper mine in Australia. In May 2017, Mitsubishi Hitachi Power Systems, Ltd. (Japan) opened its new office in Warsaw, Poland, to strengthen its position in the European region.
Major Market Developments
- In April 2018, General Electric (US), along with its subsidiary Alstom Power Systems (France), received contract as the lead EPC (engineering, procurement, and construction) to construct coal power plant in Ostroleka C, Poland, involving delivery of electrostatic precipitator. Similarly, in November 2017, the company delivered electrostatic precipitator to replace an old air filtration system at a copper mine in Australia. Moreover, the company has adopted inorganic growth strategies to strengthen its position in the electrostatic precipitator market. For instance, in November 2015, the company acquired power and grid business of Alstom, a French rail transport player, at a total cost of USD ~13.71 billion, enabling the company to enhance its technological capability and customer base in the power sector.
- In June 2018, Mitsubishi Hitachi Power Systems (Japan) received contract to upgrade environmental system at Boryeong Power Station, managed by Korea Midland Power Co., Ltd., South Korea. Similarly, in August 2017, the company received an order to supply electrostatic precipitator along with gas turbine and power generator to a power plant owned by Anshan Iron and Steel Group, a Chinese steel manufacturer.
- In January 2017, Babcock & Wilcox (US) acquired Universal Acoustic & Emission Technologies, a US-based acoustic and filtration solution provider, enabling the company to strengthen its environmental solution offering. Babcock & Wilcox has positioned itself to continue diversifying and expanding its product portfolio, thereby expanding its global reach.
Key questions addressed by the report
- Where will all these developments take the industry in the mid to long term?
- What are the upcoming trends in the electrostatic precipitator market?
- What are the opportunities for the various players present now, and those planning to enter at various stages of the value chain?
- How the inorganic growth strategies implemented by key players will impact the growth of the electrostatic precipitator market, and who will have the undue advantage?
To speak to our analyst for a discussion on the above findings, click Speak to Analyst
Table of Contents
1 Introduction (Page No. - 17)
1.1 Study Objectives
1.2 Definition
1.3 Study Scope
1.3.1 Markets Covered
1.3.2 Geographic Scope
1.3.3 Years Considered
1.4 Currency
1.5 Limitations
1.6 Stakeholders
2 Research Methodology (Page No. - 21)
2.1 Research Data
2.1.1 Secondary and Primary Research
2.1.1.1 Key Industry Insights
2.1.2 Secondary Data
2.1.2.1 List of Major Secondary Sources
2.1.2.2 Secondary Sources
2.1.3 Primary Data
2.1.3.1 Primary Interviews With Experts
2.1.3.2 Breakdown of Primaries
2.1.3.3 Primary Sources
2.2 Market Size Estimation
2.2.1 Bottom-Up Approach
2.2.1.1 Approach for Bottom-Up Analysis (Demand Side)
2.2.2 Top-Down Approach
2.2.2.1 Approach for Top-Down Analysis (Supply Side)
2.3 Market Breakdown and Data Triangulation
2.4 Research Assumptions
3 Executive Summary (Page No. - 31)
4 Premium Insights (Page No. - 35)
4.1 Attractive Opportunities in Electrostatic Precipitator Market
4.2 Electrostatic Precipitator Market in APAC, By Country and End-User Industry
4.3 Electrostatic Precipitator Market, By Offering
4.4 Electrostatic Precipitator Market, By Type
4.5 Electrostatic Precipitator Market, By End-User Industry
4.6 Electrostatic Precipitator Market, By Country
5 Market Overview (Page No. - 39)
5.1 Introduction
5.2 Electrostatic Precipitator Market Dynamics
5.2.1 Drivers
5.2.1.1 Tightening Air Pollution Control Regulations
5.2.1.2 Growth in Coal-Fired Power Plants
5.2.1.3 Growing Environmental Concerns
5.2.2 Restraints
5.2.2.1 High Deployment Cost
5.2.3 Opportunities
5.2.3.1 Growth in Cement Industry
5.2.4 Challenges
5.2.4.1 Growing Demand for Alternative Energy Sources
5.2.4.2 Disadvantages in Terms of Functionalities
5.3 Value Chain Analysis
6 Electrostatic Precipitator Market, By Type (Page No. - 46)
6.1 Introduction
6.2 Dry ESP
6.2.1 Dry ESP is Ideal for Handling High Temperature and High Ash Particulate Volumes, Which Drives Its Demand From Several Industries
6.3 Wet ESP
6.3.1 Ability to Filter Heavy Metals Drives Demand for Wet ESP
7 Electrostatic Precipitator Market, By Offering (Page No. - 51)
7.1 Introduction
7.2 Hardware & Software
7.2.1 Discharge Electrodes
7.2.1.1 Discharge Electrodes are Used in an ESP to Provide Voltage and Emit Charging Current for Generating an Electric Field
7.2.2 High Voltage Electrical Systems
7.2.2.1 High Voltage Electrical Systems Provide Electrical Field Between Collection and Discharge Electrodes
7.2.3 Collection Electrodes
7.2.3.1 Collection Electrodes in an ESP are Used for Receiving and Retaining Precipitated Dust Particles
7.2.4 Hoppers
7.2.4.1 Hoppers are Used to Collect and Store Precipitated Dust Particles Removed During Rapping
7.2.5 Rappers
7.2.5.1 Rappers are Used for Imparting Vibrations to Electrodes for Removing Accreted Dust Particles
7.2.6 Shell
7.2.6.1 Shell is Base Structure, Which Supports ESP
7.3 Services
7.3.1 Requirement for Upgrading Emission Control Equipment, Including ESP, Drives Demand for Servicing
8 Electrostatic Precipitator Market, By End User (Page No. - 58)
8.1 Introduction
8.2 Power & Electricity
8.2.1 Coal Power Plant
8.2.1.1 High Pollutant Emission From Thermal Power Plants Using Coal Will Drive Demand for ESP
8.2.2 Petroleum Refineries and Power Plants
8.2.2.1 an Array of Particulate Matters Released From Firing Boilers to Generate Steam for Electricity Production to Support in Adoption of ESP By Petroleum Refineries and Power Plants
8.3 Metals
8.3.1 Foundries
8.3.1.1 Relatively Old and Smaller Foundries Operating Obsolete Equipment Responsible for High Carbon Particle Emissions to Drive Demand for ESP in Foundries
8.3.2 Iron and Steel Manufacturing
8.3.2.1 Release of Several Pollutants has Led to Adoption of Different Regulations By Several Countries, Driving Demand for ESP From Iron and Steel Companies
8.3.3 Aluminum Smelting
8.3.3.1 Aluminum Extraction From Bauxite Releasing Large Amount of Carbon to Support Growing Demand for ESP From Aluminum Smelting Companies
8.3.4 Nonferrous Metal Production and Processing
8.3.4.1 Metal Production and Processing of Non-Ferrous Metals Generates Considerable Amount of Pollutants, Boosting Demand for ESP From Nonferrous Metal Production and Processing Companies
8.4 Cement
8.4.1 Emission of Several Pollutants, Including Particulate Matter, Heavy Metals, and Gases, to Support Growing Demand for ESP From Cement Companies
8.5 Chemicals
8.5.1 Basic Chemicals Manufacturers
8.5.1.1 Manufacturing Basic Chemicals, Such as Caustic Soda, Ammonia, Chlorine, Sulfuric Acid, Methanol, and Xylenes, Generates an Array of Pollutants, Driving Demand for ESP
8.5.2 Specialty Chemicals Manufacturers
8.5.2.1 High Demand for Specialty Chemicals has Resulted in Increased Production, Which has Also Increased Amount of Pollutant Released, Ultimately Driving ESP Adoption
8.5.3 Consumer Chemical Manufacturers
8.5.3.1 Consumer Chemicals Manufacturing Involves Several Processes Including Blending, Mixing, Or Diluting Basic Chemicals, Which Generates Large Amount of Particulates, Boosting Growth of ESP Market
8.6 Others
8.6.1 Others End Users, Including Pulp and Paper, Mining, and Glass Industries, Releasing Pollutants Into Environment has Boosted Demand for ESP
9 Geographic Analysis (Page No. - 83)
9.1 Introduction
9.2 North America
9.2.1 US
9.2.1.1 Coal- and Gas-Fired Power Plants Being Main Sources of Power Generation in the US has Contributed in Growth of ESP Market
9.2.2 Canada
9.2.2.1 Presence of A Large Number of Manufacturing Facilities and Tightening Particulate Emission Control Regulations By Government has Boosted Demand for ESP
9.2.3 Mexico
9.2.3.1 Country�s Evolution as A Major Industrial Hub for Companies Drives Demand for ESP
9.3 Europe
9.3.1 Germany
9.3.1.1 Presence of Prominent Cement, Glass, and Chemical Companies is Expected to Boost Growth of ESP Market in Germany
9.3.2 The UK
9.3.2.1 Several Companies Establishing Manufacturing Units Here has Boosted Demand for ESP
9.3.3 France
9.3.3.1 Rising Environmental Concerns Among Manufacturers and French Government has Contributed to Growth in Demand for ESP
9.3.4 Rest of Europe
9.3.4.1 Large-Scale Industrialization Led to Increased Demand for ESP in Rest of Europe
9.4 APAC
9.4.1 China
9.4.1.1 Air Pollution Because of Dust Particles in Several Major Chinese Cities has Contributed to Growth in Demand for ESP
9.4.2 Japan
9.4.2.1 Presence of Prominent Pulp and Paper, Glass, and Chemical Manufacturing Companies is Boosting Demand for ESP
9.4.3 India
9.4.3.1 Deteriorating Air Quality in Indian Cities is A Major Factor for Adoption of ESP Here
9.4.4 Rest of APAC
9.4.4.1 Growing Industrialization has Increased Demand for ESP in These Countries
9.5 RoW
9.5.1 Mea
9.5.1.1 Growth of Industries, Such as Power & Electricity, Mining, and Metals, in MEA Drives Demand for ESP
9.5.2 South America
9.5.2.1 Rising Concerns Regarding Environmental Pollution and Growing Industrialization Have Boosted Adoption of ESP Here
10 Competitive Landscape (Page No. - 111)
10.1 Introduction
10.2 Ranking Analysis of Electrostatic Precipitator Market Players
10.3 Competitive Scenario
10.3.1 Contracts
10.3.2 Expansions
10.3.3 Mergers/Acquisitions
10.3.4 Partnerships, Collaborations, and Joint Ventures
11 Company Profiles (Page No. - 119)
11.1 Key Players
(Business Overview, Products Offered, Recent Developments, MnM View, SWOT Analysis)*
11.1.1 General Electric
11.1.2 Mitsubishi Hitachi Power Systems
11.1.3 Siemens
11.1.4 AMEC Foster Wheeler
11.1.5 Babcock & Wilcox
11.1.6 Thermax Global
11.1.7 Ducon Technologies
11.1.8 Fujian Longking
11.1.9 Hamon Group
11.1.10 Trion
11.2 Other Companies
11.2.1 KC Cottrell
11.2.2 Feida
11.2.3 Flsmidth
11.2.4 Sinoma-Tec
11.2.5 Bhel
11.2.6 Sumitomo Heavy Industries
11.2.7 Fuel Tech
11.2.8 IS Saveenergy
11.2.9 PPC Industries
11.2.10 Balcke-Durr
*Business Overview, Products Offered, Recent Developments, MnM View, SWOT Analysis Might Not Be Captured in Case of Unlisted Companies.
12 Appendix (Page No. - 145)
12.1 Insights of Industry Experts
12.3 Knowledge Store: Marketsandmarkets� Subscription Portal
12.4 Available Customizations
12.5 Related Reports
12.6 Author Details
List of Tables (67 Tables)
Table 1 Prominent Countries With Air Quality Regulations
Table 2 Top 10 Cement Producing Countries/Regions (In Million Tonnes)
Table 3 Electrostatic Precipitator Market, By Type, 2015�2023 (USD Million)
Table 4 Dry Electrostatic Precipitator Market, By End User , 2015�2023 (USD Million)
Table 5 Wet Electrostatic Precipitator Market, By End User , 2015�2023 (USD Million)
Table 6 Electrostatic Precipitator Market, By Offering, 2015�2023 (USD Million )
Table 7 Electrostatic Precipitator Hardware & Software Market, By End User, 2015�2023 (USD Million )
Table 8 Electrostatic Precipitator Hardware & Software Market, By Type, 2015�2023 (Units)
Table 9 Electrostatic Precipitator Services Market, By End User, 2015�2023 (USD Million)
Table 10 Electrostatic Precipitator Market, By End User, 2015�2023 (USD Million)
Table 11 Electrostatic Precipitator Market for Power & Electricity Industry, By Offering, 2015�2023 (USD Million)
Table 12 Electrostatic Precipitator Market for Power & Electricity Industry, By Region, 2015�2023 (USD Million)
Table 13 Electrostatic Precipitator Market for Power & Electricity Industry, By APAC Countries, 2015�2023 (USD Million)
Table 14 Market for Power & Electricity Industry, By European Countries, 2015�2023 (USD Million)
Table 15 Electrostatic Precipitator Market for Power & Electricity Industry, By North American Countries, 2015�2023 (USD Million)
Table 16 Electrostatic Precipitator Market for Power & Electricity Industry, By RoW Regions, 2015�2023 (USD Million)
Table 17 Electrostatic Precipitator Market for Metal Industry, By Offering, 2015�2023 (USD Million)
Table 18 Electrostatic Precipitator Market for Metal Industry, By Region, 2015�2023 (USD Million)
Table 19 Market for Metal Industry, By APAC Countries, 2015�2023 (USD Million)
Table 20 Electrostatic Precipitator Market for Metal Industry, By European Countries, 2015�2023 (USD Million)
Table 21 Electrostatic Precipitator Market for Metal Industry, By North American Countries, 2015�2023 (USD Million)
Table 22 Electrostatic Precipitator Market for Metal Industry, By RoW Regions, 2015�2023 (USD Million)
Table 23 Electrostatic Precipitator Market for Cement Industry, By Offering, 2015�2023 (USD Million)
Table 24 Market for Cement Industry, By Region, 2015�2023 (USD Million)
Table 25 Electrostatic Precipitator Market for Cement Industry, By APAC Countries, 2015�2023 (USD Million)
Table 26 Electrostatic Precipitator Market for Cement Industry, By European Countries, 2015�2023 (USD Million)
Table 27 Electrostatic Precipitator Market for Cement Industry, By North American Countries, 2015�2023 (USD Million)
Table 28 Electrostatic Precipitator Market for Cement Industry, By RoW Regions, 2015�2023 (USD Million)
Table 29 Market for Chemicals Industry, By Offering, 2015�2023 (USD Million)
Table 30 Electrostatic Precipitator Market for Chemicals Industry, By Region, 2015�2023 (USD Million)
Table 31 Electrostatic Precipitator Market for Chemicals Industry, By APAC Countries, 2015�2023 (USD Million)
Table 32 Electrostatic Precipitator Market for Chemicals Industry, By European Countries, 2015�2023 (USD Million)
Table 33 Electrostatic Precipitator Market for Chemicals Industry, By North American Countries, 2015�2023 (USD Million)
Table 34 Market for Chemicals Industry, By RoW Regions, 2015�2023 (USD Million)
Table 35 Electrostatic Precipitator Market for Others, By Offering, 2015�2023 (USD Million)
Table 36 Electrostatic Precipitator Market for Others, By Region, 2015�2023 (USD Million)
Table 37 Electrostatic Precipitator Market for Others, By APAC Countries, 2015�2023 (USD Million)
Table 38 Electrostatic Precipitator Market for Others, By European Countries, 2015�2023 (USD Million)
Table 39 Market for Others, By North American Countries, 2015�2023 (USD Million)
Table 40 Electrostatic Precipitator Market for Others, By RoW Regions, 2015�2023 (USD Million)
Table 41 Electrostatic Precipitator Market, By Region, 2015�2023 (USD Million)
Table 42 Electrostatic Precipitator Market in North America, By Country, 2015�2023 (USD Million)
Table 43 Electrostatic Precipitator Market in North America, By End User, 2015�2023 (USD Million)
Table 44 Market in Us, By End User, 2015�2023 (USD Million)
Table 45 Electrostatic Precipitator Market in Canada, By End User, 2015�2023 (USD Million)
Table 46 Electrostatic Precipitator Market in Mexico, By End User, 2015�2023 (USD Million)
Table 47 Electrostatic Precipitator Market in Europe, By Country, 2015�2023 (USD Million)
Table 48 Electrostatic Precipitator Market in Europe, By End User, 2015�2023 (USD Million)
Table 49 Market in Germany, By End User, 2015�2023 (USD Million)
Table 50 Electrostatic Precipitator Market in Uk, By End User, 2015�2023 (USD Million)
Table 51 Electrostatic Precipitator Market in France, By End User, 2015�2023 (USD Million)
Table 52 Electrostatic Precipitator Market in RoE, By End User, 2015�2023 (USD Million)
Table 53 Electrostatic Precipitator Market in APAC, By Country, 2015�2023 (USD Million)
Table 54 Market in APAC, By End User, 2015�2023 (USD Million)
Table 55 Electrostatic Precipitator Market in China, By End User, 2015�2023 (USD Million)
Table 56 Electrostatic Precipitator Market in Japan, By End User, 2015�2023 (USD Million)
Table 57 Electrostatic Precipitator Market in India, By End User, 2015�2023 (USD Million)
Table 58 Electrostatic Precipitator Market in RoAPAC, By End User, 2015�2023 (USD Million)
Table 59 Market in RoW, By Region, 2015�2023 (USD Million)
Table 60 Electrostatic Precipitator Market in RoW, By End User, 2015�2023 (USD Million)
Table 61 Electrostatic Precipitator Market in Mea, By End User, 2015�2023 (USD Million)
Table 62 Electrostatic Precipitator Market in South America, By End User, 2015�2023 (USD Million)
Table 63 Top Electrostatic Precipitator Market Players in 2017
Table 64 Contracts, 2015�2018
Table 65 Expansions, 2015�2018
Table 66 Mergers/Acquisitions, 2015�2018
Table 67 Partnerships, Collaborations, and Joint Ventures, 2015�2018
List of Figures (60 Figures)
Figure 1 Electrostatic Precipitator Market: Research Design
Figure 2 Market Size Estimation Methodology: Bottom-Up Approach
Figure 3 Market Size Estimation Methodology: Top-Down Approach
Figure 4 Assumptions for the Research Study
Figure 5 Global Electrostatic Precipitator Market (USD Million )
Figure 6 Power & Electricity Industry to Hold Largest Share of Electrostatic Precipitator Market By 2017
Figure 7 Hardware & Software to Hold Larger Share of Market During Forecast Period, By Offering
Figure 8 Dry ESP Held Larger Share of Electrostatic Precipitator Market in 2017, By Type
Figure 9 Electrostatic Precipitator Market, By Region, 2017
Figure 10 Tightening Air Pollution Control Regulations Supported By Growth in Coal-Fired Power Plants to Propel Growth of Market in Near Future
Figure 11 China Held Largest Share of Electrostatic Precipitator Market in APAC in 2017
Figure 12 Hardware & Software Held Larger Share of Market in 2017, By Offering
Figure 13 Dry ESP to Hold Larger Size of Electrostatic Precipitator Market in 2023, By Type
Figure 14 Power & Electricity Industry to Hold Largest Share of Market By 2023
Figure 15 China Held Largest Share of Electrostatic Precipitator Market in 2017
Figure 16 Electrostatic Precipitator Market: Drivers, Restraints, Opportunities, and Challenges
Figure 17 Global Electricity Power Generation From Coal
Figure 18 Death Rate From Ambient Particulate Matter (Per 100,000 People), 1990-2015
Figure 19 Cost Involved in Electrostatic Precipitator Installation
Figure 20 Global Power Generation Forecast
Figure 21 Value Chain Analysis: Major Value Added During System Integration and Deployment Phase
Figure 22 Dry Electrostatic Precipitator Market to Grow at Higher CAGR During Forecast Period
Figure 23 Dry Electrostatic Precipitator Market for Others to Grow at Highest CAGR During Forecast Period
Figure 24 Wet Electrostatic Precipitator Market for Others to Grow at Highest CAGR During Forecast Period
Figure 25 Electrostatic Precipitator Services Market to Grow at Higher CAGR During Forecast Period
Figure 26 Power & Electricity Industry to Lead Electrostatic Precipitator Hardware & Software Market During Forecast Period
Figure 27 Electrostatic Precipitator Services Market for Others to Grow at Highest CAGR During Forecast Period
Figure 28 Electrostatic Precipitator Market for Others to Grow at Highest CAGR During Forecast Period
Figure 29 Hardware & Software Offerings to Lead Market for Power & Electricity Industry During Forecast Period, By Market Size
Figure 30 Germany to Lead Market for Power & Electricity Industry in Europe During Forecast Period, By Market Size
Figure 31 Hardware & Software Offerings to Lead Electrostatic Precipitator Market for Metal Industry During Forecast Period, By Market Size
Figure 32 Germany to Lead Electrostatic Precipitator Market for Metal Industry in Europe During Forecast Period, By Market Size
Figure 33 Hardware & Software Offerings to Lead Electrostatic Precipitator Market for Cement Industry During Forecast Period, By Market Size
Figure 34 Germany to Lead Electrostatic Precipitator Market for Cement Industry in Europe During Forecast Period, By Market Size
Figure 35 Hardware & Software Offerings to Lead Market for Chemicals Industry During Forecast Period, By Market Size
Figure 36 Germany to Lead Electrostatic Precipitator Market for Chemicals Industry in Europe During Forecast Period, By Market Size
Figure 37 Hardware & Software Offerings to Lead Market for Others During Forecast Period, By Market Size
Figure 38 Germany to Lead Electrostatic Precipitator Market for Others in Europe During Forecast Period, By Market Size
Figure 39 Geographic Snapshot: Electrostatic Precipitator Market in RoW to Grow at High CAGR During Forecast Period
Figure 40 RoW to Exhibit Highest CAGR in Market During Forecast Period
Figure 41 Snapshot of Electrostatic Precipitator Market in North America
Figure 42 Mexico to Witness Highest CAGR in North American Electrostatic Precipitator Market During Forecast Period
Figure 43 Others to Witness Highest CAGR in Market in US During Forecast Period
Figure 44 Snapshot of Electrostatic Precipitator Market in Europe
Figure 45 RoE to Witness Highest CAGR in European Electrostatic Precipitator Market During Forecast Period
Figure 46 Others to Witness Highest CAGR in Market in Germany During Forecast Period
Figure 47 Snapshot of Electrostatic Precipitator Market in APAC
Figure 48 India to Witness Highest CAGR in APAC Electrostatic Precipitator Market During Forecast Period
Figure 49 Power & Electricity Industry to Witness Highest CAGR in Chinese Market During Forecast Period
Figure 50 Others to Witness Highest CAGR in RoAPAC Electrostatic Precipitator Market During Forecast Period
Figure 51 Electrostatic Precipitator Market in MEA to Grow at Higher CAGR During Forecast Period
Figure 52 Contracts Emerged as Key Growth Strategy Adopted By Major Players in Electrostatic Precipitator Market From 2015 to 2018
Figure 53 Market Evolution Framework: Contracts, Followed By Expansions, Fuelled Market�s Growth (2015�2018)
Figure 54 General Electric: Company Snapshot
Figure 55 Siemens: Company Snapshot
Figure 56 AMEC Foster Wheeler: Company Snapshot
Figure 57 Babcock & Wilcox: Company Snapshot
Figure 58 Thermax Global: Company Snapshot
Figure 59 Fujian Longking: Company Snapshot
Figure 60 Hamon Group: Company Snapshot


Growth opportunities and latent adjacency in Electrostatic Precipitator Market
We are in the business in Green Energy and Environmental Protection particularly for steel plant. We are involved in providing consultancy services for upgradation of Electrostatic Precipitator for Steel Plant in conforms to emission regulation by Government of India. In this context we are trying to explore adoption of new technology as retrofit measures for enhancement of ESP performance we therefore are interested the potential ESP market particularly Iron & Steel Plant in India we request your co-operation. In this regards we are interested in purchasing the market survey report for ESP. kindly advice further.
Palm oil companies in Malaysia is specifying a particular type of rapping system to be used in an esp. Is it a rule laid down by the government bodies ?