Virtual Router Market by Component (Solution (Integrated and Standalone) and Service), Type (Predefined and Custom), End-User (Service Provider (Telecom, Data Center, and Cloud) and Enterprises), and Region - Global forecast to 2023


[125 Pages Report] A virtual router is a software that can perform hardware-based (Layer-3) IP routing when deployed over COTS hardware. Virtual routing is a form of NFV, and it offers several advantages over traditional hardware routers in terms of speed, efficiency, and CAPEX, and OPEX. The virtual router makes it easier to manage complex CPE functions in the network by reducing the number of physical router requirements. Virtual routers enable the decoupling of the control plane and data plane, which in traditional chassis-based routers are bound to the same Central Processing Unit (CPU), tightly linking traditional chassis-based router deployments to a single system and inherently exposing the entire system to a single point of failure. Virtual router solutions make it possible to independently allocate physical data center resources for virtual machines within the network. Processing cores and memory can be dynamically allocated to these virtual machines to grow their capacity with the growing requirements independently.
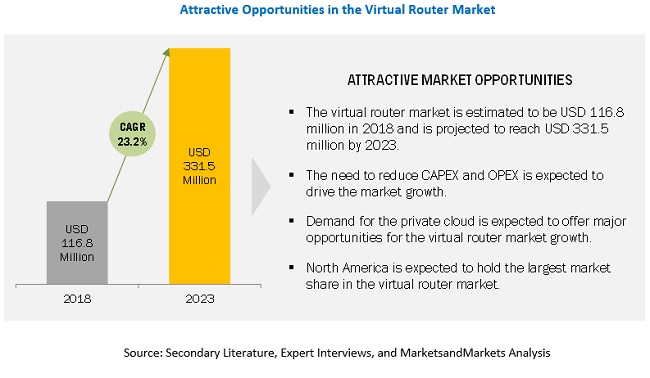
The global virtual router market size is expected to grow from USD 86.8 million in 2017 to USD 331.5 million by 2023, at a Compound Annual Growth Rate (CAGR) of 23.2% during the forecast period. The major factors driving the growth of the market are the decrease in CAPEX and OPEX, growth in demand for SDN and NFV, and the increasing need for mobility.
�By component, the solution segment will dominate the market during the forecast period�
The virtual router market, by component, has been segmented into solution and service. The solution segment is expected to have the largest market size and will grow at a rapid pace during the forecast period as the virtual routing solutions help to independently allocate physical data center resources for virtual machines within the network and grow the capacity of virtual machines independently as per requirement, lowering the hardware costs.
�By solution, the integrated solution segment will dominate the market during the forecast period�
The virtual router market, by solution has been segmented into integrated solution and standalone solution. The integrated solution includes virtual router offerings integrated in a large SDN and NFV suite. These integrated large suite provide outstanding throughput performance by offering high transparency and better control of the routing capability and saving operational costs leading to the adoption of integrated solutions in virtual router market.
�By service, the professional services segment will dominate the market during the forecast period�
The service segment in the virtual router market has been segmented into professional services and managed services. The rising demand for tailor-made features to improve performance efficiencies and the need to provide technical support and consulting service for adding value to interaction with clients is leading to the adoption of professional services in virtual router market.
�By type, the custom segment will dominate the market during the forecast period�
The virtual router market, by type, has been segmented into custom and predefined. Custom segment is expected to account for larger market size during the forecast period as custom virtual router enables creating and configuring additional virtual routers within the single routing device as per requirement leading to its adoption in virtual router market.
�By end-user, the service provider segment will dominate the market during the forecast period�
The service provider segment in the virtual router market is expected to account for larger market size during the forecast period as the deployment of virtual router helps service providers to increase their network agility and deliver scalable and flexible routing functionalities with considerable reduction in CAPEX and OPEX.
�By service provider, the telecom segment will dominate the market during the forecast period�
The virtual router market, by service provider has been segmented into telecom, data center, and cloud. The telecom service provider segment is expected to have the highest adoption of virtual routers during the forecast period as the virtual routers enable them to scale the resources and boost the overall network capacity. Virtual routers provides control over flexible scaling and deployment options lowering the operational costs for telecom service providers.
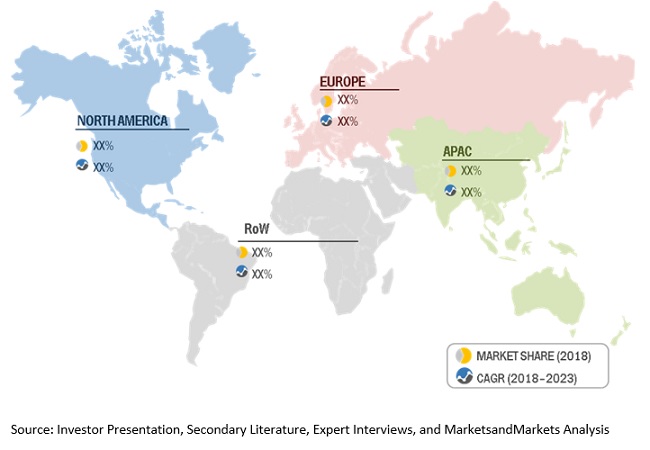
�APAC is expected to grow at the highest growth rate during the forecast period.�
The virtual router market is expected to gain traction in all the major regions across the globe. North America and Europe, along with some countries in RoW, are witnessing the latest developments in networking technology. Increasing demand for network optimization, private cloud adoption, rising need for mobility, increasing deployment of SDN and NFV infrastructure, and rising trend of Bring Your Own Device (BYOD)across enterprises are the prime factors expected to drive the overall market growth in APAC and Europe. North America is projected to attain steady growth during the forecast period, while countries in RoW are still in the implementation stage and are expected to achieve decent growth during the forecast period.
Market Dynamics
Driver: Reduction in CAPEX and OPEX
In the network environment, hardware maintenance is an added expenditure, and enterprises primarily focus on reducing the cost associated with the same. With the growth in the acceptance of the virtualization environment, organizations can considerably reduce the cost associated with the maintenance of the dedicated routers. A virtual router is a software-based routing methodology that enables the host machine to work as a typical hardware router. Moreover, virtual routers include all components that are provided by the physical router, excluding any physical infrastructure. Internet and cloud services providers, by deploying virtual routers, can focus on reducing the cost required to invest in large hardware containers, as virtual routers can be opted/deployed according to the as-pay-as-you-grow model. Hence, virtual routers can help services providers leverage the benefits offered by the virtualization technology, thereby assisting considerable reduction in CAPEX and OPEX. This, in turn, is further expected to drive the market in the coming years.
Restraint: Reluctance in moving from the legacy system to the virtualized environment
The reluctance in moving from the legacy system to the virtualized environment can be one of the restraining factors in the virtual router market. Several service providers, such as Internet Service Provider (ISP) and telecom, continue to maintain and operate legacy systems, which are complex to manage. The legacy systems pose various challenges related to the maintenance cost and the lack of compatibility on various platforms. The new virtual router software solutions need to be customized for supporting the traditional architecture and infrastructure. These solutions must be properly integrated with the existing infrastructure to realize the benefits, thus there is always a risk this integration would be incomplete. Hence, when deploying a new virtual router application into operations, services providers are reluctant to convert old services to the new virtualized environment. Some telecom operators are continuing to use the traditional systems, which are not capable of supporting new services for increasing the customer base. However, service providers across the globe have gradually started implementing virtual router solutions into their operations to accelerate time-to-market, reduce the infrastructure maintenance cost, and increase RoI.
Opportunity: Demand for private cloud
Organizations are moving toward the private cloud to leverage the benefits, such as security and privacy, efficiency, and customization. The adoption of virtual routers through the private cloud can help organizations effectively manage their network while reducing the cost associated with the management of the virtual router infrastructure. Moreover, the deployment of virtual routers via the private cloud offers a cost-effective way, thereby helping IT teams effectively manage organizations� entire network.
Challenge: Lack of skills and expertise
Lack of skills and expertise can be seen as one of the challenges in the virtual router market. Engineers with the skills and expertise to implement virtualized router software solutions in next-generation networks and data centers are becoming crucial. Large organizations may have people with the required skillsets, but Small and Medium-sized Enterprises (SMEs) may have to hire people on a contract basis to deploy solutions in a virtualized environment. Any error in the integration and deployment of these solutions may adversely impact the network infrastructure, thereby impacting the revenue and customer satisfaction.
Get online access to the report on the World's First Market Intelligence Cloud
- Easy to Download Historical Data & Forecast Numbers
- Company Analysis Dashboard for high growth potential opportunities
- Research Analyst Access for customization & queries
- Competitor Analysis with Interactive dashboard
- Latest News, Updates & Trend analysis
Request Sample Scope of the Report
Get online access to the report on the World's First Market Intelligence Cloud
- Easy to Download Historical Data & Forecast Numbers
- Company Analysis Dashboard for high growth potential opportunities
- Research Analyst Access for customization & queries
- Competitor Analysis with Interactive dashboard
- Latest News, Updates & Trend analysis

|
Report Metric |
Details |
|
Market size available for years |
2016 � 2023 |
|
Base year considered |
2017 |
|
Forecast period |
2018 -2023 |
|
Forecast units |
Million/Billion (USD) |
|
Segments covered |
Component, Type, End-User, and Geography |
|
Geographies covered |
North America, Europe, APAC, RoW (South America, Middle East, and Africa) |
|
Companies covered |
Key market players, including |
The research report categorizes the Virtual Router Market to forecast the revenues and analyze the trends in each of the following sub-segments:
Virtual Router Market, By Component
- Solution
- Integrated Solution
- Standalone Solution
- Service
- Professional Services
- Managed Services
Virtual Router Market, By Type
- Pre-defined
- Custom
Virtual Router Market, By End-User
- Service Provider
- Telecom
- Data Center
- Cloud
- Enterprises*
Market, By Geography
- North America
- Europe
- Asia Pacific (APAC)
- RoW
Key Market Players
Cisco Systems, Inc. (Cisco); Ericsson Inc. (Ericson); Nokia Corporation (Nokia); Juniper Networks, Inc. (Juniper); 128 Technology, Inc. (128 Technology);
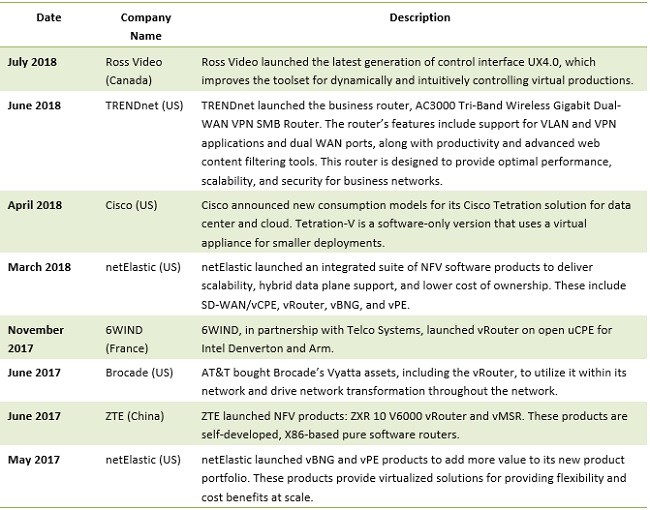
Recent Developments
Critical questions the report answers:
- What are the upcoming trends for the Virtual Router market?
- Which segment provides the most opportunity for growth?
- Who are the leading vendors operating in this market?
- What are the opportunities for new market entrants?
To speak to our analyst for a discussion on the above findings, click Speak to Analyst
Table of Contents
1 Introduction (Page No. - 15)
1.1 Objectives of the Study
1.2 Market Definition
1.3 Market Scope
1.4 Years Considered for the Study
1.5 Currency
1.6 Stakeholders
2 Research Methodology (Page No. - 18)
2.1 Research Data
2.1.1 Secondary Data
2.1.2 Primary Data
2.1.2.1 Breakdown of Primaries
2.1.2.2 Key Industry Insights
2.2 Market Size Estimation
2.2.1 Bottom-Up Approach
2.2.2 Top-Down Approach
2.3 Research Assumptions
2.4 Limitations
3 Executive Summary (Page No. - 24)
4 Premium Insights (Page No. - 29)
4.1 Attractive Market Opportunities in the Virtual Router Market
4.2 Market By Service Provider
4.3 Market Analysis, By Region
4.4 Market Investment Scenario
5 Market Overview and Industry Trends (Page No. - 32)
5.1 Introduction
5.2 Market Dynamics
5.2.1 Drivers
5.2.1.1 Reduction in Capex and OPEX
5.2.1.2 Increase in the Demand for SDN and NFV is Expected to Boost the Adoption of Virtual Router
5.2.1.3 Increasing Need for Mobility
5.2.2 Restraints
5.2.2.1 Reluctance in Moving From the Legacy System to the Virtualized Environment
5.2.3 Opportunities
5.2.3.1 Demand for Private Cloud
5.2.3.2 Virtual Router Applications Across Network Segments
5.2.4 Challenges
5.2.4.1 Security Concerns Related to the Virtualized Environment
5.2.4.2 Lack of Skills and Expertise
5.3 Virtual Router Market: Use Cases
5.3.1 Use Case: Scenario 1
5.3.2 Use Case: Scenario 2
5.3.3 Use Case: Scenario 3
5.3.4 Use Case: Scenario 4
5.4 Standards
5.4.1 Transparent Interconnection of Lots of Links (Trill)
5.4.2 Virtual Ethernet Port Aggregator (VEPA)
5.4.3 Virtual Extensible Local Area Network (VXLAN)
5.4.4 Network Virtualization Using Generic Routing Encapsulation (NVGRE)
5.4.5 Shortest Path Bridging (SPB)
5.4.6 Fiber Channel Over Ethernet (FCOE)
5.4.7 Data Center Bridging (DCB)
5.4.7.1 PFC (802.1Qbb)
5.4.7.2 Bandwidth Management (802.1Qaz)
5.4.7.3 Congestion Management (802.1Qau)
5.4.7.4 Data Center Bridging Exchange (DCBX)
6 Virtual Router Market, By Component (Page No. - 39)
6.1 Introduction
6.2 Solution
6.2.1 Integrated Solution
6.2.2 Standalone Solution
6.3 Service
6.3.1 Professional Services
6.3.2 Managed Services
7 Market By Type (Page No. - 47)
7.1 Introduction
7.2 Custom
7.3 Predefined
8 Market, By End-User (Page No. - 50)
8.1 Introduction
8.2 Service Provider
8.2.1 Telecom
8.2.2 Data Center
8.2.3 Cloud
8.3 Enterprises
8.3.1 Banking, Financial Services, and Insurance
8.3.2 Manufacturing
8.3.3 Healthcare
8.3.4 Government and Defense
8.3.5 Education
9 Virtual Router Market, By Region (Page No. - 57)
9.1 Introduction
9.2 North America
9.2.1 United States
9.2.2 Canada
9.3 Europe
9.3.1 United Kingdom
9.3.2 Germany
9.3.3 France
9.3.4 Rest of Europe
9.4 Asia Pacific
9.4.1 China
9.4.2 Japan
9.4.3 India
9.4.4 Rest of APAC
9.5 Rest of the World
9.5.1 Israel
9.5.2 United Arab Emirates
9.5.3 Mexico
9.5.4 Rest of RoW
10 Competitive Landscape (Page No. - 75)
10.1 Overview
10.2 Competitive Scenario
10.2.1 New Product/Service Launches and Upgradations
10.2.2 Partnerships, Collaborations, and Agreements
10.2.3 Mergers and Acquisitions
11 Company Profiles (Page No. - 79)
11.1 Introduction
(Business Overview, Products Offered, Recent Developments, SWOT Analysis, and MnM View)*
11.2 Cisco
11.3 Ericsson
11.4 Huawei Technologies
11.5 Nokia
11.6 Juniper Networks
11.7 IBM
11.8 Netelastic
11.9 Brocade
11.1 HPE
11.11 Arista Networks
11.12 ZTE Corporation
11.13 Carbyne
11.14 Palo Alto Networks
11.15 Ross Video
11.16 6wind
11.17 128 Technology
11.18 Trendnet
11.19 Linksys
11.20 Time
11.21 Allied Telesis
11.22 Check Point
11.23 Inventum
11.24 Drivenets
11.25 Access
11.26 Connectify
*Details on Business Overview, Products Offered, Recent Developments, SWOT Analysis, and MnM View Might Not Be Captured in Case of Unlisted Companies.
12 Appendix (Page No. - 117)
12.1 Insights of Industry Experts
12.2 Discussion Guide
12.3 Knowledge Store: MarketsandMarkets� Subscription Portal
12.4 Related Reports
12.5 Author Details
List of Tables (54 Tables)
Table 1 United States Dollar Exchange Rate, 2015�2017
Table 2 Global Virtual Router Market Size and Growth Rate, 2016�2023 (USD Million, Y-O-Y %)
Table 3 Global Mobile Data Traffic, 2016�2021
Table 4 Market Size By Component, 2016�2023 (USD Million)
Table 5 Market Size By Solution, 2016�2023 (USD Million)
Table 6 Solution: Virtual Router Market Size By Region, 2016�2023 (USD Million)
Table 7 Integrated Solution: Market Size By Region, 2016�2023 (USD Million)
Table 8 Standalone Solution: Market Size By Region, 2016�2023 (USD Million)
Table 9 Market Size, By Service, 2016�2023 (USD Million)
Table 10 Service: Market Size By Region, 2016�2023 (USD Million)
Table 11 Professional Services: Market Size By Region, 2016�2023 (USD Million)
Table 12 Managed Services: Market Size By Region, 2016�2023 (USD Million)
Table 13 Virtual Router Market Size, By Type, 2016�2023 (USD Million)
Table 14 Custom: Market Size By Region, 2016�2023 (USD Million)
Table 15 Predefined: Market Size By Region, 2016�2023 (USD Million)
Table 16 Market Size By End-User, 2016�2023 (USD Million)
Table 17 Market Size By Service Provider, 2016�2023 (USD Million)
Table 18 Service Provider: Market Size By Region, 2016�2023 (USD Million)
Table 19 Telecom: Virtual Router Market Size By Region, 2016�2023 (USD Million)
Table 20 Data Center: Market Size By Region, 2016�2023 (USD Million)
Table 21 Cloud: Market Size By Region, 2016�2023 (USD Million)
Table 22 Enterprises: Market Size By Region, 2016�2023 (USD Million)
Table 23 Virtual Router Market Size, By Region, 2016�2023 (USD Million)
Table 24 North America: Market Size By Country, 2016�2023 (USD Million)
Table 25 North America: Market Size By Type, 2016�2023 (USD Million)
Table 26 North America: Market Size By Component, 2016�2023 (USD Million)
Table 27 North America: Market Size By Solution, 2016�2023 (USD Million)
Table 28 North America: Market Size By Service, 2016�2023 (USD Million)
Table 29 North America: Market Size By End-User, 2016�2023 (USD Million)
Table 30 North America: Market Size By Service Provider, 2016�2023 (USD Million)
Table 31 Europe: Virtual Router Market Size, By Country, 2016�2023 (USD Million)
Table 32 Europe: Market Size By Type, 2016�2023 (USD Million)
Table 33 Europe: Market Size By Component, 2016�2023 (USD Million)
Table 34 Europe: Market Size By Solution, 2016�2023 (USD Million)
Table 35 Europe: Market Size By Service, 2016�2023 (USD Million)
Table 36 Europe: Market Size By End-User, 2016�2023 (USD Million)
Table 37 Europe: Market Size By Service Provider, 2016�2023 (USD Million)
Table 38 Asia Pacific: Virtual Router Market Size, By Country, 2016�2023 (USD Million)
Table 39 Asia Pacific: Market Size By Type, 2016�2023 (USD Million)
Table 40 Asia Pacific: Market Size By Component, 2016�2023 (USD Million)
Table 41 Asia Pacific: Virtual Router Market Size By Solution, 2016�2023 (USD Million)
Table 42 Asia Pacific: Market Size By Service, 2016�2023 (USD Million)
Table 43 Asia Pacific: Market Size By End-User, 2016�2023 (USD Million)
Table 44 Asia Pacific: Market Size By Service Provider, 2016�2023 (USD Million)
Table 45 Rest of the World: Virtual Router Market Size, By Country, 2016�2023 (USD Million)
Table 46 Rest of the World: Market Size By Type, 2016�2023 (USD Million)
Table 47 Rest of the World: Market Size By Component, 2016�2023 (USD Million)
Table 48 Rest of the World: Market Size By Solution, 2016�2023 (USD Million)
Table 49 Rest of the World: Market Size By Service, 2016�2023 (USD Million)
Table 50 Rest of the World: Market Size By End-User, 2016�2023 (USD Million)
Table 51 Rest of the World: Market Size By Service Provider, 2016�2023 (USD Million)
Table 52 New Product/Service Launches and Upgradations, 2018�2014
Table 53 Partnerships, Collaborations, and Agreements, 2018�2015
Table 54 Mergers and Acquisitions, 2018�2016
List of Figures (47 Figures)
Figure 1 Global Virtual Router Market Segmentation
Figure 2 Global Market Research Design
Figure 3 Breakdown of Primary Interviews: By Company, Designation, and Region
Figure 4 Data Triangulation
Figure 5 Market Size Estimation Methodology: Bottom-Up Approach
Figure 6 Market Size Estimation Methodology: Top-Down Approach
Figure 7 Virtual Router Market: Assumptions
Figure 8 Market Snapshot By Component
Figure 9 Market Snapshot By Solution (2023)
Figure 10 Market Snapshot By Service (2018�2023)
Figure 11 Market Snapshot By Type (2018�2023)
Figure 12 Market Snapshot By End-User
Figure 13 Market Snapshot By Service Provider
Figure 14 Virtual Router Market: Regional Snapshot
Figure 15 Increasing Demand to Reduce Capex and OPEX is One of the Major Factors Expected to Drive the Growth of the Market During the Forecast Period
Figure 16 Cloud Service Providers Segment is Expected to Grow at the Highest CAGR During the Forecast Period
Figure 17 Asia Pacific is Projected to Register the Highest Growth Potential By 2023
Figure 18 Asia Pacific is Expected to Emerge as the Best Opportunity Market for Investments in the Next 5 Years
Figure 19 Virtual Router Market: Drivers, Restraints, Opportunities, and Challenges
Figure 20 Service Segment is Expected to Register A Higher CAGR During the Forecast Period
Figure 21 Standalone Solution is Expected to Register A Higher CAGR During the Forecast Period
Figure 22 Professional Services Segment is Expected to Grow at A Higher CAGR During the Forecast Period
Figure 23 Custom Segment is Expected to Grow at A Higher CAGR During the Forecast Period
Figure 24 Enterprises Segment is Expected to Grow at A Higher CAGR During the Forecast Period
Figure 25 Cloud Service Providers Segment is Expected to Grow at the Highest CAGR During the Forecast Period
Figure 26 North America is Expected to Account for the Largest Market Size During the Forecast Period
Figure 27 Asia Pacific is Expected to Grow at the Highest CAGR During the Forecast Period
Figure 28 North America: Virtual Router Market Snapshot
Figure 29 Asia Pacific: Market Snapshot
Figure 30 Key Developments of the Major Players in the Virtual Router Market During 2016�2018
Figure 31 Cisco: Company Snapshot
Figure 32 Cisco: SWOT Analysis
Figure 33 Ericsson: Company Snapshot
Figure 34 Ericsson: SWOT Analysis
Figure 35 Huawei: Company Snapshot
Figure 36 Huawei: SWOT Analysis
Figure 37 Nokia: Company Snapshot
Figure 38 Nokia: SWOT Analysis
Figure 39 Juniper Networks: Company Snapshot
Figure 40 Juniper Networks: SWOT Analysis
Figure 41 IBM: Company Snapshot
Figure 42 HPE: Company Snapshot
Figure 43 Arista Networks: Company Snapshot
Figure 44 ZTE Corporation: Company Snapshot
Figure 45 Palo Alto Networks: Company Snapshot
Figure 46 Time: Company Snapshot
Figure 47 Check Point Software: Company Snapshot


Growth opportunities and latent adjacency in Virtual Router Market