Fiberglass Roving Market by Fiber Glass Type (E, ECR, H, AR, S),Product Type(Single-end, Multi-end, Chopped),End-use Industry (Transportation, Construction, Electrical & Electronics, Pipe & Tank, Wind, Aerospace, Marine),and Region Global Forecast to 2023


[133 Pages Report] Fiberglass Roving Market size was valued USD 7.74 billion in 2017 and is projected to reach USD 11.02 billion by 2023, at a CAGR of 6.0% during the forecast period. The demand for fiberglass roving is expected to increase significantly during the forecast period owing to its widespread use in end-use industries such as automotive & transportation, wind energy, and electrical & electronics. In this study, the years considered to estimate the market size for fiberglass roving are listed below:
- Base Year � 2017
- Estimated Year � 2018
- Projected Year � 2023
- Forecast Period � 2018�2023
2017 is considered as the base year for company profiles. Where information was not available for the base year, the previous year was considered.
Objectives of the Study:
- To define, describe, and forecast the fiberglass roving market size in terms of volume and value
- To provide detailed information about the key factors (drivers, restraints, opportunities, and challenges) influencing the growth of the market
- To analyze and forecast the market based on product type, glass fiber type, end-use industry, and region
- To analyze and forecast the market size with respect to five regions, namely, Asia Pacific (APAC), North America, Europe, Latin America, and the Middle East & Africa
- To analyze the market opportunities for stakeholders and provide a competitive landscape for market leaders
- To analyze competitive developments such as investment & expansions, partnerships & joint ventures, mergers & acquisitions, and new product launches in the market
- To strategically profile the key players and comprehensively analyze their market share and core competencies
Various secondary sources, such as Factiva, Hoovers, and Manta have been used to gain insights into the fiberglass roving market. The experts from leading companies manufacturing fiberglass roving have been interviewed to verify and collect critical information and assess the trends in the fiberglass roving market during the forecast period. The top-down, bottom-up, and data triangulation approaches have been implemented to calculate the exact values of the overall parent and each market sizes.
To know about the assumptions considered for the study, download the pdf brochure
The fiberglass roving market has a diversified and established ecosystem comprising upstream players, such as raw material suppliers, and downstream stakeholders, including manufacturers, vendors, and end users of fiberglass roving, as well as various government organizations. Leading players operating in the fiberglass roving market include Owens Corning (US), Jushi Group Co., Ltd. (China), Chongqing Polycomp International Corporation (China), Johns Manville Corporation (US), and among other companies.
Target Audience
- Manufacturers of fiberglass roving
- Suppliers of raw materials
- Distributors and suppliers of fiberglass roving
- End-use Industries
- Industry Associations
�This study answers several questions for stakeholders, primarily which market segments they need to focus on in the next 2�5 years to prioritize their efforts and investments.�
Get online access to the report on the World's First Market Intelligence Cloud
- Easy to Download Historical Data & Forecast Numbers
- Company Analysis Dashboard for high growth potential opportunities
- Research Analyst Access for customization & queries
- Competitor Analysis with Interactive dashboard
- Latest News, Updates & Trend analysis
Request Sample Scope of the Report
:
Get online access to the report on the World's First Market Intelligence Cloud
- Easy to Download Historical Data & Forecast Numbers
- Company Analysis Dashboard for high growth potential opportunities
- Research Analyst Access for customization & queries
- Competitor Analysis with Interactive dashboard
- Latest News, Updates & Trend analysis

This research report categorizes the fiberglass roving market based on product type, end-use industry, glass fiber type, and region. It forecasts revenue growth and analyzes trends in each of these submarkets.
Fiberglass Roving Market By End-use Industry:
- Transportation
- Construction & Infrastructure
- Electrical & Electronics
- Pipes & Tanks
- Marine
- Aerospace & Defense
- Wind Energy
- Others
Fiberglass Roving Market By Product Type:
- Single-end Roving
- Multi-end Roving
- Chopped Roving
Fiberglass Roving Market By Glass Fiber Type:
- E-glass
- ECR-glass
- H-glass
- AR-glass
- S-glass
- Others
Fiberglass Roving Market, By Region
- Asia Pacific
- North America
- Europe
- Middle East & Africa
- Latin America
Available Customizations
With the given market data, MarketsandMarkets offers customizations according to the specific needs of companies. The following customization options are available for the report:
Product Analysis
- Product matrix, which offers a detailed comparison of the product portfolio of each company
Regional Analysis
- Further breakdown of the APAC fiberglass roving market
- Further breakdown of the North America fiberglass roving market
- Further breakdown of the Europe fiberglass roving market
- Further breakdown of the Middle East & Africa fiberglass roving market
- Further breakdown of the Latin America fiberglass roving market
Company Information
- Detailed analysis and profiles of additional ten market players
The global fiberglass roving market is projected to grow from USD 8.24 billion in 2018 to USD 11.02 billion by 2023, at a CAGR of 6.0% during the forecast period. The fiberglass roving market is growing due to the high demand from the wind energy, electrical & electronics, pipes & tanks, construction & infrastructure, and transportation industries. Fiberglass roving products are preferred as they can reduce the weight of the product and are stronger than metallic parts. The fiberglass roving market witnessed strong growth in the past few years due to the growing use in the US, Germany, China, Brazil, and Japan.
The fiberglass roving market is segmented on the basis of glass fiber type into E-glass, ECR-glass, H-glass, AR-glass, S-glass, and others. The S-glass fiber segment is the fastest-growing glass fiber type. The E-glass fiber segment accounted for a major share in the global fiberglass roving market, in terms of value, in 2017. Fiberglass roving made with E-glass are cost-efficient and offer a wide range of properties such as corrosion resistance, lightweight, high electrical insulation, and moderate strength. The growing demand from the electrical & electronics and transportation industries is expected to drive the market during the forecast period.
The fiberglass roving market is segmented on the basis of product type into single-end roving, multi-end roving, and chopped roving. The single-end roving product type dominates the fiberglass roving market, in terms of volume, in 2018. The increasing demand from the filament winding and pultrusion applications is expected to drive the single-end fiberglass roving market during the forecast period.
The fiberglass roving market is segmented on the basis of end-use industry into wind energy, transportation, pipes & tanks, marine, construction & infrastructure, electrical & electronics, aerospace & defense, and others. The transportation end-use industry segment accounted for the largest share of the fiberglass roving market, in terms of value and volume, in 2018. The high demand for fiberglass roving in the transportation industry is attributed to its lightweight and increased fuel efficiency.
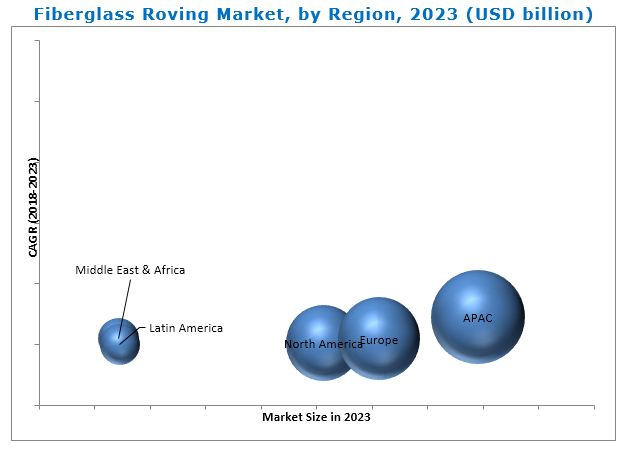
Currently, APAC is the largest consumer of fiberglass roving. China, Japan, and India are the major fiberglass roving markets in APAC due to the growing wind energy, construction & infrastructure, pipes & tanks, and electrical & electronics industries. The fiberglass roving market in APAC is also projected to register the highest CAGR during the forecast period. The growing demand for environmentally-friendly products as well as stringent emission control policies has made APAC the largest fiberglass roving market.
The global fiberglass roving market is expected to witness significant growth during the forecast period, in terms of value and volume. However, the high cost of technology and high investment costs are restraining the growth of the global fiberglass roving market.
Companies such as Owens Corning (US), Jushi Group (China), Chongqing Polycomp International Corp. (China), and Taishan Fiberglass (China) are some of the leading players in the global fiberglass roving market. Owens Corning has sustained the leading position in the market by tapping various lucrative markets globally. The company has made strategic alliances with local distribution centers in emerging markets to increase its share and customer base. As a part of its growth strategies, the company has mainly focused on investments & expansions and new product launches.
To speak to our analyst for a discussion on the above findings, click Speak to Analyst
Table of Contents
1 Introduction (Page No. - 14)
1.1 Objectives of the Study
1.2 Market Definition
1.3 Market Scope
1.3.1 Years Considered for the Study
1.4 Currency
1.5 Unit Considered
1.6 Limitations
1.7 Stakeholders
2 Research Methodology (Page No. - 17)
2.1 Research Data
2.1.1 Secondary Data
2.1.1.1 Key Data From Secondary Sources
2.1.2 Primary Data
2.1.2.1 Key Data From Primary Sources
2.1.2.2 Key Industry Insights
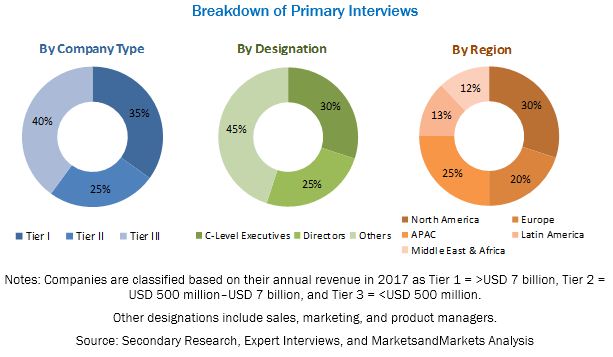
2.1.2.3 Breakdown of Primary Interviews
2.2 Market Size Estimation
2.2.1 Bottom-Up Approach
2.2.2 Top-Down Approach
2.3 Data Triangulation
2.3.1 Research Assumptions
3 Executive Summary (Page No. - 26)
4 Premium Insights (Page No. - 30)
4.1 Significant Growth Opportunities in the Fiberglass Roving Market
4.2 Fiberglass Roving By Market, By Product Type
4.3 Fiberglass Roving By Market Share, By Region and End-Use Industry, 2017
4.4 Fiberglass Roving By Market, By Country
4.5 Fiberglass Roving By Market, By Glass Fiber Type
5 Market Overview (Page No. - 33)
5.1 Introduction
5.2 Market Dynamics
5.2.1 Drivers
5.2.1.1 Increasing Wind Energy Installations
5.2.1.2 Increasing Adoption of GFRP Composites Made With Fiberglass Roving in the Transportation Industry
5.2.1.3 Increasing Use of Fiberglass Roving in the Construction & Infrastructure Industry
5.2.2 Restraints
5.2.2.1 Issues Related to Recycling
5.2.3 Opportunities
5.2.3.1 Increasing Demand for Fiberglass Roving From Emerging Markets
5.2.3.2 High Demand for Fiberglass Roving From GFRP Pipes Applications
5.2.4 Challenges
5.2.4.1 Developing Low-Cost Technologies
5.3 Porter�s Five Forces Analysis
5.3.1 Threat of New Entrants
5.3.2 Threat of Substitutes
5.3.3 Bargaining Power of Suppliers
5.3.4 Bargaining Power of Buyers
5.3.5 Intensity of Competitive Rivalry
6 Macroeconomic Overview and Key Trends (Page No. - 40)
6.1 Introduction
6.2 Trends and Forecast of GDP
6.3 PER Capita GDP vs. PER Capita Fiberglass Roving Demand
6.4 Trends and Forecast of the Construction Industry
6.5 Trends in the Wind Energy Industry
6.6 Trends in the Automotive Industry
7 Fiberglass Roving Market, By Glass Fiber Type (Page No. - 47)
7.1 Introduction
7.2 E-glass Fiber
7.3 ECR-glass Fiber
7.4 H-glass Fiber
7.5 AR-glass
7.6 S-glass Fiber
7.7 Others
7.7.1 C-Glass
7.7.2 D-Glass
7.7.3 A-Glass
8 Fiberglass Roving Market, By Product Type (Page No. - 57)
8.1 Introduction
8.2 Single-End Roving
8.3 Multi-End Roving
8.4 Chopped Roving
9 Fiberglass Roving Market, By End-Use Industry (Page No. - 63)
9.1 Introduction
9.2 Wind Energy
9.3 Electrical & Electronics
9.4 Transportation
9.4.1 Rail
9.4.2 Automotive
9.5 Pipes & Tanks
9.6 Construction & Infrastructure
9.7 Marine
9.8 Aerospace & Defense
9.9 Others
10 Fiberglass Roving Market, By Region (Page No. - 80)
10.1 Introduction
10.2 North America
10.2.1.1 US
10.2.1.2 Canada
10.3 Europe
10.3.1.1 Germany
10.3.1.2 France
10.3.1.3 UK
10.3.1.4 Italy
10.3.1.5 Spain
10.3.1.6 Russia
10.3.1.7 Poland
10.3.1.8 Austria
10.3.1.9 Netherlands
10.3.1.10 Rest of Europe
10.4 APAC
10.4.1.1 China
10.4.1.2 Japan
10.4.1.3 India
10.4.1.4 South Korea
10.4.1.5 Malaysia
10.4.1.6 Australia & New Zealand
10.4.1.7 Rest of APAC
10.5 Middle East & Africa
10.5.1.1 South Africa
10.5.1.2 Saudi Arabia
10.5.1.3 UAE
10.6 Latin America
10.6.1.1 Brazil
10.6.1.2 Mexico
11 Competitive Landscape (Page No. - 99)
11.1 Overview
11.2 Market Share Analysis of Key Players
11.2.1 Owens Corning
11.2.2 Jushi Group
11.2.3 CPIC
11.2.4 Nippon Electric Glass
11.2.5 Johns Manville
11.3 Recent Developments
11.3.1 Investments & Expansions
11.3.2 Agreements, Partnerships, and Joint Ventures
11.3.3 New Product Launches
11.3.4 Mergers & Acquisitions
12 Company Profiles (Page No. - 104)
(Business Overview, Products Offered, Recent Developments, SWOT Analysis, MnM View)*
12.1 Owens Corning
12.2 Jushi Group Co., Ltd.
12.3 Chongqing Polycomp International Corporation
12.4 Johns Manville Corporation
12.5 Saint-Gobain S.A.
12.6 Nippon Electric Glass Co. Ltd.
12.7 Taishan Fiberglass, Inc.
12.8 AGY Holdings Corp.
12.9 China Beihai Fiberglass Co., Ltd.
12.10 Taiwan Glass Industry Corp.
*Details on Business Overview, Products Offered, Recent Developments, SWOT Analysis, MnM View Might Not Be Captured in Case of Unlisted Companies.
12.11 Other Companies
12.11.1 Binani Industries Ltd.
12.11.2 BGF Industries, Inc.
12.11.3 Nitto Boseki Co., Ltd.
12.11.4 Jiangsu Jiuding New Material Co., Ltd.
12.11.5 PFG Fiberglass Corporation
12.11.6 Celanese Corporation
12.11.7 Saertex GmbH
12.11.8 Reliance Industries
12.11.9 China National Building Material Company Ltd.
12.11.10 P-D Glasseiden GmbH
13 Appendix (Page No. - 127)
13.1 Discussion Guide
13.2 Knowledge Store: Marketsandmarkets� Subscription Portal
13.3 Available Customizations
13.4 Related Reports
13.5 Author Details
List of Tables (78 Tables)
Table 1 Global Wind Energy Installations, 2011�2016
Table 2 European Union: CO2 Emission Standards for New Passenger Cars (G/Km)
Table 3 Trends and Forecast of GDP, USD Billion (2017�2022)
Table 4 PER Capita GDP vs. PER Capita Fiberglass Roving Demand, 2016
Table 5 Trends and Forecast of the Construction Industry in North America, USD Billion (2015�2022)
Table 6 Trends and Forecast of the Construction Industry in Europe, USD Billion (2015�2022)
Table 7 Trends and Forecast of the Construction Industry in APAC, USD Billion (2015�2022)
Table 8 Trends and Forecast of the Construction Industry in Middle East & Africa, USD Billion (2015�2022)
Table 9 Trends and Forecast of the Construction Industry in Latin America, USD Billion (2015�2022)
Table 10 Wind Energy Installation, Mw (2016�2017)
Table 11 Automotive Production, Million Units (2012�2017)
Table 12 Fiberglass Roving Market Size, By Glass Fiber Type, 2016�2023 (Kiloton)
Table 13 Fiberglass Roving Market Size, By Glass Fiber Type, 2016�2023 (USD Million)
Table 14 E-glass Fiber Roving Market Size, By Region, 2016�2023 (Kiloton)
Table 15 E-glass Fiber Roving Market Size, By Region, 2016�2023 (USD Million)
Table 16 ECR-glass Fiber Roving Market Size, By Region, 2016�2023 (Kiloton)
Table 17 ECR-glass Fiber Roving Market Size, By Region, 2016�2023 (USD Million)
Table 18 H-glass Fiber Roving Market Size, By Region, 2016�2023 (Kiloton)
Table 19 H-glass Fiber Roving Market Size, By Region, 2016�2023 (USD Million)
Table 20 AR-glass Fiber Roving Market Size, By Region, 2016�2023 (Kiloton)
Table 21 AR-glass Roving Market Size, By Region,2016�2023 (USD Million)
Table 22 S-glass Fiber Roving Market Size, By Region, 2016�2023 (Kiloton)
Table 23 S-glass Fiber Roving Market Size, By Region, 2016�2023 (USD Million)
Table 24 Other Glass Fiber Roving Market Size, By Region, 2016�2023 (Kiloton)
Table 25 Other Glass Fiber Roving Market Size, By Region, 2016�2023 (USD Million)
Table 26 Fiberglass Roving Market Size, By Product Type, 2016�2023 (Kiloton)
Table 27 Fiberglass Roving Market Size, By Product Type, 2016�2023 (USD Million)
Table 28 Single�End Fiberglass Roving Market Size, By Region, 2016�2023 (Kiloton)
Table 29 Single�End Fiberglass Roving Market Size, By Region, 2016�2023 (USD Million)
Table 30 Multi-End Fiberglass Roving Market Size, By Region, 2016�2023 (Kiloton)
Table 31 Multi-End Fiberglass Roving Market Size, By Region, 2016�2023 (USD Million)
Table 32 Chopped Fiberglass Roving Market Size, By Region, 2016�2023 (Kiloton)
Table 33 Chopped Fiberglass Roving Market Size, By Region, 2016�2023 (USD Million)
Table 34 By Market Size, By End-Use Industry, 2016�2023 (Kiloton)
Table 35 By Market Size, By End-Use Industry, 2016�2023 (USD Million)
Table 36 By Market Size in Wind Energy, By Region, 2015�2022 (Kiloton)
Table 37 By Market Size in Wind Energy, By Region, 2015�2022 (USD Million)
Table 38 By Market Size in Electrical & Electronics, By Region, 2016�2023 (Kiloton)
Table 39 By Market Size in Electrical & Electronics, By Region, 2015�2022 (USD Million)
Table 40 By Market Size in Transportation, By Region, 2016�2023 (Kiloton)
Table 41 By Market Size in Transportation, By Region, 2016�2023 (USD Million)
Table 42 By Market Size in Pipes & Tanks, By Region, 2016�2023 (Kiloton)
Table 43 By Market Size in Pipes & Tanks, By Region, 2016�2023 (USD Million)
Table 44 By Market Size in Construction & Infrastructure, By Region, 2016�2023 (Kiloton)
Table 45 By Market Size in Construction & Infrastructure, By Region, 2016�2023 (USD Million)
Table 46 By Market Size in Marine, By Region, 2016�2023 (Kiloton)
Table 47 By Market Size in Marine, By Region, 2016�2023 (USD Million)
Table 48 Demand for New Airplanes, By Region, 2017�2036
Table 49 By Market Size in Aerospace & Defense, By Region, 2016�2023 (Kiloton)
Table 50 By Market Size in Aerospace & Defense, By Region, 2016�2023 (USD Million)
Table 51 By Market Size in Other End-Use Industries, By Region, 2016�2023 (Kiloton)
Table 52 By Market Size in Other End-Use Industries, By Region, 2016�2023 (USD Million)
Table 53 By Market Size, By Region, 2016�2023 (Kiloton)
Table 54 By Market Size, By Region, 2016�2023 (USD Million)
Table 55 North America: By Market Size, By End-Use Industry, 2016�2023 (Kiloton)
Table 56 North America: By Market Size, By End-Use Industry, 2016�2023 (USD Million)
Table 57 North America: By Market Size, By Country, 2016�2023 (Kiloton)
Table 58 North America: By Market Size, By Country, 2016�2023 (USD Million)
Table 59 Europe: By Market Size, By End-Use Industry, 2016�2023 (Kiloton)
Table 60 Europe: By Market Size, By End-Use Industry, 2016�2023 (USD Million)
Table 61 Europe: By Market Size, By Country, 2016�2023 (Kiloton)
Table 62 Europe: By Market Size, By Country, 2016�2023 (USD Million)
Table 63 APAC: By Market Size, By End-Use Industry, 2016�2023 (Kiloton)
Table 64 APAC: By Market Size, By End-Use Industry, 2016�2023 (USD Million)
Table 65 APAC: By Market Size, By Country, 2016�2023 (Kiloton)
Table 66 APAC: By Market Size, By Country, 2016�2023 (USD Million)
Table 67 Middle East & Africa: By Market Size, By End-Use Industry, 2016�2023 (Kiloton)
Table 68 Middle East & Africa: By Market Size, By End-Use Industry, 2016�2023 (USD Million)
Table 69 Middle East & Africa: By Market Size, By Country, 2016�2023 (Kiloton)
Table 70 Middle East & Africa: By Market Size, By Country, 2016�2023 (USD Million)
Table 71 Latin America: By Market Size, By End-Use Industry, 2016�2023 (Kiloton)
Table 72 Latin America: By Market Size, By End-Use Industry, 2016�2023 (USD Million)
Table 73 Latin America: By Market Size, By Country, 2016�2023 (Kiloton)
Table 74 Latin America: By Market Size, By Country, 2016�2023 (USD Million)
Table 75 Investments and Expansions, 2014�2018
Table 76 Agreements, Partnerships, and Joint Ventures, 2014�2018
Table 77 New Product Launches, 2014�2018
Table 78 Mergers & Acquisitions, 2014�2018
List of Figures (47 Figures)
Figure 1 Fiberglass Roving Market Segmentation
Figure 2 Fiberglass Roving Market: Research Design
Figure 3 Market Size Estimation: Bottom-Up Approach
Figure 4 Market Size Estimation: Top-Down Approach
Figure 5 Fiberglass Roving Market: Data Triangulation
Figure 6 Transportation to Be the Leading End-Use Industry of Fiberglass Roving
Figure 7 E-glass Fiber is the Largest Glass Fiber Type in Fiberglass Roving Market
Figure 8 China to Lead the Fiberglass Roving Market in APAC
Figure 9 Single-End Roving to Be the Fastest-Growing Product Type
Figure 10 APAC to Be the Fastest-Growing Fiberglass Roving Market
Figure 11 Fiberglass Roving Market to Grow at A Significant Rate
Figure 12 Single-End Roving to Be the Leading Product Type
Figure 13 APAC Accounted for the Largest Market Share
Figure 14 India to Be the Fastest-Growing Market
Figure 15 E-glass to Account for the Highest Share in Fiberglass Roving Market
Figure 16 Factors Governing the Growth of the Fiberglass Roving Market
Figure 17 Fiberglass Roving Market: Porter�s Five Forces Analysis
Figure 18 PER Capita GDP vs. PER Capita Fiberglass Roving Demand
Figure 19 Automotive Production in Key Countries, Million Units (2016 vs. 2017)
Figure 20 E-glass to Be the Largest Glass Fiber Type in the Fiberglass Roving Market
Figure 21 APAC to Be the Largest Market for E-glass Fiber Roving
Figure 22 APAC to Register the Highest Cagr in ECR-glass Fiber Roving Market
Figure 23 APAC to Register the Highest Cagr in H-glass Fiber Roving Market
Figure 24 Single-End Roving to Register the Highest Cagr
Figure 25 APAC to Register the Highest Cagr in the Single-End Roving Market
Figure 26 Wind Energy to Register the Highest Cagr in the Fiberglass Roving Market
Figure 27 APAC to Register the Highest Cagr in Fiberglass Roving Market in Wind Energy End-Use Industry
Figure 28 APAC to Be the Largest Market for Fiberglass Roving in Electrical & Electronics Industry
Figure 29 Europe to Be the Largest Market for Fiberglass Roving in Transportation Industry
Figure 30 APAC to Register the Highest Cagr in Fiberglass Roving Market in Pipes & Tanks Industry
Figure 31 APAC to Register the Highest Cagr in Fiberglass Roving Market in Construction & Infrastructure Industry
Figure 32 Europe to Register the Highest Cagr in Fiberglass Roving Market in Marine Industry
Figure 33 Europe to Register the Highest Cagr in Fiberglass Roving Market in Aerospace & Defense Industry
Figure 34 APAC to Register the Highest Cagr in Fiberglass Roving Market in Other Industries
Figure 35 China to Register the Highest Cagr in the Fiberglass Roving Market
Figure 36 North America: Fiberglass Roving Market Snapshot
Figure 37 Europe: Fiberglass Roving Market Snapshot
Figure 38 APAC: Fiberglass Roving Market Snapshot
Figure 39 New Product Launches is the Key Growth Strategies
Figure 40 Owens Corning: Company Snapshot
Figure 41 Owens Corning: SWOT Analysis
Figure 42 Jushi Group: SWOT Analysis
Figure 43 CPIC: SWOT Analysis
Figure 44 Saint-Gobain S.A.: Company Snapshot
Figure 45 Saint-Gobain S.A.: SWOT Analysis
Figure 46 Nippon Electric Glass Co. Ltd.: Company Snapshot
Figure 47 Nippon Electric Glass Co. Ltd.: SWOT Analysis


Growth opportunities and latent adjacency in Fiberglass Roving Market