Passive Authentication Market by Component (Solution and Services), Business Function (Compliance Management, Risk Management, Marketing Management), Deployment Type, Organization Size, Industry Vertical, and Region - Global Forecast to 2023


[166 Pages Report] MarketsandMarkets expects the global passive authentication market to grow from USD 440.0 Million in 2017 to USD 1,535.0 Million by 2023, at a Compound Annual Growth Rate (CAGR) of 25.5% during the forecast period. The forecast period has been considered from 2018 to 2023, while 2017 has been considered as the base year for estimating the market size.
Objectives of the Study:
The major objective of this report is to define, describe, and forecast the passive authentication market by component, business function, deployment type, organization size, industry vertical, and region. The report provides detailed information related to the key factors (drivers, restraints, opportunities, and industry-specific challenges) influencing the passive authentication market growth. The report forecasts the market size with respect to 5 major regions, namely, North America, Europe, Asia Pacific (APAC), the Middle East and Africa (MEA), and Latin America. The report profiles the key players and comprehensively analyzes their core competencies. Moreover, this report tracks and analyzes competitive developments, such as mergers and acquisitions, new product developments, and Research and Development (R&D) activities in the passive authentication market.
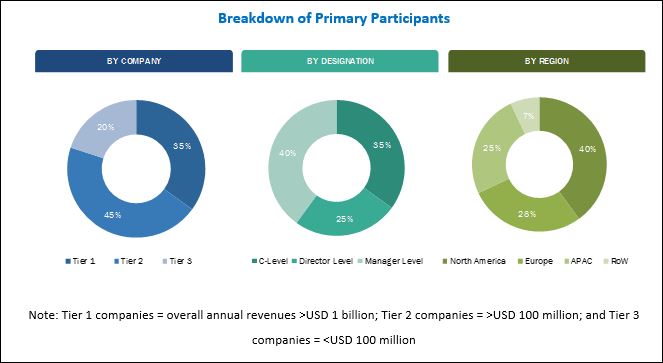
The research methodology used to estimate and forecast the market initiates with the collection and analysis of data on the key vendor product offerings and business strategies from secondary sources, such as Information Technology (IT) services providers, technology providers, press releases, investor presentations of companies; and white papers, technology journals, certified publications, and articles from recognized authors, directories, and databases. Moreover, the vendor offerings have been taken into consideration to determine the market segmentation. The bottom-up procedures were employed to arrive at the total market size of the passive authentication market from the revenue of the key market solution and services providers. Post-arrival at the overall market size, the total market was split into several segments and subsegments, which were then verified through primary research by conducting extensive interviews with the key people, such as Chief Executive Officers (CEOs), Vice Presidents (VPs), directors, and executives.
To know about the assumptions considered for the study, download the pdf brochure
Industry Ecosystem
The major solutions and services providers in the passive authentication market include Aware (US), BehavioSec (US), BioCatch (Israel), Cisco (US), Early Warning (US), Equifax (US), Experian (Ireland), FacePhi (Spain), FICO (US), Gemalto (Netherlands), IDology (US), IBM (US), Jumio(US), LexisNexis (US), NEC (Japan), Nuance Communications (US), NuData Security (Canada), Pindrop (US), RSA Security (US), SecuredTouch (Israel), Trust Stamp (US), TypingDNA (Romania), VASCO (US), Veridium (US), and Verint (US).
Key Target Audience
- Passive authentication solution providers
- Authentication services providers
- Professional services providers
- Managed services providers
- System integrators
- Cloud services providers
- Government organizations
- Resellers and distributors
- Investors and venture capitalists
- Research organizations
Scope of the Passive Authentication Market Research Report
The research report categorizes the passive authentication market to forecast revenues and analyze trends in each of the following submarkets:
By Component
- Solution
- Services
- Professional services
- Integration and implementation
- Consulting
- Support and maintenance
- Training and education
- Managed services
- Professional services
By Business Function
- Compliance management
- Marketing management
- Risk management
- Others (operations and IT management)
By Deployment Type
- On-premises
- Cloud
Passive Authentication Market By Organization Size
- Small and Medium-sized Enterprises (SMEs)
- Large enterprises
By Industry
- Banking, Financial Services, and Insurance (BFSI)
- Government
- Telecom and IT
- Retail and consumer goods
- Healthcare
- Media and entertainment
- Others (education, travel and hospitality, and automotive)
By Region
- North America
- US
- Canada
- Europe
- UK
- Germany
- France
- Rest of Europe
- MEA
- Kingdom of Saudi Arabia (KSA)
- South Africa
- United Arab Emirates (UAE)
- Rest of MEA
- APAC
- Australia and New Zealand (ANZ)
- Japan
- China
- Rest of APAC
- Latin America
- Brazil
- Mexico
- Rest of Latin America
Available Customizations
With the given market data, MarketsandMarkets offers customizations as per the company�s specific needs. The following customization options are available for the report:
Product Analysis
- Product matrix gives a detailed comparison of the product portfolio of each company
Geographic Analysis
- Further breakdown of the North American passive authentication market into countries
- Further breakdown of the European market into countries
- Further breakdown of the APAC market into countries
- Further breakdown of the MEA market into countries
- Further breakdown of the Latin American market into countries
Company Information
- Detailed analysis and profiling of the additional market players
The global passive authentication market is expected to grow from USD 492.8 Million in 2018 to USD 1,535.0 Million by 2023, at a Compound Annual Growth Rate (CAGR) of 25.5% during the forecast period. The growing demand among enterprises to deliver an enhanced user experience and the increasing need for the frictionless authentication among organizations are expected to drive the market across all regions.
The passive authentication market has been segmented by component (solution and services), business function, deployment type, organization size, industry vertical, and region. The services segment is observing great opportunities among the industry verticals, as passive authentication services help companies provide personalized services and seamless customer experience to their customers. Among the services segment, the managed services segment is expected to grow at a higher CAGR during the forecast period.
The cloud segment is expected to grow at a higher CAGR during the forecast period, due to the various benefits offered by cloud-based passive authentication solutions, such as cost-efficiency, scalability, high computing speed, and reduced expenditure on Information Technology (IT) infrastructure.
Passive authentication solutions are deployed across various industry verticals, such as Banking, Financial Services, and Insurance (BFSI), government, telecom and IT, retail and consumer goods, healthcare, media and entertainment, and others (education, travel and hospitality, and automotive). The retail and consumer goods industry vertical is expected to witness the highest CAGR during the forecast period. Passive authentication solutions enable retailers to securely authenticate their customers for protecting their financials by leveraging unique human behavioral factors while improving customer experiences. However, the BFSI industry vertical is estimated to have the largest market size in 2018, as the growing transactional volumes and the increasing need to manage digital assets are expected to be the major factors in driving the passive authentication market size of the BFSI industry vertical.
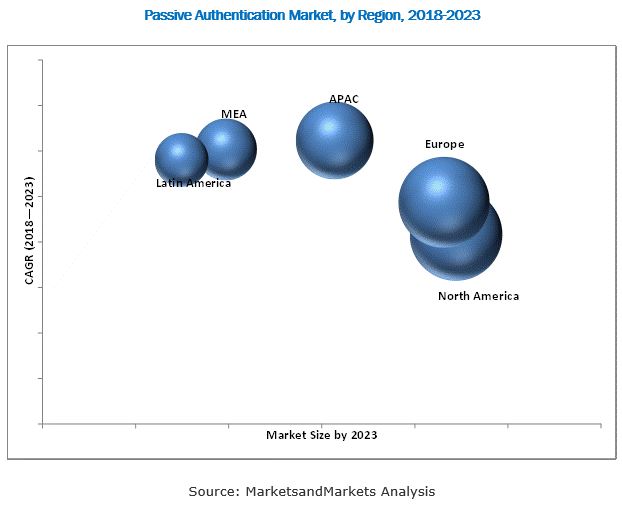
The global passive authentication market has been segmented on the basis of regions into North America, Europe, Asia Pacific (APAC), Middle East and Africa (MEA), and Latin America to provide a region-specific analysis in the report. North America is expected to be the largest revenue-generating region for passive authentication solutions and services providers in 2018. The region is an early adopter of biometrics, behavioral analytics, and mobile technology, thereby witnessing a significant growth of the passive authentication market. APAC is expected to be the fastest-growing region in the market. The growth in this region is primarily driven by the growing number of smartphone users, and the presence of the large number of Small and Medium-sized Enterprises (SMEs) in the emerging countries, such as Australia and New Zealand, China, and Japan.
The passive authentication market faces challenges, such as security concerns related to data confidentiality and slow growth in the developing and underdeveloped economies. These challenges are expected to hinder the growth of this market. The major vendors that offer passive authentication solutions and services across the globe include Aware (US), BehavioSec (US), BioCatch (Israel), Cisco (US), Early Warning (US), Equifax (US), Experian (Ireland), FacePhi (Spain), FICO (US), Gemalto (Netherlands), IDology (US), IBM (US), Jumio(US), LexisNexis (US), NEC (Japan), Nuance Communications (US), NuData Security (Canada), Pindrop (US), RSA Security (US), SecuredTouch (Israel), Trust Stamp (US), TypingDNA (Romania), VASCO (US), Veridium (US), and Verint (US). These vendors have adopted different types of organic and inorganic growth strategies, such as new product launches; partnerships, agreements, and collaborations; and mergers and acquisitions, to expand their offerings in the market.
To speak to our analyst for a discussion on the above findings, click Speak to Analyst
Table of Contents
1 Introduction (Page No. - 17)
1.1 Objectives of the Study
1.2 Market Definition
1.3 Market Scope
1.4 Years Considered for the Study
1.5 Currency
1.6 Stakeholders
2 Research Methodology (Page No. - 21)
2.1 Research Data
2.1.1 Secondary Data
2.1.2 Primary Data
2.1.2.1 Breakdown of Primaries
2.1.2.2 Key Industry Insights
2.2 Market Size Estimation
2.3 Research Assumptions
2.4 Limitations
3 Executive Summary (Page No. - 28)
4 Premium Insights (Page No. - 31)
4.1 Attractive Market Opportunities in the Passive Authentication Market
4.2 Market By Component
4.3 Market By Service
4.4 Market By Business Function
4.5 Market By Deployment Type
4.6 Market By Organization Size
4.7 Passive Authentication Market, By Industry Vertical and Region
5 Market Overview and Industry Trends (Page No. - 36)
5.1 Introduction
5.2 Market Dynamics
5.2.1 Drivers
5.2.1.1 Growing Demand Among Enterprises to Deliver Enhanced User Experience
5.2.1.2 Growing Need for Frictionless Authentication Among Organizations
5.2.2 Restraints
5.2.2.1 Privacy Concerns About Biometrics
5.2.3 Opportunities
5.2.3.1 Rapid Adoption of Iot
5.2.3.2 Increasing Adoption of AI Technology to Understand the User Behavior
5.2.3.3 Rapid Adoption of the Biometric Technology for Authentication and Fraud Detection
5.2.4 Challenges
5.2.4.1 Lack of Awareness and Professional Expertise
5.3 Industry Trends
5.3.1 Use Cases
5.3.1.1 Use Case #1
5.3.1.2 Use Case #2
6 Passive Authentication Market, By Component (Page No. - 40)
6.1 Introduction
6.2 Solution
6.3 Services
6.3.1 Professional Services
6.3.1.1 Integration and Implementation
6.3.1.2 Consulting
6.3.1.3 Support and Maintenance
6.3.1.4 Training and Education
6.3.2 Managed Services
7 Passive Authentication Market, By Business Function (Page No. - 50)
7.1 Introduction
7.2 Compliance Management
7.3 Marketing Management
7.4 Risk Management
7.5 Others
8 Passive Authentication Market, By Deployment Type (Page No. - 55)
8.1 Introduction
8.2 On-Premises
8.3 Cloud
9 Passive Authentication Market, By Organization Size (Page No. - 59)
9.1 Introduction
9.2 Small and Medium-Sized Enterprises
9.3 Large Enterprises
10 Passive Authentication Market, By Industry Vertical (Page No. - 63)
10.1 Introduction
10.2 Banking, Financial Services, and Insurance
10.3 Government
10.4 Telecom and IT
10.5 Retail and Consumer Goods
10.6 Healthcare
10.7 Media and Entertainment
10.8 Others
11 Passive Authentication Market, By Region (Page No. - 72)
11.1 Introduction
11.2 North America
11.2.1 United States
11.2.2 Canada
11.3 Europe
11.3.1 United Kingdom
11.3.2 Germany
11.3.3 France
11.3.4 Rest of Europe
11.4 Asia Pacific
11.4.1 Australia and New Zealand
11.4.2 Japan
11.4.3 China
11.4.4 Rest of Asia Pacific
11.5 Middle East and Africa
11.5.1 Kingdom of Saudi Arabia
11.5.2 United Arab Emirates
11.5.3 South Africa
11.5.4 Rest of Middle East and Africa
11.6 Latin America
11.6.1 Brazil
11.6.2 Mexico
11.6.3 Rest of Latin America
12 Competitive Landscape (Page No. - 96)
12.1 Overview
12.2 Competitive Scenario
12.2.1 New Product/Service Launches and Upgradations
12.2.2 Acquisitions
12.2.3 Business Expansions
12.2.4 Partnerships, Agreements, and Collaborations
13 Company Profiles (Page No. - 101)
13.1 Introduction
(Business Overview, Products & Services, Key Insights, Recent Developments, SWOT Analysis, MnM View)*
13.2 NEC
13.3 IBM
13.4 Cisco
13.5 Gemalto
13.6 Fico
13.7 RSA Security
13.8 Experian
13.9 Equifax
13.10 Vasco Data Security International
13.11 Nuance Communications
13.12 Biocatch
13.13 Behaviosec
13.14 Pindrop
13.15 Idology
13.16 Lexisnexis
13.17 Veridium
13.18 Verint
13.19 Jumio
13.20 Early Warning Services
13.21 Aware
13.22 Nudata Security
13.23 Securedtouch
13.24 Typingdna
13.25 Facephi
13.26 Trust Stamp
*Details on Business Overview, Products & Services, Key Insights, Recent Developments, SWOT Analysis, MnM View Might Not Be Captured in Case of Unlisted Companies.
14 Appendix (Page No. - 160)
14.1 Discussion Guide
14.2 Knowledge Store: Marketsandmarkets� Subscription Portal
14.3 Introduction RT: Real-Time Market Intelligence
14.4 Available Customizations
14.5 Related Reports
14.6 Author Details
List of Tables (75 Tables)
Table 1 Passive Authentication Market Size, By Component, 2016�2023 (USD Million)
Table 2 Solution: Market Size, By Region, 2016�2023 (USD Million)
Table 3 Services: Market Size, By Type, 2016�2023 (USD Million)
Table 4 Services: Market Size, By Region, 2016�2023 (USD Million)
Table 5 Professional Services Market Size, By Type, 2016�2023 (USD Million)
Table 6 Professional Services Market Size, By Region, 2016�2023 (USD Million)
Table 7 Integration and Implementation Market Size, By Region, 2016�2023 (USD Million)
Table 8 Consulting Market Size, By Region, 2016�2023 (USD Million)
Table 9 Support and Maintenance Market Size, By Region, 2016�2023 (USD Million)
Table 10 Training and Education Market Size, By Region, 2016�2023 (USD Million)
Table 11 Managed Services: Passive Authentication Market Size, By Region 2016�2023 (USD Million)
Table 12 Market Size, By Business Function, 2016�2023 (USD Million)
Table 13 Compliance Management: Market Size, By Region, 2016�2023 (USD Million)
Table 14 Marketing Management: Market Size, By Region, 2016�2023 (USD Million)
Table 15 Risk Management: Market Size, By Region, 2016�2023 (USD Million)
Table 16 Others: Market Size, By Region, 2016�2023 (USD Million)
Table 17 Passive Authentication Market Size, By Deployment Type, 2016�2023 (USD Million)
Table 18 On-Premises: Market Size, By Region, 2016�2023 (USD Million)
Table 19 Cloud: Market Size, By Region, 2016�2023 (USD Million)
Table 20 Market Size, By Organization Size, 2016�2023 (USD Million)
Table 21 Small and Medium-Sized Enterprises: Market Size, By Region, 2016�2023 (USD Million)
Table 22 Large Enterprises: Market Size, By Region, 2016�2023 (USD Million)
Table 23 Market Size, By Industry Vertical, 2016�2023 (USD Million)
Table 24 Banking, Financial Services, and Insurance: Market Size, By Region, 2016�2023 (USD Million)
Table 25 Government: Passive Authentication Market Size, By Region, 2016�2023 (USD Million)
Table 26 Telecom and IT: Market Size, By Region, 2016�2023 (USD Million)
Table 27 Retail and Consumer Goods: Market Size, By Region, 2016�2023 (USD Million)
Table 28 Healthcare: Market Size, By Region, 2016�2023 (USD Million)
Table 29 Media and Entertainment: Market Size, By Region, 2016�2023 (USD Million)
Table 30 Others: Market Size, By Region, 2016�2023 (USD Million)
Table 31 Market Size, By Region, 2016�2023 (USD Million)
Table 32 North America: Passive Authentication Market Size, By Country, 2016�2023 (USD Million)
Table 33 North America: Market Size, By Component, 2016�2023 (USD Million)
Table 34 North America: Market Size, By Service, 2016�2023 (USD Million)
Table 35 North America: Market Size, By Professional Service, 2016�2023 (USD Million)
Table 36 North America: Market Size, By Business Function, 2016�2023 (USD Million)
Table 37 North America: Market Size, By Deployment Type, 2016�2023 (USD Million)
Table 38 North America: Market Size, By Organization Size, 2016�2023 (USD Million)
Table 39 North America: uthentication Market Size, By Industry Vertical, 2016�2023 (USD Million)
Table 40 Europe: Passive Authentication Market Size, By Country, 2016�2023 (USD Million)
Table 41 Europe: Market Size, By Component, 2016�2023 (USD Million)
Table 42 Europe: Market Size, By Service, 2016�2023 (USD Million)
Table 43 Europe: Market Size, By Professional Service, 2016�2023 (USD Million)
Table 44 Europe: Market Size, By Business Function, 2016�2023 (USD Million)
Table 45 Europe: Market Size, By Deployment Type, 2016�2023 (USD Million)
Table 46 Europe: Market Size, By Organization Size, 2016�2023 (USD Million)
Table 47 Europe: Market Size, By Industry Vertical, 2016�2023 (USD Million)
Table 48 Asia Pacific: Passive Authentication Market Size, By Country, 2016�2023 (USD Million)
Table 49 Asia Pacific: Market Size, By Component, 2016�2023 (USD Million)
Table 50 Asia Pacific: Market Size, By Service, 2016�2023 (USD Million)
Table 51 Asia Pacific: Market Size, By Professional Service, 2016�2023 (USD Million)
Table 52 Asia Pacific: Market Size, By Business Function, 2016�2023 (USD Million)
Table 53 Asia Pacific: Market Size, By Deployment Type, 2016�2023 (USD Million)
Table 54 Asia Pacific: Market Size, By Organization Size, 2016�2023 (USD Million)
Table 55 Asia Pacific: Market Size, By Industry Vertical, 2016�2023 (USD Million)
Table 56 Middle East and Africa: Passive Authentication Market Size, By Country, 2016�2023 (USD Million)
Table 57 Middle East and Africa: Market Size, By Component, 2016�2023 (USD Million)
Table 58 Middle East and Africa: Market Size, By Service, 2016�2023 (USD Million)
Table 59 Middle East and Africa: Market Size, By Professional Service, 2016�2023 (USD Million)
Table 60 Middle East and Africa: Market Size, By Business Function, 2016�2023 (USD Million)
Table 61 Middle East and Africa: Market Size, By Deployment Type, 2016�2023 (USD Million)
Table 62 Middle East and Africa: Market Size, By Organization Size, 2016�2023 (USD Million)
Table 63 Middle East and Africa: Market Size, By Industry Vertical, 2016�2023 (USD Million)
Table 64 Latin America: Passive Authentication Market Size, By Country, 2016�2023 (USD Million)
Table 65 Latin America: Market Size, By Component, 2016�2023 (USD Million)
Table 66 Latin America: Market Size, By Service, 2016�2023 (USD Million)
Table 67 Latin America: Market Size, By Professional Service, 2016�2023 (USD Million)
Table 68 Latin America: Market Size, By Business Function, 2016�2023 (USD Million)
Table 69 Latin America: Market Size, By Deployment Type, 2016�2023 (USD Million)
Table 70 Latin America: Market Size, By Organization Size, 2016�2023 (USD Million)
Table 71 Latin America: Market Size, By Industry Vertical, 2016�2023 (USD Million)
Table 72 New Product/Service Launches and Upgradations, 2017�2018
Table 73 Acquisitions, 2017�2018
Table 74 Business Expansions, 2017�2018
Table 75 Partnerships, Agreements, and Collaborations, 2017�2018
List of Figures (48 Figures)
Figure 1 Passive Authentication Market: Market Segmentation
Figure 2 Regional Scope
Figure 3 Market: Research Design
Figure 4 Breakdown of Primary Interviews: By Company, Designation, and Region
Figure 5 Data Triangulation
Figure 6 Market Size Estimation Methodology: Bottom-Up Approach
Figure 7 Market Size Estimation Methodology: Top-Down Approach
Figure 8 Market: Assumptions
Figure 9 Top 3 Segments With the Largest Market Shares in 2018
Figure 10 Market: Regional Snapshot
Figure 11 The Growing Need for Enhanced Customer Experience and Frictionless Authentication are Expected to Drive the Growth of the Passive Authentication Market
Figure 12 Services Segment is Expected to Grow at A Higher CAGR During the Forecast Period
Figure 13 Managed Services Segment is Expected to Grow at A Higher CAGR During the Forecast Period
Figure 14 Risk Management Segment is Expected to Grow at the Highest CAGR During the Forecast Period
Figure 15 Cloud Deployment Type is Expected to Grow at A Higher CAGR During the Forecast Period
Figure 16 Small and Medium-Sized Enterprises Segment is Expected to Grow at A Higher CAGR During the Forecast Period
Figure 17 Banking, Financial Services, and Insurance Industry Vertical, and North American Region are Estimated to Dominate the Market in 2018
Figure 18 Passive Authentication Market: Drivers, Restraints, Opportunities, and Challenges
Figure 19 Services Segment is Expected to Grow at A Higher CAGR During the Forecast Period
Figure 20 Managed Services Segment is Expected to Have A Higher CAGR During the Forecast Period
Figure 21 Integration and Implementation Segment is Expected to Have the Highest CAGR During the Forecast Period
Figure 22 Risk Management Segment is Expected to Grow at the Highest CAGR During the Forecast Period
Figure 23 Cloud Deployment Type is Expected to Grow at A Higher CAGR During the Forecast Period
Figure 24 Small and Medium-Sized Enterprises Segment is Expected to Grow at A Higher CAGR During the Forecast Period
Figure 25 Retail and Consumer Goods Industry Vertical is Expected to Grow at the Highest CAGR During the Forecast Period
Figure 26 Asia Pacific is Expected to Grow at the Highest CAGR During the Forecast Period
Figure 27 North America: Market Snapshot
Figure 28 Asia Pacific: Market Snapshot
Figure 29 Key Developments By the Leading Players in the Passive Authentication Market, 2016�2018
Figure 30 Market Evaluation Framework
Figure 31 Geographic Revenue Mix of Top Market Players
Figure 32 NEC: Company Snapshot
Figure 33 NEC: SWOT Analysis
Figure 34 IBM: Company Snapshot
Figure 35 IBM: SWOT Analysis
Figure 36 Cisco: Company Snapshot
Figure 37 Gemalto: Company Snapshot
Figure 38 Gemalto: SWOT Analysis
Figure 39 Fico: Company Snapshot
Figure 40 Fico: SWOT Analysis
Figure 41 RSA Security: SWOT Analysis
Figure 42 Experian: Company Snapshot
Figure 43 Equifax: Company Snapshot
Figure 44 Vasco Data Security International: Company Snapshot
Figure 45 Nuance Communications: Company Snapshot
Figure 46 Verint: Company Snapshot
Figure 47 Aware: Company Snapshot
Figure 48 Facephi: Company Snapshot


Growth opportunities and latent adjacency in Passive Authentication Market