
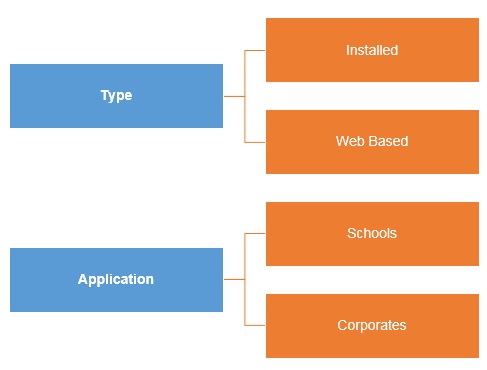
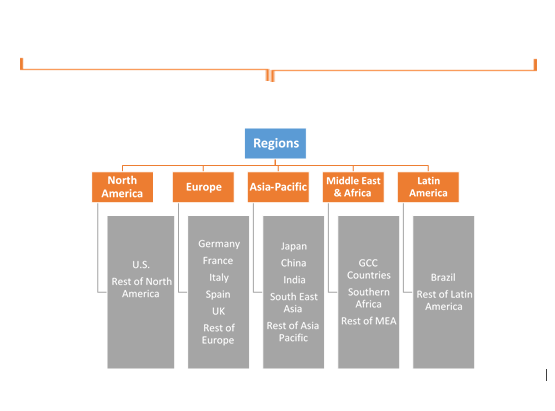
360 Degree Feedback Software Market by Type (Installed, Web Based); by Application (Schools, Corporates); by Regional Outlook (U.S., Rest of North America, France, UK, Germany, Spain, Italy, Rest of Europe, China, Japan, India, Southeast Asia, Rest of Asia Pacific, GCC Countries, Southern Africa, Rest of MEA, Brazil, Rest of Latin America) – Global Insights, Growth, Size, Comparative Analysis, Trends and Forecast, 2018 – 2026
Industry Trends
360-degree feedback, is a process in which someone’s performance is assessed and feedback is given by a number of people who may include their manager, subordinates, colleagues and customers. In software, assessments take the form of ratings against various performance dimensions. The term ‘360-degree feedback’ is sometimes used to describe upward feedback where this is given by subordinates to their managers. This is the most common approach and is more properly described as 180-degree feedback. Feedback may be presented direct to individuals, or to their managers, or both. Expert counselling and coaching for individuals as a result of the feedback may be provided by a member of the HR department or an outside consultant. Increased adoption of continuous performance reviews by leading organizations is propelling the market.
The 360 Degree Feedback Software Market was valued at US$ 6779.41 Mn in 2017 and is expected to reach US$ 16,780.43 Mn by 2022.
Global 360 Degree Feedback Software Market, By Type, 2018 - 2026 (US$ Million)
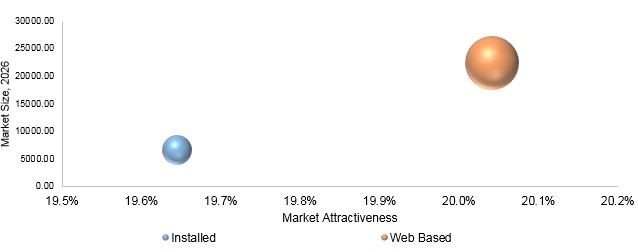
Global 360 Degree Feedback Software Market, By Type
On the basis of type, web based occupied the largest market share in 2017. In web-based software, the data can be stored online with the help of cloud storage. Questionnaires can be designed as per the need of the human resource department in web based 360 degree feedback software and the same can be uploaded on cloud. Web-based surveys maintains confidentiality of their answers. Additionally, data entry is eliminated, analysis is more sophisticated, and organizations can look at overall trends, which is majorly driving the web-based type market.
Global 360 Degree Feedback Software Market, By Region
On the basis of geography, North American market, represented the largest market share in 2017. The region has presence of maximum players, which is driving the 360 degree feedback software market. The region has low power distance index. Power distance index (PDI) is the difference between the extent, a boss and subordinate can determine each other’s behavior in work environment. In practice low power distance leads to flat organizations, fewer supervisors, subordinates who are not afraid to disagree with managers and expect their bosses to consult important decisions and delegate important work. In 360 degree feedback system, employees receive anonymous feedback from people working along with them including subordinates. The low PDI index supports the implementation of 360 degree feedback software. As a result, there is higher acceptance of feedback software market in North America.
Competitive Landscape
The report provides both, qualitative and quantitative research of the market, as well as provides accurate insights into the rational scenario and favored development methods adopted by the key contenders. The 360 degree feedback software market report also offers extensive research on the key players in this market and detailed insights on the competitiveness of these players. The key business strategies such as Mergers & Acquisitions (M&A), affiliations, collaborations, and contracts adopted by the major players are also recognized and analyzed in the report. For each company, the report recognizes their corporate headquarter, competitors, product/service type, application and specification, pricing, and gross margin.
Some of the primary participants of Global 360 Degree Feedback Software Market are IBM, Cornerstone OnDemand, Qualtrics, Salesforce Work.com, TalentGuard, SumTotal Systems
SutiSoft, SVI, Aiday, Bowland Software, GroSum, Impraise, LeaderNation, Performly, Raw Media Group, Spidergap amongst others. In April 2017, TalentGuard Inc. collaborated with WWT, a United States based technology service provider. This partnership helps TalentGuard Inc. to broaden its talent management offerings in Latin America. Talent management is critically important to companies operating in Latin America because of high competition, turnover and cultural norms that are ingrained into the workforce operations. TalentGuard’s new user interface, code named Bella, makes it much easier to interact with the application and users benefit from a more intuitive and visually engaging employee experience.

Global 360 Degree Feedback Software Industry Background
1. Introduction
1.1. Market Scope
1.2. Market Segmentation
1.3. Methodology
1.4. Assumptions
2. 360 Degree Feedback Software Market Snapshot
3. Executive Summary: 360 Degree Feedback Software Market
4. Qualitative Analysis: 360 Degree Feedback Software Market
4.1. Introduction
4.1.1. Product Definition
4.1.2. Industry Development
4.2. Market Dynamics
4.2.1. Drivers
4.2.2. Restraints
4.2.3. Opportunities
4.3. Trends in Market
5. Global 360 Degree Feedback Software Market Analysis and
Forecasts, 2018 – 2026
5.1. Overview
5.1.1. Global Market Revenue (US$ Mn) and Forecasts
5.2. Global 360 Degree Feedback Software Market Revenue (US$ Mn)
and Forecasts, By Type
5.2.1. Installed
5.2.1.1. Definition
5.2.1.2. Market Penetration
5.2.1.3. Market Revenue Expected to Increase by 2026
5.2.1.4. Compound Annual Growth Rate (CAGR)
5.2.2. Web Based
5.2.2.1. Definition
5.2.2.2. Market Penetration
5.2.2.3. Market Revenue Expected to Increase by 2026
5.2.2.4. Compound Annual Growth Rate (CAGR)
5.3. Key Segment for Channeling Investments
5.3.1. By Type
6. Global 360 Degree Feedback Software Market Analysis and
Forecasts, 2018 – 2026
6.1. Overview
6.2. Global 360 Degree Feedback Software Market Revenue (US$ Mn)
and Forecasts, By Application
6.2.1. Schools
6.2.1.1. Definition
6.2.1.2. Market Penetration
6.2.1.3. Market Revenue Expected to Increase by 2026
6.2.1.4. Compound Annual Growth Rate (CAGR)
6.2.2. Corporates
6.2.2.1. Definition
6.2.2.2. Market Penetration
6.2.2.3. Market Revenue Expected to Increase by 2026
6.2.2.4. Compound Annual Growth Rate (CAGR)
6.3. Key Segment for Channeling Investments
6.3.1. By Application
7. North America 360 Degree Feedback Software Market Analysis
and Forecasts, 2018 – 2026
7.1. Overview
7.1.1. North America Market Revenue (US$ Mn)
7.2. North America 360 Degree Feedback Software Market Revenue (US$
Mn) and Forecasts, By Type
7.2.1. Installed
7.2.2. Web Based
7.3. North America Market Revenue (US$ Mn) and Forecasts, By
Application
7.3.1. Schools
7.3.2. Corporates
7.4. North America Market Revenue (US$ Mn) and Forecasts, By
Country
7.4.1. U.S.
7.4.1.1. U.S. 360 Degree Feedback Software Market Revenue (US$ Mn) and
Forecasts, By Type
7.4.1.1.1. Installed
7.4.1.1.2. Web Based
7.4.1.2. U.S. Market Revenue (US$ Mn) and Forecasts, By Application
7.4.1.2.1. Schools
7.4.1.2.2. Corporates
7.4.2. Rest of North America
7.4.2.1. Rest of North America Market Revenue (US$ Mn) and Forecasts,
By Type
7.4.2.1.1. Installed
7.4.2.1.2. Web Based
7.4.2.2. Rest of North America 360 Degree Feedback Software Market
Revenue (US$ Mn) and Forecasts, By Application
7.4.2.2.1. Schools
7.4.2.2.2. Corporates
7.5. Key Segment for Channeling Investments
7.5.1. By Country
7.5.2. By Type
7.5.3. By Application
8. Europe 360 Degree Feedback Software Market Analysis and
Forecasts, 2018 – 2026
8.1. Overview
8.1.1. Europe Market Revenue (US$ Mn)
8.2. Europe Market Revenue (US$ Mn) and Forecasts, By Type
8.2.1. Installed
8.2.2. Web Based
8.3. Europe Market Revenue (US$ Mn) and Forecasts, By Application
8.3.1. Schools
8.3.2. Corporates
8.4. Europe Market Revenue (US$ Mn) and Forecasts, By Country
8.4.1. France
8.4.1.1. France 360 Degree Feedback Software Market Revenue (US$ Mn)
and Forecasts, By Type
8.4.1.1.1. Installed
8.4.1.1.2. Web Based
8.4.1.2. France Market Revenue (US$ Mn) and Forecasts, By Application
8.4.1.2.1. Schools
8.4.1.2.2. Corporates
8.4.2. The UK
8.4.2.1. The UK Market Revenue (US$ Mn) and Forecasts, By Type
8.4.2.1.1. Installed
8.4.2.1.2. Web Based
8.4.2.2. The UK 360 Degree Feedback Software Market Revenue (US$ Mn)
and Forecasts, By Application
8.4.2.2.1. Schools
8.4.2.2.2. Corporates
8.4.3. Spain
8.4.3.1. Spain Market Revenue (US$ Mn) and Forecasts, By Type
8.4.3.1.1. Installed
8.4.3.1.2. Web Based
8.4.3.2. Spain Market Revenue (US$ Mn) and Forecasts, By Application
8.4.3.2.1. Schools
8.4.3.2.2. Corporates
8.4.4. Germany
8.4.4.1. Germany 360 Degree Feedback Software Market Revenue (US$ Mn)
and Forecasts, By Type
8.4.4.1.1. Installed
8.4.4.1.2. Web Based
8.4.4.2. Germany Market Revenue (US$ Mn) and Forecasts, By Application
8.4.4.2.1. Schools
8.4.4.2.2. Corporates
8.4.5. Italy
8.4.5.1. Italy 360 Degree Feedback Software Market Revenue (US$ Mn) and
Forecasts, By Type
8.4.5.1.1. Installed
8.4.5.1.2. Web Based
8.4.5.2. Italy Market Revenue (US$ Mn) and Forecasts, By Application
8.4.5.2.1. Schools
8.4.5.2.2. Corporates
8.4.6. Rest of Europe
8.4.6.1. Rest of Europe 360 Degree Feedback Software Market Revenue
(US$ Mn) and Forecasts, By Type
8.4.6.1.1. Installed
8.4.6.1.2. Web Based
8.4.6.2. Rest of Europe Market Revenue (US$ Mn) and Forecasts, By
Application
8.4.6.2.1. Schools
8.4.6.2.2. Corporates
8.5. Key Segment for Channeling Investments
8.5.1. By Country
8.5.2. By Type
8.5.3. By Application
9. Asia Pacific 360 Degree Feedback Software Market Analysis and
Forecasts, 2018 – 2026
9.1. Overview
9.1.1. Asia Pacific Market Revenue (US$ Mn)
9.2. Asia Pacific Market Revenue (US$ Mn) and Forecasts, By Type
9.2.1. Installed
9.2.2. Web Based
9.3. Asia Pacific Market Revenue (US$ Mn) and Forecasts, By
Application
9.3.1. Schools
9.3.2. Corporates
9.4. Asia Pacific Market
Revenue (US$ Mn) and Forecasts, By Country
9.4.1. China
9.4.1.1. China 360 Degree Feedback Software Market Revenue (US$ Mn) and
Forecasts, By Type
9.4.1.1.1. Installed
9.4.1.1.2. Web Based
9.4.1.2. China Market Revenue (US$ Mn) and Forecasts, By Application
9.4.1.2.1. Schools
9.4.1.2.2. Corporates
9.4.2. Japan
9.4.2.1. Japan 360 Degree Feedback Software Market Revenue (US$ Mn) and
Forecasts, By Type
9.4.2.1.1. Installed
9.4.2.1.2. Web Based
9.4.2.2. Japan Market Revenue (US$ Mn) and Forecasts, By Application
9.4.2.2.1. Schools
9.4.2.2.2. Corporates
9.4.3. India
9.4.3.1. India 360 Degree Feedback Software Market Revenue (US$ Mn) and
Forecasts, By Type
9.4.3.1.1. Installed
9.4.3.1.2. Web Based
9.4.3.2. India 360 Degree Feedback Software Market Revenue (US$ Mn) and
Forecasts, By Application
9.4.3.2.1. Schools
9.4.3.2.2. Corporates
9.4.4. Southeast Asia
9.4.4.1. Southeast Asia 360 Degree Feedback Software Market Revenue
(US$ Mn) and Forecasts, By Type
9.4.4.1.1. Installed
9.4.4.1.2. Web Based
9.4.4.2. Southeast Asia 360 Degree Feedback Software Market Revenue
(US$ Mn) and Forecasts, By Application
9.4.4.2.1. Schools
9.4.4.2.2. Corporates
9.4.5. Rest of Asia Pacific
9.4.5.1. Rest of Asia Pacific 360 Degree Feedback Software Market
Revenue (US$ Mn) and Forecasts, By Type
9.4.5.1.1. Installed
9.4.5.1.2. Web Based
9.4.5.2. Rest of Asia Pacific 360 Degree Feedback Software Market
Revenue (US$ Mn) and Forecasts, By Application
9.4.5.2.1. Schools
9.4.5.2.2. Corporates
9.5. Key Segment for Channeling Investments
9.5.1. By Country
9.5.2. By Type
9.5.3. By Application
10. Middle East and Africa 360 Degree Feedback Software Market
Analysis and Forecasts, 2018 – 2026
10.1. Overview
10.1.1. Middle East and Africa Market Revenue (US$ Mn)
10.2. Middle East and Africa Market Revenue (US$ Mn) and Forecasts,
By Type
10.2.1. Installed
10.2.2. Web Based
10.3. Middle East and Africa Market Revenue (US$ Mn) and Forecasts,
By Application
10.3.1. Schools
10.3.2. Corporates
10.4. Middle East and Africa Market Revenue (US$ Mn) and Forecasts,
By Country
10.4.1. GCC Countries
10.4.1.1. GCC Countries 360 Degree Feedback Software Market Revenue (US$
Mn) and Forecasts, By Type
10.4.1.1.1. Installed
10.4.1.1.2. Web Based
10.4.1.2. GCC Countries Software Market Revenue (US$ Mn) and Forecasts,
By Application
10.4.1.2.1. Schools
10.4.1.2.2. Corporates
10.4.2. Southern Africa
10.4.2.1. Southern Africa Market Revenue (US$ Mn) and Forecasts, By Type
10.4.2.1.1. Installed
10.4.2.1.2. Web Based
10.4.2.2. Southern Africa Market Revenue (US$ Mn) and Forecasts, By
Application
10.4.2.2.1. Schools
10.4.2.2.2. Corporates
10.4.3. Rest of MEA
10.4.3.1. Rest of MEA 360 Degree Feedback Software Market Revenue (US$
Mn) and Forecasts, By Type
10.4.3.1.1. Installed
10.4.3.1.2. Web Based
10.4.3.2. Rest of MEA Market Revenue (US$ Mn) and Forecasts, By
Application
10.4.3.2.1. Schools
10.4.3.2.2. Corporates
10.5. Key Segment for Channeling Investments
10.5.1. By Country
10.5.2. By Type
10.5.3. By Application
11. Latin America 360 Degree Feedback Software Market Analysis
and Forecasts, 2018 – 2026
11.1. Overview
11.1.1. Latin America Market Revenue (US$ Mn)
11.2. Latin America Market Revenue (US$ Mn) and Forecasts, By Type
11.2.1. Installed
11.2.2. Web Based
11.3. Latin America Market Revenue (US$ Mn) and Forecasts, By
Application
11.3.1. Schools
11.3.2. Corporates
11.4. Latin America 360 Degree Feedback Software Market Revenue (US$
Mn) and Forecasts, By Country
11.4.1. Brazil
11.4.1.1. Brazil Market Revenue (US$ Mn) and Forecasts, By Type
11.4.1.1.1. Installed
11.4.1.1.2. Web Based
11.4.1.2. Brazil Market Revenue (US$ Mn) and Forecasts, By Application
11.4.1.2.1. Schools
11.4.1.2.2. Corporates
11.4.2. Rest of Latin America
11.4.2.1. Rest of Latin America 360 Degree Feedback Software Market
Revenue (US$ Mn) and Forecasts, By Type
11.4.2.1.1. Installed
11.4.2.1.2. Web Based
11.4.2.2. Rest of Latin America Market Revenue (US$ Mn) and Forecasts,
By Application
11.4.2.2.1. Schools
11.4.2.2.2. Corporates
11.5. Key Segment for Channeling Investments
11.5.1. By Country
11.5.2. By Type
11.5.3. By Application
12. Competitive Benchmarking
12.1. Player Positioning Analysis
12.2. Global Presence and Growth Strategies
13. Player Profiles
13.1. Aiday
13.1.1. Company Details
13.1.2. Company Overview
13.1.3. Product Offerings
13.1.4. Key Developments
13.1.5. Financial Analysis
13.1.6. SWOT Analysis
13.1.7. Business Strategies
13.2. Bowland Software
13.2.1. Company Details
13.2.2. Company Overview
13.2.3. Product Offerings
13.2.4. Key Developments
13.2.5. Financial Analysis
13.2.6. SWOT Analysis
13.2.7. Business Strategies
13.3. Cornerstone OnDemand
13.3.1. Company Details
13.3.2. Company Overview
13.3.3. Product Offerings
13.3.4. Key Developments
13.3.5. Financial Analysis
13.3.6. SWOT Analysis
13.3.7. Business Strategies
13.4. GroSum
13.4.1. Company Details
13.4.2. Company Overview
13.4.3. Product Offerings
13.4.4. Key Developments
13.4.5. Financial Analysis
13.4.6. SWOT Analysis
13.4.7. Business Strategies
13.5. IBM
13.5.1. Company Details
13.5.2. Company Overview
13.5.3. Product Offerings
13.5.4. Key Developments
13.5.5. Financial Analysis
13.5.6. SWOT Analysis
13.5.7. Business Strategies
13.6. Impraise
13.6.1. Company Details
13.6.2. Company Overview
13.6.3. Product Offerings
13.6.4. Key Developments
13.6.5. Financial Analysis
13.6.6. SWOT Analysis
13.6.7. Business Strategies
13.7. LeaderNation
13.7.1. Company Details
13.7.2. Company Overview
13.7.3. Product Offerings
13.7.4. Key Developments
13.7.5. Financial Analysis
13.7.6. SWOT Analysis
13.7.7. Business Strategies
13.8. Performly
13.8.1. Company Details
13.8.2. Company Overview
13.8.3. Product Offerings
13.8.4. Key Developments
13.8.5. Financial Analysis
13.8.6. SWOT Analysis
13.8.7. Business Strategies
13.9. Qualtrics
13.9.1. Company Details
13.9.2. Company Overview
13.9.3. Product Offerings
13.9.4. Key Developments
13.9.5. Financial Analysis
13.9.6. SWOT Analysis
13.9.7. Business Strategies
13.10. Raw Media Group
13.10.1.
Company Details
13.10.2.
Company Overview
13.10.3.
Product Offerings
13.10.4.
Key Developments
13.10.5.
Financial Analysis
13.10.6.
SWOT Analysis
13.10.7.
Business Strategies
13.11. Salesforce Work.com
13.11.1.
Company Details
13.11.2.
Company Overview
13.11.3.
Product Offerings
13.11.4.
Key Developments
13.11.5.
Financial Analysis
13.11.6.
SWOT Analysis
13.11.7.
Business Strategies
13.12. Spidergap
13.12.1.
Company Details
13.12.2.
Company Overview
13.12.3.
Product Offerings
13.12.4.
Key Developments
13.12.5.
Financial Analysis
13.12.6.
SWOT Analysis
13.12.7.
Business Strategies
13.13. SumTotal Systems
13.13.1.
Company Details
13.13.2.
Company Overview
13.13.3.
Product Offerings
13.13.4.
Key Developments
13.13.5.
Financial Analysis
13.13.6.
SWOT Analysis
13.13.7.
Business Strategies
13.14. SutiSoft
13.14.1.
Company Details
13.14.2.
Company Overview
13.14.3.
Product Offerings
13.14.4.
Key Developments
13.14.5.
Financial Analysis
13.14.6.
SWOT Analysis
13.14.7.
Business Strategies
13.15. SVI
13.15.1.
Company Details
13.15.2.
Company Overview
13.15.3.
Product Offerings
13.15.4.
Key Developments
13.15.5.
Financial Analysis
13.15.6.
SWOT Analysis
13.15.7.
Business Strategies
13.16. Talent Guard
13.16.1. Company Details
13.16.2. Company Overview
13.16.3. Product Offerings
13.16.4. Key Developments
13.16.5. Financial Analysis
13.16.6. SWOT Analysis
13.16.7. Business Strategies
Note: This ToC is
tentative and can be changed according to the research study conducted during
the course of report completion.
At Absolute Markets Insights, we are engaged in building both global as well as country specific reports. As a result, the approach taken for deriving the estimation and forecast for a specific country is a bit unique and different in comparison to the global research studies. In this case, we not only study the concerned market factors & trends prevailing in a particular country (from secondary research) but we also tend to calculate the actual market size & forecast from the revenue generated from the market participants involved in manufacturing or distributing the any concerned product. These companies can also be service providers. For analyzing any country specifically, we do consider the growth factors prevailing under the states/cities/county for the same. For instance, if we are analyzing an industry specific to United States, we primarily need to study about the states present under the same(where the product/service has the highest growth). Similar analysis will be followed by other countries. Our scope of the report changes with different markets.
Our research study is mainly implement through a mix of both secondary and primary research. Various sources such as industry magazines, trade journals, and government websites and trade associations are reviewed for gathering precise data. Primary interviews are conducted to validate the market size derived from secondary research. Industry experts, major manufacturers and distributors are contacted for further validation purpose on the current market penetration and growth trends.
Prominent participants in our primary research process include:
- Key Opinion Leaders namely the CEOs, CSOs, VPs, purchasing managers, amongst others
- Research and development participants, distributors/suppliers and subject matter experts
Secondary Research includes data extracted from paid data sources:
- Reuters
- Factiva
- Bloomberg
- One Source
- Hoovers
Research Methodology

Key Inclusions


