Automotive Pressure Sensors Market by Application (ABS, Airbag, TPMS, Engine, HVAC, & Transmission), Technology (MEMS, Strain Gauge, & Ceramic), Transduction (Piezoresistive, Capacitive, Optical, Resonant), Vehicle, EV, & Region - Global Forecast to 2025


The automotive pressure sensors market was valued at USD 3.68 Billion in 2016 and is estimated to grow at a CAGR of 9.70% during the forecast period, to reach USD 8.84 Billion by 2025. In this study, 2016 has been considered the base year, and 2017 to 2025 the forecast period, for estimating the market size of the market. The market report analyzes and forecasts the market size, in terms of volume (million units) and value (USD million), for passenger cars and commercial vehicles. It also forecasts the market size, in terms of volume (thousand units) and value (USD thousand), for electric vehicles. The report segments the market and forecasts its size, by volume and value, based on application type, vehicle type, electric vehicle type, transduction type, technology, and region. The report provides a detailed analysis of various forces acting in the market including drivers, restraints, opportunities, and challenges. It strategically profiles key players and comprehensively analyzes their market shares and core competencies. It also tracks and analyzes competitive developments such as joint ventures, mergers & acquisitions, new product launches, expansions, and other activities carried out by key industry participants.
The research methodology used in the report involves various secondary sources such as Japan Automobile Manufacturers Association (JAMA), European Automobile Manufacturers Association (ACEA), Canadian Automobile Association (CAA), and Korea Automobile Manufacturers Association (KAMA). Experts from related industries and suppliers have been interviewed to understand the future trends of the automotive pressure sensors market. Both, bottom-up and top-down approaches have been used to estimate and validate the size of the global market. The market size, by volume, is derived by identifying the region-wise production volumes and analyzing the demand trends. The market size, by value, is derived by multiplying the average selling price of automotive pressure sensors by the number of pressure sensors installed in the automobiles of that region.
The figure given below illustrates the break-up of the profile of industry experts who participated in primary discussions.
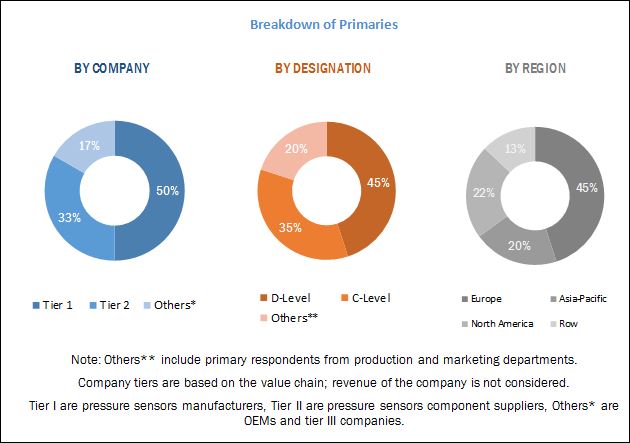
To know about the assumptions considered for the study, download the pdf brochure
The ecosystem of the automotive pressure sensors market consists of manufacturers such as Infineon (Germany), NXP (Netherlands), Robert Bosch (Germany), Continental (Germany), and Analog Devices (US) and research institutes such as the Japan Automobile Manufacturers Association (JAMA), European Automobile Manufacturers Association (ACEA), Canadian Automobile Association (CAA), and Korea Automobile Manufacturers Association (KAMA).
Target Audience
- Automotive pressure sensors manufacturers
- Automobile manufacturers
- Pressure sensors design companies
- Automobile organizations/associations
- Pressure sensors suppliers
- Raw material suppliers for automotive pressure sensors
- Traders and distributors of automotive pressure sensors
- Manufacturers of automotive pressure sensors for passenger cars, light commercial vehicles, and heavy commercial vehicles
- Raw material suppliers
- Automotive component manufacturers
- Tier 1, Tier 2, and Tier 3 suppliers
- Distributors and suppliers of automotive components/parts
Get online access to the report on the World's First Market Intelligence Cloud
- Easy to Download Historical Data & Forecast Numbers
- Company Analysis Dashboard for high growth potential opportunities
- Research Analyst Access for customization & queries
- Competitor Analysis with Interactive dashboard
- Latest News, Updates & Trend analysis
Request Sample Scope of the Report
Get online access to the report on the World's First Market Intelligence Cloud
- Easy to Download Historical Data & Forecast Numbers
- Company Analysis Dashboard for high growth potential opportunities
- Research Analyst Access for customization & queries
- Competitor Analysis with Interactive dashboard
- Latest News, Updates & Trend analysis

Market, By Application Type
Market, By Electric Vehicle Type
Market, By Vehicle Type
Market, By Transduction Type
Market, By Technology
Market, By Region
-
- ABS
- Airbags
- Direct TPMS
- Engine Control System
- HVAC
- Power Steering
- Transmission
- BEV
- HEV
- PHEV
- FCEV
- Passenger Cars (PC)
- Commercial Vehicles (CV)
- Piezoresistive
- Capacitive
- Optical
- Resonant
- Others
- MEMS
- Strain Gauge
- Ceramic
- Asia Pacific
- Europe
- North America
- Rest of the World
Available Customizations
MarketsandMarkets offers the following customizations for this market report:
- Detailed analysis and profiling of additional regions (up to 3)
- Detailed analysis and profiling of additional market players (up to 3)
- Detailed analysis of additional automotive pressure sensors variants (only 1)
- Detailed analysis of additional technology of automotive pressure sensors (only 1)
The global automotive pressure sensors market is estimated to be USD 4.21 Billion in 2017 and is projected to grow to USD 8.84 Billion by 2025, at a CAGR of 9.70%.
The automotive pressure sensors are typically used to gauge the pressure of liquid and gases in a vehicle. Hence, they can be used in many systems of a vehicle. The automotive pressure sensors market is segmented by application into the transmission, engine control system, power steering, HVAC, airbags, ABS, and direct TPMS. The engine control system is estimated to hold the largest share of the market, by application. Automotive pressure sensors for the engine control system are used in the engine, fuel injection pump, and exhaust.
ABS is estimated to be the fastest growing market for automotive pressure sensors, by application. Factors contributing to the growth of this segment include the mandates related to safety and security features. For example, the mandatory installation of ABS in passenger cars from 2018 in India can boost the market for automotive pressure sensors.
By technology, the market for MEMS pressure sensors is estimated to experience the highest growth during the forecast period. With the advent of the era of advanced technologies, the use of advanced MEMS pressure sensors has increased. The MEMS pressure sensors are widely used in all major advanced applications of electric as well as conventional vehicles.
By electric vehicle type, HEV is estimated to hold the largest share of the automotive pressure sensors market during the forecast period. The market growth can be attributed to the high level of production of HEVs during the forecast period. Also, the higher installation rate of pressure sensors in its powertrain system, as compared to BEV and FCEV, has triggered the growth of the market.
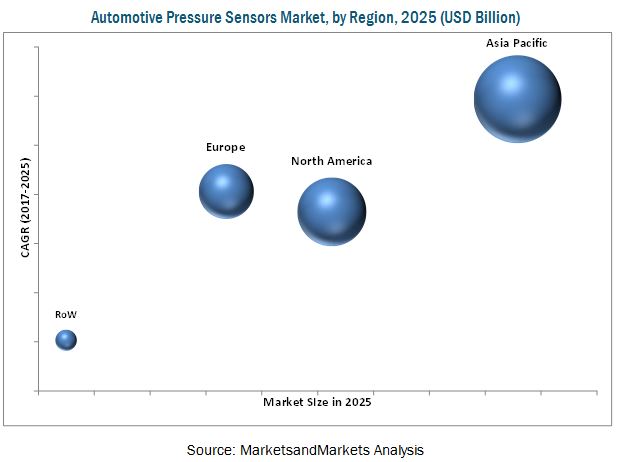
Asia Pacific is estimated to lead the automotive pressure sensors market during the forecast period, followed by North America and Europe. The European market is estimated to grow at a steady pace as most of the vehicles are equipped with high-end electronics and safety features. The North American market is expected to experience a balanced growth, in terms of value and volume, as pressure sensors have gained popularity in the region. The existing vehicles in North America are equipped with advanced safety features and body electronics, which serve the majority of the market.
Restraints of the automotive pressure sensors market:
Despite the high demand for advanced automotive electrical systems, the market still experiences certain obstacles. The restraints for the market include a complex manufacturing process, curbing down operation failure along with optimizing cost and quality trade-off.
The global automotive pressure sensors market is dominated by a few players such as NXP (Netherlands), Infineon Technologies (Germany), Sensata (US), and Texas Instruments (US) along with tier I and tier II suppliers.
To speak to our analyst for a discussion on the above findings, click Speak to Analyst
Table of Contents
1 Introduction (Page No. - 17)
1.1 Objectives of the Study
1.2 Market Definition
1.3 Market Scope
1.3.1 Years Considered in the Report
1.4 Currency & Pricing
1.5 Package Size
1.6 Limitations
1.7 Stakeholders
2 Research Methodology (Page No. - 21)
2.1 Research Data
2.2 Secondary Data
2.2.1 Key Secondary Sources
2.2.2 Key Data From Secondary Sources
2.3 Primary Data
2.3.1 Sampling Techniques & Data Collection Methods
2.3.2 Primary Participants
2.4 Factor Analysis
2.4.1 Demand-Side Analysis
2.4.1.1 Increasing Demand for Automotive Pressure Sensors From the OEMS
2.4.1.2 Emergence of Semi-Autonomous and Autonomous Vehicles
2.4.2 Supply-Side Analysis
2.4.2.1 Stringent Government Regulations in Automotive Industry is Triggering the Pressure Sensors Market
2.5 Market Size Estimation
2.5.1 Bottom-Up Approach
2.5.2 Top-Down Approach
2.6 Market Breakdown and Data Triangulation
2.7 Assumptions
3 Executive Summary (Page No. - 33)
4 Premium Insights (Page No. - 38)
4.1 Automotive Pressure Sensors Market, 2017 vs 2025
4.2 Market, By Region, 2017 vs 2025
4.3 Market, By Application, 2017 vs 2025
4.4 Market, By Transduction Principle, 2017 vs 2025
4.5 Market, By Technology, 2017 vs 2025
4.6 Market, By Vehicle Type, 2017 vs 2025
4.7 Market, By Electric Vehicle, 2017 vs 2025
5 Market Overview (Page No. - 42)
5.1 Introduction
5.2 Market Dynamics
5.2.1 Drivers
5.2.1.1 Rapid Installation of Electronic Components in Automobiles
5.2.1.2 Robust Growth of MEMs Technology
5.2.2 Restraints
5.2.2.1 Offering Desired Reliability and Curbing Down Operation Failure
5.2.2.2 Complex Manufacturing Process and High Cycle Time
5.2.3 Opportunities
5.2.3.1 Growing Demand for Piezoelectric Automotive Applications
5.2.3.2 Emergence of Fusion Box Technology
5.2.4 Challenges
5.2.4.1 Maintaining Cost Effectiveness
5.2.4.2 Meeting Automotive Certifications, Requirements, and Environment Compliances
5.3 Macro-Indicator Analysis
5.3.1 Introduction
5.3.2 GDP (USD Billion)
5.3.3 GNI Per Capita, Atlas Method (USD)
5.3.4 GDP Per Capita PPP (USD)
5.3.5 Macro Indicators Influencing the Automotive Pressure Sensors Market for Top 3 Countries
5.3.5.1 China
5.3.5.2 US
5.3.5.3 Germany
6 Automotive Pressure Sensors Market, By Applications (Page No. - 52)
6.1 Introduction
6.2 Antilock Braking System (ABS)
6.3 Airbag System
6.4 Direct Tire Pressure Monitoring System
6.5 Engine Control System
6.5.1 Engine
6.5.2 Fuel Injection Pump
6.5.3 Exhaust
6.6 HVAC System
6.7 Power Steering
6.7.1 Hydraulic Power Steering
6.7.2 Electrohydraulic Power Steering (EHPS)
6.8 Transmission System
6.8.1 Automatic Transmission (AT)
6.8.2 Automatic Manual Transmission (AMT)
6.8.3 Continuously Variable Transmission (CVT)
6.8.4 Dual-Clutch Transmission (DCT)
7 Automotive Pressure Sensors Market, By Technology (Page No. - 68)
7.1 Introduction
7.2 Ceramic Pressure Sensor
7.3 MEMS Pressure Sensor
7.4 Strain Gauge Pressure Sensor
8 Automotive Pressure Sensors Market, By Transduction Type (Page No. - 74)
8.1 Introduction
8.2 Piezoresistive Pressure Sensor
8.3 Capacitive Pressure Sensor
8.4 Resonant Pressure Sensor
8.5 Optical Pressure Sensor
8.6 Other Pressure Sensors
9 Automotive Pressure Sensors Market, By Vehicle Type (Page No. - 86)
9.1 Introduction
9.2 Passenger Cars
9.3 Commercial Vehicles
10 Automotive Pressure Sensors Market, By Ev Type (Page No. - 92)
10.1 Introduction
10.2 Battery Electric Vehicle (BEV)
10.3 Fuel Cell Electric Vehicle (FCEV)
10.4 Hybrid Electric Vehicle (HEV)
10.5 Plug-In Hybrid Electric Vehicle (PHEV)
11 Automotive Pressure Sensors Market, By Region (Page No. - 101)
11.1 Introduction
11.2 Asia Pacific
11.2.1 China
11.2.2 India
11.2.3 Japan
11.2.4 South Korea
11.3 Europe
11.3.1 Germany
11.3.2 Italy
11.3.3 France
11.3.4 Spain
11.3.5 UK
11.4 North America
11.4.1 US
11.4.2 Canada
11.4.3 Mexico
11.5 Rest of the World
11.5.1 Brazil
11.5.2 Russia
11.5.3 South Africa
12 Competitive Landscape (Page No. - 129)
12.1 Overview
12.2 Market Ranking Analysis
12.3 Competitive Scenario
12.3.1 New Product Developments
12.3.2 Expansion
12.3.3 Acquisition
12.3.4 Supply Contracts/Partnership/Collaborations
13 Company Profiles (Page No. - 136)
(Overview, Products Offered, Recent Developments, MnM View, SWOT Analysis)*
13.1 Infineon
13.2 Sensata
13.3 Robert Bosch
13.4 Denso
13.5 Delphi
13.6 Continental
13.7 Analog Devices
13.8 NXP
13.9 Texas Instruments
13.10 Melexis
13.11 TE Connectivity
13.12 General Electric
*Overview, Products Offered, Recent Developments, MnM View, SWOT Analysis Might Not Be Captured in Case of Unlisted Companies.
14 Appendix (Page No. - 170)
14.1 Insights of Industry Experts
14.2 Discussion Guide
14.3 Knowledge Store: Marketsandmarkets’ Subscription Portal
14.4 Available Customizations
14.4.1 Detailed Analysis and Profiling of Additional Countries (Up to 3)
14.4.2 Detailed Analysis and Profiling of Additional Market Players (Up to 3)
14.4.3 Detailed Analysis of Additional Automotive Pressure Sensors Variants (Only 1)
14.4.4 Detailed Analysis of Additional Technology of Automotive Pressure Sensors (Only 1)
14.5 Related Reports
14.6 Author Details
List of Tables (96 Tables)
Table 1 Currency Exchange Rates
Table 2 Regulations for Selected Applications Related to Automotive Pressure Sensors
Table 3 Certifications Pertaining to Automotive Pressure Sensors Market
Table 4 Market, By Applications, 2015–2025 (Million Units)
Table 5 Market, By Applications, 2015–2025 (USD Million)
Table 6 ABS: Market, By Region, 2015–2025 (Million Units)
Table 7 ABS: Market, By Region, 2015–2025 (USD Million)
Table 8 Airbag System: Market, By Region, 2015–2025 (Million Units)
Table 9 Airbag System: Market, By Region, 2015–2025 (USD Million)
Table 10 Direct TPMS: Market, By Region, 2015–2025 (Million Units)
Table 11 Direct TPMS: Market, By Region, 2015–2025 (USD Million)
Table 12 Engine Control System: Market, By Region, 2015–2025 (Million Units)
Table 13 Engine Control System: Market, By Region, 2015–2025 (USD Million)
Table 14 HVAC: Market, By Region, 2015–2025 (Million Units)
Table 15 HVAC: Market, By Region, 2015–2025 (USD Million)
Table 16 Power Steering: Automotive Pressure Sensor Market, By Region, 2015–2025 (Million Units)
Table 17 Power Steering: Market, By Region, 2015–2025 (USD Million)
Table 18 Transmission System: Market, By Region, 2015–2025 (Million Units)
Table 19 Transmission System: Market, By Region, 2015–2025 (USD Million)
Table 20 Market, By Technology, 2015–2025 (USD Million)
Table 21 Ceramic Pressure Sensor: Market, By Region, 2015–2025 (USD Million)
Table 22 MEMs Pressure Sensor: Market, By Region, 2015–2025 (USD Million)
Table 23 Strain Gauge Pressure Sensor: Market, By Region, 2015–2025 (USD Million)
Table 24 Market, By Transduction Type, 2015–2025 (Million Units)
Table 25 Market Size, By Transduction Type, 2015–2025 (USD Million)
Table 26 Piezoresistive Pressure Sensor: Market, By Region, 2015–2025 (Million Units)
Table 27 Piezoresistive Pressure Sensor: Market, By Region, 2015–2025 (USD Million)
Table 28 Capacitive Pressure Sensor: Market, By Region, 2015–2025 (Million Units)
Table 29 Capacitive Pressure Sensor: Market, By Region, 2015–2025 (USD Million)
Table 30 Resonant Pressure Sensor: Market, By Region, 2015–2025 (Million Units)
Table 31 Resonant Pressure Sensor: Market, By Region, 2015–2025 (USD Million)
Table 32 Optical Pressure Sensor: Market, By Region, 2015–2025 (Million Units)
Table 33 Optical Pressure Sensor: Market, By Region, 2015–2025 (USD Million)
Table 34 Other Sensors: Market, By Region, 2015–2025 (Million Units)
Table 35 Other Sensors: Market, By Region, 2015–2025 (USD Million)
Table 36 Market, By Vehicle Type, 2015–2025 (Million Units)
Table 37 Market, By Vehicle Type, 2015–2025 (USD Million)
Table 38 Passenger Cars: Market, By Region, 2015–2025 (Million Units)
Table 39 Passenger Cars: Market, By Region, 2015–2025 (USD Million)
Table 40 Commercial Vehicles: Market, By Region, 2015–2025 (Million Units)
Table 41 Commercial Vehicles: Market, By Region, 2015–2025 (USD Million)
Table 42 Market Size, By Ev Type, 2015–2025 (’000 Units)
Table 43 Automotive Pressure Sensors Market Size, By Ev Type, 2015–2025 (USD Thousand)
Table 44 Battery Electric Vehicle: Market Size, By Region, 2015–2025 (’000 Units)
Table 45 Battery Electric Vehicle: Market Size, By Region, 2015–2025 (USD Thousand)
Table 46 Fuel Cell Electric Vehicle: Market Size, By Region, 2015–2025 (’000 Units)
Table 47 Fuel Cell Electric Vehicle: Market Size, By Region, 2015–2025 (USD Thousand)
Table 48 Hybrid Electric Vehicle: Market Size, By Region, 2015–2025 (’000 Units)
Table 49 Hybrid Electric Vehicle: Market Size, By Region, 2015–2025 (USD Thousand)
Table 50 Plug-In Hybrid Electric Vehicle: Market Size, By Region, 2015–2025 (’000 Units)
Table 51 Plug-In Hybrid Electric Vehicle: Market Size, By Region, 2015–2025 (USD Thousand)
Table 52 Market, By Region, 2015–2025 (Million Units)
Table 53 Market, By Region, 2015–2025 (USD Million)
Table 54 Asia Pacific: Market, By Country, 2015–2025 (Million Units)
Table 55 Asia Pacific: Market, By Country, 2015–2025 (USD Million)
Table 56 China: Market, By Application, 2015–2025 (Million Units)
Table 57 China: Market, By Application, 2015–2025 (USD Million)
Table 58 India: Market, By Application, 2015–2025 (Million Units)
Table 59 India: Market, By Application, 2015–2025 (USD Million)
Table 60 Japan: Market, By Application, 2015–2025 (Million Units)
Table 61 Japan: Market, By Application, 2015–2025 (USD Million)
Table 62 South Korea: Market, By Application, 2015–2025 (Million Units)
Table 63 South Korea: Market, By Application, 2015–2025 (USD Million)
Table 64 Europe: Market, By Country, 2015–2025 (Million Units)
Table 65 Europe: Market, By Country, 2015–2025 (USD Million)
Table 66 Germany: Automotive Pressure Sensors Market, By Application, 2015–2025 (Million Units)
Table 67 Germany: Market, By Application, 2015–2025 (USD Million)
Table 68 Italy: Market, By Application, 2015–2025 (Million Units)
Table 69 Italy: Market, By Application, 2015–2025 (USD Million)
Table 70 France: Market, By Application, 2015–2025 (Million Units)
Table 71 France: Market, By Application, 2015–2025 (USD Million)
Table 72 Spain: Market, By Application, 2015–2025 (Million Units)
Table 73 Spain: Market, By Application, 2015–2025 (USD Million)
Table 74 UK: Market, By Application, 2015–2025 (Million Units)
Table 75 UK: Market, By Application, 2015–2025 (USD Million)
Table 76 North America: Market, By Country, 2015–2025 (Million Units)
Table 77 North America: Market, By Country, 2015–2025 (USD Million)
Table 78 US: Market, By Application, 2015–2025 (Million Units)
Table 79 US: Market, By Application, 2015–2025 (USD Million)
Table 80 Canada: Automotive Pressure Sensors Market, By Application, 2015–2025 (Million Units)
Table 81 Canada: Market, By Application, 2015–2025 (USD Million)
Table 82 Mexico: Market, By Application, 2015–2025 (Million Units)
Table 83 Mexico: Market, By Application, 2015–2025 (USD Million)
Table 84 Rest of the World: Market, By Country, 2015–2025 (Million Units)
Table 85 Rest of the World: Market, By Country, 2015–2025 (USD Million)
Table 86 Brazil: Market, By Application, 2015–2025 (Million Units)
Table 87 Brazil: Market, By Application, 2015–2025 (USD Million)
Table 88 Russia: Market, By Application, 2015–2025 (Million Units)
Table 89 Russia: Market, By Application, 2015–2025 (USD Million)
Table 90 South Africa: Market, By Application, 2015–2025 (Million Units)
Table 91 South Africa: Market, By Application, 2015–2025 (USD Million)
Table 92 Automotive Pressure Sensor Market Ranking: 2016
Table 93 New Product Developments, 2015–2017
Table 94 Expansions, 2015–2017
Table 95 Acquisitions, 2015–2017
Table 96 Supply Contracts/Partnership/Collaborations, 2015–2017
List of Figures (74 Figures)
Figure 1 Market Segments of Automotive Pressure Sensors Market, 2017–2025
Figure 2 Market: Research Design
Figure 3 Research Design Model
Figure 4 Breakdown of Primary Interviews
Figure 5 Import Statistics of Automotive Pressure Sensors for Top 5 Countries (2016)
Figure 6 Estimated Market Size of Semi-Autonomous Vehicles (2017)
Figure 7 Market: Bottom-Up Approach
Figure 8 Market: Top-Down Approach
Figure 9 Data Triangulation
Figure 10 Market: China to Be the Fastest-Growing and Largest Market
Figure 11 Market Size, By Application Type (USD Million)
Figure 12 Market Size, By Technology (USD Million)
Figure 13 Market Size, By Region (USD Million)
Figure 14 Automotive Pressure Sensors Market Size, By Vehicle Type (USD Million)
Figure 15 Attractive Opportunities in the Market During the Forecast Period
Figure 16 Asia Pacific is Expected to Lead the Market in Terms of Value
Figure 17 The Engine Control System Segment is Expected to Lead the Market, By Application
Figure 18 The Piezoresistive Pressure Sensor Segment is Expected to Lead the Market Value, By Transduction Principle
Figure 19 The MEMs Segment is Expected to Lead the Automotive Pressure Sensors Market Value, By Technology
Figure 20 The Passenger Cars Segment is Expected to Lead the Market Value, By Vehicle Type
Figure 21 The Plug-In Hybrid Electric Vehicle Segment is Expected to Lead the Market Value, By Electric Vehicle Type
Figure 22 Market: Market Dynamics
Figure 23 Installation Rate Pressure Sensors for Different Automotive Applications During the Forecast Period
Figure 24 MEMs Technology Adoption in Different Automotive Applications
Figure 25 China: Rising Purchasing Power Parity to Be the Most Crucial Indicator for Accelerating the Demand for High-End Technologies
Figure 26 US: Rising GNI Per Capita Expected to Drive the Scale of Automotive Pressure Sensors During the Forecast Period
Figure 27 Germany: Domestic Demand Expected to Play A Crucial Role Owing to Mounting German Trade Surplus
Figure 28 Automotive Pressure Sensors Market, By Applications, 2017 vs 2025 (USD Million)
Figure 29 ABS: Market, By Region, 2017 vs 2025 (USD Million)
Figure 30 Airbag System: Market, By Region, 2017 vs 2025 (USD Million)
Figure 31 Direct TPMS: Market, By Region, 2017 vs 2025 (USD Million)
Figure 32 Engine Control System: Market, By Region, 2017 vs 2025 (USD Million)
Figure 33 HVAC System: Market, By Region, 2017 vs 2025 (USD Million)
Figure 34 Power Steering: Automotive Pressure Sensor Market, By Region, 2017 vs 2025 (USD Million)
Figure 35 Transmission System: Market, By Region, 2017 vs 2025 (USD Million)
Figure 36 Market, By Technology, 2017 vs 2025 (USD Million)
Figure 37 Global Market for Ceramic Pressure Sensor, By Region, 2017 vs 2025 (USD Million)
Figure 38 Global Market for MEMs Pressure Sensor, By Region, 2017 vs 2025 (USD Million)
Figure 39 Strain Gauge Pressure Sensor: Market, By Region, 2017 vs 2025 (USD Million)
Figure 40 Market, By Transduction Type, “2017 vs 2025 (USD Million)
Figure 41 Piezoresistive Pressure Sensor: Market, By Region, 2017 vs 2025 (USD Million)
Figure 42 Capacitive Pressure Sensor: Market, By Region, 2017 vs 2025 (USD Million)
Figure 43 Resonant Pressure Sensor: Market, By Region, 2017 vs 2025 (USD Million)
Figure 44 Optical Pressure Sensor: Market, By Region, 2017 vs 2025 (USD Million)
Figure 45 Other Pressure Sensors: Market, By Region, 2017 vs 2025 (USD Million)
Figure 46 Market, By Vehicle Type, 2017 vs 2025 (USD Million)
Figure 47 Market, By Electric Vehicle Type, 2017 vs 2025
Figure 48 Battery Electric Vehicle: Market, By Region, 2017 vs 2025 (USD Thousand)
Figure 49 Fuel Cell Electric Vehicle: Market, 2017 vs 2025 (USD Thousand)
Figure 50 Hybrid Electric Vehicle: Market, 2017 vs 2025 (USD Thousand)
Figure 51 Plug-In Hybrid Electric Vehicle: Market, By Region, 2017 vs 2025 (USD Thousand)
Figure 52 Automotive Pressure Sensors Market, By Region, 2017–2025
Figure 53 Asia Pacific: Market Snapshot
Figure 54 Europe: Market, By Country, 2017 vs 2025 (USD Million)
Figure 55 North America: Market Snapshot
Figure 56 Rest of the World: Market, By Country, 2017 vs 2025 (USD Million)
Figure 57 Key Development By Leading Players in the Automotive Pressure Sensor Market for 2014–2017
Figure 58 Company Snapshot: Infineon
Figure 59 Infineon
Figure 60 Company Snapshot: Sensata
Figure 61 Sensata
Figure 62 Company Snapshot: Robert Bosch
Figure 63 Robert Bosch
Figure 64 Company Snapshot: Denso
Figure 65 Denso
Figure 66 Company Snapshot: Delphi
Figure 67 Delphi
Figure 68 Company Snapshot: Continental
Figure 69 Company Snapshot: Analog Devices
Figure 70 Company Snapshot: NXP
Figure 71 Company Snapshot: Texas Instruments
Figure 72 Company Snapshot: Melexis
Figure 73 Company Snapshot: TE Connectivity
Figure 74 Company Snapshot: General Electric


Growth opportunities and latent adjacency in Automotive Pressure Sensors Market