Cognitive Analytics Market by Application (Fraud and Risk Management, Customer Analysis and Personalization, and Sales and Marketing Management), Component, Deployment Model, Organization Size, Industry, and Region - Global Forecast to 2022


[162 Pages Report] Cognitive analytics enables business users to apply human-like intelligence to various tasks, such as identifying context from the text, audio, and image. It utilizes varied advanced technologies including Artificial Intelligence (AI), machine learning, and Natural Language Processing (NLP). The cognitive analytics market size accounted for USD 1.62 Billion in 2016 and is projected to reach USD 10.95 Billion by 2022, at a Compound Annual Growth Rate (CAGR) of 42.9% during the forecast period. For the report, 2016 is considered to be the base year while the forecast period under consideration is 2017�2022.
Following are the objectives of the report:
- To describe and forecast the global cognitive analytics market on the basis of components (tools and services), applications, deployment models, organization size, industries, and regions
- To forecast the market size of the 5 main regions, namely, North America, Europe, Asia Pacific (APAC), Middle East and Africa (MEA), and Latin America
- To analyze subsegments with respect to the individual growth trends, prospects, and contributions to the total market
- To provide detailed information regarding the major factors influencing the growth of the market (drivers, restraints, opportunities, and challenges)
- To analyze the opportunities in the market for stakeholders and provide details of a competitive landscape for the major players
- To comprehensively analyze the core competencies of the key players by tracking their mergers and acquisitions, new product developments, product enhancements, agreements, business expansions, and partnerships and collaborations in the cognitive analytics market
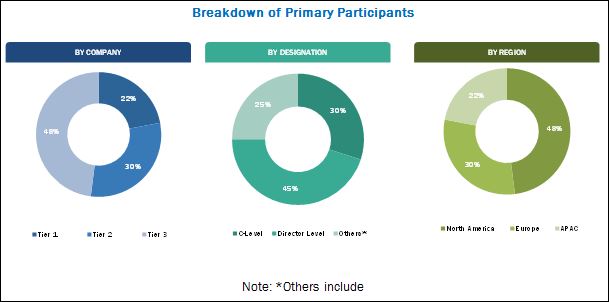
The research methodology used to estimate and forecast the cognitive analytics market began with capturing the data on key vendor�s revenues through secondary research sources, such as company websites, Factiva, and D&B Hoovers. The other secondary sources included annual reports, press releases, and investor presentations of companies; white papers and certified publications; and articles from recognized authors, directories, and databases. The vendor offerings were also taken into consideration to determine the market segmentation. The bottom-up procedure was employed to arrive at the overall market size of the global cognitive analytics market from the revenue of the key players in the market. After arriving at the overall market size, the total market was split into several segments and subsegments, which were then verified through primary research by conducting extensive interviews with the key people, such as Chief Executive Officers (CEOs), Vice Presidents (VPs), directors, and executives. The data triangulation and market breakdown procedures were employed to complete the overall market engineering process and arrive at the exact statistics for all the segments and subsegments. The breakdown of profiles of primary is depicted in the below figure.
To know about the assumptions considered for the study, download the pdf brochure
The cognitive analytics market comprises several vendors, such as IBM (US), Amazon Web Services (US), Google (US), Microsoft (US), Oracle (US), SAS Institute (US), Intel (US), Cisco Systems (US), HPE (US), Nuance Communications (US), IPsoft (US), Narrative Science (US), Nokia (Finland), Sinequa (France), and Persado (US). The other stakeholders of the cognitive analytics market include analytics service providers, consulting service providers, Information Technology (IT) service providers, resellers, enterprise users, and technology providers. These Cognitive Analytics Solutions Vendors are rated and listed by us on the basis of product quality, reliability, and their business strategy. Please visit 360Quadrants to see the vendor listing of Cognitive Analytics Solutions.
The target audience of the cognitive analytics market report are:
- Cognitive analytics software vendors
- Managed Service Providers (MSPs)
- System integrators
- Networking companies
- Integrated Device Manufacturers (IDMs)
- Cloud solution providers
- Third-party providers
- Value-Added Resellers (VARs)
- Government agencies
- Consultants/consultancies/advisory firms
- Support and maintenance service providers
- Technology providers/investors
The study answers several questions for the stakeholders, primarily which market segments to focus on, in the next 2 to 5 years for prioritizing the efforts and investments.
Get online access to the report on the World's First Market Intelligence Cloud
Request Sample Scope of the Report

The research report categorizes the cognitive analytics market to forecast the revenues and analyze the trends in each of the following subsegments:
By Component
- Tools
- Services
By Service
- Managed services
- Professional services
- Consulting services
- Deployment and integration
- Support and maintenance
By Application
- Asset maintenance
- Fraud and risk management
- Customer analysis and personalization
- Sales and marketing management
- Supply chain management
- Others
By Deployment Model
- On-premises
- On-demand
By Organization Size
- Small and Medium-sized Enterprises (SMEs)
- Large enterprises
By Industry
- Banking, Financial Services, and Insurance (BFSI)
- Telecommunications and IT
- Retail and consumer goods
- Healthcare and life sciences
- Manufacturing
- Government and defense
- Energy and utilities
- Media and entertainment
- Transportation and logistics
- Others
By Region
- North America
- Europe
- APAC
- Latin America
- MEA
Available Customizations
With the given market data, MarketsandMarkets offers customizations as per the company�s specific needs. The following customization options are available for the report:
Geographic Analysis
- Further breakdown of the North American cognitive analytics market
- Further breakdown of the European market
- Further breakdown of the APAC market
- Further breakdown of the MEA market
- Further breakdown of the Latin American market
Company Information
- Detailed analysis and profiling of additional market players
The cognitive analytics market is expected to grow from USD 1.84 Billion in 2017 to USD 10.95 Billion by 2022, at a Compound Annual Growth Rate (CAGR) of 42.9% during the forecast period. The major growth drivers of the market include the rise in the adoption of the cognitive computing technology, the proliferation of data, and the introduction of advanced analytics techniques, which are fueling the demand for effective cognitive analytics solutions. However, the lack of trust in technology and complex analytical processes are expected to limit the growth opportunities for proprietary solution vendors in the market. The cognitive analytics market also faces some challenges, such as the lack of skilled workforce, and data quality and security issues.
The cognitive analytics market is segmented by component into tools and service. The services segment is expected to grow at a higher CAGR during the forecast period. Among the services, the managed services segment is projected to witness a higher CAGR, due to the increasing demand for outsourced cognitive analytics services.
The healthcare and life sciences industry is estimated to have the largest share of the cognitive analytics market in 2017. Cognitive analytics enables organizations in the healthcare and life sciences industry to accelerate scientific discoveries, transform clinical trials, and improve the execution and engagement for better treatment and care management, leading to the high adoption of the technology in this industry.
The major applications of cognitive analytics include asset maintenance, fraud and risk management, customer analysis and personalization, sales and marketing management, supply chain management, and others (network management and workforce management). The fraud and risk management application is expected to grow at the highest CAGR during the forecast period. The cognitive analytics market is expected to grow in the fraud and risk management application, as it helps companies analyze and clarify ambiguous and uncertain data, and find the known and unknown risk indicators. Companies in both public and private sectors are using large volumes of data both internally as well as externally. Therefore, they experience the need to adopt a preventive risk management approach. By combining the data processing ability with learning capabilities, the cognitive systems can detect deep hidden anomalies and patterns, which are almost impossible to detect with the traditional approaches.
Organizations are deploying cognitive analytics solutions, either on-premises or on-demand (cloud). The demand for cloud-based cognitive analytics solutions is expected to grow at a higher rate. Due to the scalability and agility of cloud-based technologies, more enterprises are proactively adopting cloud-based cognitive analytics solutions to avail the cost-saving benefits and increase their operational efficiency.
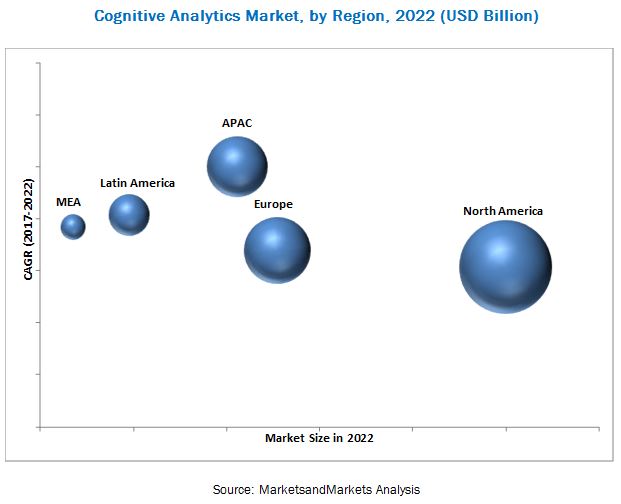
On the basis of regions, the global cognitive analytics market has been segmented into North America, Europe, Asia Pacific (APAC), Latin America, and Middle East and Africa (MEA). The North American region, followed by Europe, is expected to be the largest revenue generating region for cognitive analytics vendors, for the next 5 years. This is mainly due to high adoption of advanced technological solutions and increasing focus on innovations through Research and Development (R&D). The APAC region is expected to be the fastest growing region in the cognitive analytics market, due to factors such as rapid economic developments, globalization, foreign direct investments, digitalization, and increased adoption of high-end technologies across major APAC countries.
The major vendors that offer cognitive analytics tools and services globally are Amazon Web Services (US), Google (US), IBM (US), Intel (US), Microsoft (US), Oracle (US), SAS Institute (US), HPE (US), Nuance Communications (US), IPsoft (US), Narrative Science (US), Cisco Systems (US), Nokia (Finland), Persado (US), and Sinequa (France). These vendors have adopted different types of organic and inorganic growth strategies, such as new product launches, product developments, partnerships and collaborations, and mergers and acquisitions, to expand their offerings in the cognitive analytics market.
To speak to our analyst for a discussion on the above findings, click Speak to Analyst
Table of Contents
1 Introduction (Page No. - 16)
1.1 Objectives of the Study
1.2 Market Definition
1.3 Market Scope
1.4 Years Considered for the Study
1.5 Currency Considered
1.6 Stakeholders
2 Research Methodology (Page No. - 19)
2.1 Research Data
2.1.1 Secondary Data
2.1.2 Primary Data
2.1.2.1 Breakdown of Primaries
2.1.2.2 Key Industry Insights
2.2 Market Size Estimation
2.3 Research Assumptions
2.4 Limitations
3 Executive Summary (Page No. - 27)
4 Premium Insights (Page No. - 33)
4.1 Attractive Market Opportunities in the Cognitive Analytics Market
4.2 Market Share Across Various Regions
4.3 Market By Industry and Region
4.4 Market Professional Services, By Region
5 Market Overview and Industry Trends (Page No. - 36)
5.1 Introduction
5.2 Market Dynamics
5.2.1 Drivers
5.2.1.1 Rise in Adoption of Cognitive Computing Technology
5.2.1.2 Increasing Volume of Complex Data
5.2.1.3 Introduction of Advanced Analytics Techniques
5.2.2 Restraints
5.2.2.1 Lack of Trust in Technology
5.2.2.2 Complex Analytical Process
5.2.3 Opportunities
5.2.3.1 Increasing Adoption of Cloud Technology
5.2.3.2 Higher Adoption By Smes
5.2.4 Challenges
5.2.4.1 Lack of Skilled Workforce
5.2.4.2 Managing Data Quality and Safety
5.3 Industry Trends
5.3.1 Cognitive Analytics Use Cases
5.3.1.1 Use Case 1: Biomedical Research (Healthcare and Life Sciences)
5.3.1.2 Use Case 2: Customer Experience Management (Retail and Consumer Goods)
5.3.1.3 Use Case 3: Predictive Modeling (Online Advertising and Ecommerce)
5.3.1.4 Use Case 4: Inventory Management (Manufacturing)
5.3.1.5 Use Case 5: Web Security (Oil and Gas)
5.3.1.6 Use Case 6: Data Discovery and Advisory (Banking and Financial Services)
5.3.2 Top Trends in the Cognitive Analytics Market
5.3.2.1 Rapid Adoption of Cognitive-Enabled Virtual Assistants
5.3.2.2 Personalized Services
5.3.2.3 Major Opportunities for the Adoption of Cognitive Analytics in Healthcare
5.3.2.4 Demand for Highly Comprehensive, Legal, Regulatory, and Policy Frameworks is Driving the Adoption of Cognitive Analytics
5.3.3 Investment Scenario in the Market
5.3.3.1 Recent Key Investments in the Market
6 Cognitive Analytics Market Analysis, By Application (Page No. - 48)
6.1 Introduction
6.2 Asset Maintenance
6.3 Fraud and Risk Management
6.4 Customer Analysis and Personalization
6.5 Sales and Marketing Management
6.6 Supply Chain Management
6.7 Others
7 Cognitive Analytics Market Analysis, By Component (Page No. - 56)
7.1 Introduction
7.2 Tools
7.3 Services
7.3.1 Professional Services
7.3.1.1 Deployment and Integration
7.3.1.2 Support and Maintenance
7.3.1.3 Consulting Services
7.3.2 Managed Services
8 Cognitive Analytics Market Analysis, By Deployment Model (Page No. - 64)
8.1 Introduction
8.2 On-Premises
8.3 On-Demand
9 Cognitive Analytics Market Analysis, By Organization Size (Page No. - 68)
9.1 Introduction
9.2 Small and Medium-Sized Enterprises
9.3 Large Enterprises
10 Cognitive Analytics Market Analysis, By Industry (Page No. - 72)
10.1 Introduction
10.2 Banking, Financial Services, and Insurance
10.3 Healthcare and Life Sciences
10.4 Manufacturing
10.5 Retail and Consumer Goods
10.6 Energy and Utilities
10.7 Telecommunications and It
10.8 Transportation and Logistics
10.9 Government and Defense
10.10 Media and Entertainment
10.11 Others
11 Geographic Analysis (Page No. - 81)
11.1 Introduction
11.2 North America
11.2.1 By Country
11.2.1.1 United States
11.2.1.2 Canada
11.2.2 North America, By Component
11.2.3 North America, By Service
11.2.4 North America, By Professional Service
11.2.5 North America, By Application
11.2.6 North America, By Deployment Model
11.2.7 North America, By Organization Size
11.2.8 North America, By Industry
11.3 Europe
11.3.1 By Country
11.3.1.1 United Kingdom
11.3.1.2 Germany
11.3.1.3 France
11.3.1.4 Rest of Europe
11.3.2 Europe, By Component
11.3.3 Europe, By Service
11.3.4 Europe, By Professional Service
11.3.5 Europe, By Application
11.3.6 Europe, By Deployment Model
11.3.7 Europe, By Organization Size
11.3.8 Europe, By Industry
11.4 Asia Pacific
11.4.1 By Country
11.4.1.1 China
11.4.1.2 Japan
11.4.1.3 Australia
11.4.1.4 India
11.4.1.5 Rest of APAC
11.4.2 Asia Pacific, By Component
11.4.3 Asia Pacific, By Service
11.4.4 Asia Pacific, By Professional Service
11.4.5 Asia Pacific, By Application
11.4.6 Asia Pacific, By Deployment Model
11.4.7 Asia Pacific, By Organization Size
11.4.8 Asia Pacific, By Industry
11.5 Latin America
11.5.1 By Country
11.5.1.1 Mexico
11.5.1.2 Brazil
11.5.1.3 Rest of Latin America
11.5.2 Latin America, By Component
11.5.3 Latin America, By Service
11.5.4 Latin America, By Professional Service
11.5.5 Latin America, By Application
11.5.6 Latin America, By Deployment Model
11.5.7 Latin America, By Organization Size
11.5.8 Latin America, By Industry
11.6 Middle East and Africa
11.6.1 By Country
11.6.1.1 Middle East
11.6.1.2 Africa
11.6.2 Middle East and Africa, By Component
11.6.3 Middle East and Africa, By Service
11.6.4 Middle East and Africa, By Professional Service
11.6.5 Middle East and Africa, By Application
11.6.6 Middle East and Africa, By Deployment Model
11.6.7 Middle East and Africa, By Organization Size
11.6.8 Middle East and Africa, By Industry
12 Company Profiles (Page No. - 106)
(Overview, Strength of Product Portfolio, Business Strategy Excellence, Recent Developments)*
12.1 IBM
12.2 Amazon Web Services
12.3 Google
12.4 Microsoft
12.5 Oracle
12.6 SAS Institute
12.7 Intel
12.8 Cisco Systems
12.9 Nokia
12.10 HPE
12.11 Nuance Communications
12.12 Ipsoft
12.13 Narrative Science
12.14 Sinequa
12.15 Persado
*Details on Overview, Strength of Product Portfolio, Business Strategy Excellence, Recent Developments Might Not Be Captured in Case of Unlisted Companies.
13 Appendix (Page No. - 153)
13.1 Insights of Industry Experts
13.2 Discussion Guide
13.3 Knowledge Store: Marketsandmarkets� Subscription Portal
13.4 Introducing RT: Real-Time Market Intelligence
13.5 Available Customization
13.6 Related Reports
13.7 Author Details
List of Tables (70 Tables)
Table 1 Cognitive Analytics Market Size, By Application, 2015�2022 (USD Million)
Table 2 Asset Maintenance: Market Size, By Region, 2015�2022 (USD Million)
Table 3 Fraud and Risk Management: Market Size, By Region, 2015�2022 (USD Million)
Table 4 Customer Analysis and Personalization: Market Size, By Region, 2015�2022 (USD Million)
Table 5 Sales and Marketing Management: Market Size, By Region, 2015�2022 (USD Million)
Table 6 Supply Chain Management: Market Size, By Region, 2015�2022 (USD Million)
Table 7 Others: Market Size, By Region, 2015�2022 (USD Million)
Table 8 Cognitive Analytics Market Size, By Component, 2015�2022 (USD Million)
Table 9 Tools: Market Size, By Region, 2015�2022 (USD Million)
Table 10 Services: Market Size, By Type, 2015�2022 (USD Million)
Table 11 Services: Market Size, By Region, 2015�2022 (USD Million)
Table 12 Professional Services Market Size, By Type, 2015�2022 (USD Million)
Table 13 Professional Services Market Size, By Region, 2015�2022 (USD Million)
Table 14 Deployment and Integration Market Size, By Region, 2015�2022 (USD Million)
Table 15 Support and Maintenance Market Size, By Region, 2015�2022 (USD Million)
Table 16 Consulting Services Market Size, By Region, 2015�2022 (USD Million)
Table 17 Managed Services Market Size, By Region, 2015�2022 (USD Million)
Table 18 Cognitive Analytics Market Size, By Deployment Model, 2015�2022 (USD Million)
Table 19 On-Premises: Market Size, By Region, 2015�2022 (USD Million)
Table 20 On-Demand: Market Size, By Region, 2015�2022 (USD Million)
Table 21 Cognitive Analytics Market Size, By Organization Size, 2015�2022 (USD Million)
Table 22 Small and Medium-Sized Enterprises: Market Size, By Region, 2015�2022 (USD Million)
Table 23 Large Enterprises: Market Size, By Region, 2015�2022 (USD Million)
Table 24 Cognitive Analytics Market Size, By Industry, 2015�2022 (USD Million)
Table 25 Banking, Financial Services, and Insurance: Market Size, By Region, 2015�2022 (USD Million)
Table 26 Healthcare and Life Sciences: Market Size, By Region, 2015�2022 (USD Million)
Table 27 Manufacturing: Cognitive Analytics Market Size, By Region, 2015�2022 (USD Million)
Table 28 Retail and Consumer Goods: Market Size, By Region, 2015�2022 (USD Million)
Table 29 Energy and Utilities: Market Size, By Region, 2015�2022 (USD Million)
Table 30 Telecommunications and It: Market Size, By Region, 2015�2022 (USD Million)
Table 31 Transportation and Logistics: Market Size, By Region, 2015�2022 (USD Million)
Table 32 Government and Defense: Market Size, By Region, 2015�2022 (USD Million)
Table 33 Media and Entertainment: Market Size, By Region, 2015�2022 (USD Million)
Table 34 Others: Market Size, By Region, 2015�2022 (USD Million)
Table 35 Cognitive Analytics Market Size, By Region, 2015�2022 (USD Million)
Table 36 North America: Market Size, By Component, 2015�2022 (USD Million)
Table 37 North America: Market Size, By Service, 2015�2022 (USD Million)
Table 38 North America: Market Size, By Professional Service, 2015�2022 (USD Million)
Table 39 North America: Market Size, By Application, 2015�2022 (USD Million)
Table 40 North America: Market Size, By Deployment Model, 2015�2022 (USD Million)
Table 41 North America: Market Size, By Organization Size, 2015�2022 (USD Million)
Table 42 North America: Market Size, By Industry, 2015�2022 (USD Million)
Table 43 Europe: Cognitive Analytics Market Size, By Component, 2015�2022 (USD Million)
Table 44 Europe: Market Size, By Service, 2015�2022 (USD Million)
Table 45 Europe: Market Size, By Professional Service, 2015�2022 (USD Million)
Table 46 Europe: Market Size, By Application, 2015�2022 (USD Million)
Table 47 Europe: Market Size, By Deployment Model, 2015�2022 (USD Million)
Table 48 Europe: Market Size, By Organization Size, 2015�2022 (USD Million)
Table 49 Europe: Market Size, By Industry, 2015�2022 (USD Million)
Table 50 Asia Pacific: Cognitive Analytics Market Size, By Component, 2015�2022 (USD Million)
Table 51 Asia Pacific: Market Size, By Service, 2015�2022 (USD Million)
Table 52 Asia Pacific: Market Size, By Professional Service, 2015�2022 (USD Million)
Table 53 Asia Pacific: Market Size, By Application, 2015�2022 (USD Million)
Table 54 Asia Pacific: Market Size, By Deployment Model, 2015�2022 (USD Million)
Table 55 Asia Pacific: Market Size, By Organization Size, 2015�2022 (USD Million)
Table 56 Asia Pacific: Market Size, By Industry, 2015�2022 (USD Million)
Table 57 Latin America: Cognitive Analytics Market Size, By Component, 2015�2022 (USD Million)
Table 58 Latin America: Market Size, By Service, 2015�2022 (USD Million)
Table 59 Latin America: Market Size, By Professional Service, 2015�2022 (USD Million)
Table 60 Latin America: Market Size, By Application, 2015�2022 (USD Million)
Table 61 Latin America: Market Size, By Deployment Model, 2015�2022 (USD Million)
Table 62 Latin America: Market Size, By Organization Size, 2015�2022 (USD Million)
Table 63 Latin America: Market Size, By Industry, 2015�2022 (USD Million)
Table 64 Middle East and Africa: Cognitive Analytics Market Size, By Component, 2015�2022 (USD Million)
Table 65 Middle East and Africa: Market Size, By Service, 2015�2022 (USD Million)
Table 66 Middle East and Africa: Market Size, By Professional Service, 2015�2022 (USD Million)
Table 67 Middle East and Africa: Market Size, By Application, 2015�2022 (USD Million)
Table 68 Middle East and Africa: Market Size, By Deployment Model, 2015�2022 (USD Million)
Table 69 Middle East and Africa: Market Size, By Organization Size, 2015�2022 (USD Million)
Table 70 Middle East and Africa: Market Size, By Industry, 2015�2022 (USD Million)
List of Figures (40 Figures)
Figure 1 Cognitive Analytics Market Segmentation
Figure 2 Market Research Design
Figure 3 Breakdown of Primary Interviews: By Company, Designation, and Region
Figure 4 Data Triangulation
Figure 5 Market Size Estimation Methodology: Bottom-Up Approach
Figure 6 Market Size Estimation Methodology: Top-Down Approach
Figure 7 Assumptions
Figure 8 Global Cognitive Analytics Market, 2015-2022
Figure 9 Market By Component (2017-2022)
Figure 10 Market By Service (2017�2022)
Figure 11 Market By Professional Service (2017�2022)
Figure 12 Market By Application (2017�2022)
Figure 13 Market By Deployment Model (2017�2022)
Figure 14 Market By Organization Size (2017�2022)
Figure 15 Market By Industry (2017�2022)
Figure 16 Increasing Volume and Variety of Cognitive Computing Data are the Major Factors Contributing to the Growth of the Cognitive Analytics Market
Figure 17 North America is Estimated to Have the Largest Market Share in 2017
Figure 18 Healthcare and Life Sciences Industry, and North America are Estimated to Have the Largest Market Size in 2017
Figure 19 Support and Maintenance Segment is Estimated to Have the Largest Market Across the Globe, Except in APAC, in 2017
Figure 20 Cognitive Analytics Market: Drivers, Restraints, Opportunities, and Challenges
Figure 21 Customer Analysis and Personalization Application is Expected to Have the Largest Market Size During the Forecast Period
Figure 22 Tools Segment is Expected to Have the Larger Market Size During the Forecast Period
Figure 23 Professional Services Segment is Expected to Have the Larger Market Size During the Forecast Period
Figure 24 Deployment and Integration Segment is Expected to Grow at the Highest CAGR During the Forecast Period
Figure 25 On-Demand Deployment Model is Expected to Grow at A Higher CAGR During the Forecast Period
Figure 26 Small and Medium-Sized Enterprise Segment is Expected to Have A Higher CAGR During the Forecast Period
Figure 27 Transportation and Logistics Industry is Expected to Have the Highest CAGR During the Forecast Period
Figure 28 Asia Pacific is Expected to Grow at the Highest CAGR During the Forecast Period
Figure 29 North America is Expected to Have the Largest Market Size During the Forecast Period
Figure 30 North America: Market Snapshot
Figure 31 Asia Pacific: Market Snapshot
Figure 32 IBM: Company Snapshot
Figure 33 Microsoft: Company Snapshot
Figure 34 Oracle: Company Snapshot
Figure 35 SAS Institute: Company Snapshot
Figure 36 Intel: Company Snapshot
Figure 37 Cisco Systems: Company Snapshot
Figure 38 Nokia: Company Snapshot
Figure 39 HPE: Company Snapshot
Figure 40 Nuance Communications: Company Snapshot


Growth opportunities and latent adjacency in Cognitive Analytics Market