
Carbonated Beverage Processing Equipment Market by Equipment Type (Sugar Dissolvers, Carbonation Equipment, Blenders & Mixers, Heat Exchangers), Beverage Type (Flavored Drinks, Functional Drinks, Club Soda), and Region - Global Forecast to 2022
Market Segmentation
| Report Metrics | Details |
|
Market size available for years |
2017 - 2022 |
|
CAGR % |
5.8 |
Top 10 companies in Carbonated Beverage Processing Equipment Market


[138 Pages Report] The carbonated beverage processing equipment market, in terms of value, is projected to reach USD 7.23 Billion by 2022, at a CAGR of 5.8% from 2017 to 2022. Carbonated soft drinks include sparkling water, energy drinks, flavored drinks, malt-based drinks, and fruit-based drinks. The diversity of these products is the result of various techniques developed in the industry for processing. This has attributed to the growth of the market. The market players are responding to these new opportunities by expanding their global presence and product lines.
The market is segmented on the basis of type, beverage type, and region. The years considered for the study are as follows:
- Base Year � 2016
- Estimated Year � 2017
- Projected Year � 2022
- Forecast Period � 2017 to 2022
This report includes estimations of market sizes for value (USD million). Both, top-down and bottom-up approaches have been used to estimate and validate the size of the carbonated beverage processing equipment market and to estimate the size of various other dependent submarkets in the overall market. Key players in the market have been identified through secondary research through various sources such as Food and Agriculture Organization (FAO), U.S. Food and Drug Administration (FDA), World Health Organization (WHO), International Food Information Council Foundation (IFICF), European Food and Drink Industry 2015-2016, and their market share in respective regions have been determined through primary and secondary research. All percentage shares, splits, and breakdowns have been determined using secondary sources and were verified through primary sources.
To know about the assumptions considered for the study, download the pdf brochure
The carbonated beverage processing equipment ecosystem comprises equipment manufacturers such as Tetra Laval Group (Switzerland), GEA Group Aktiengesellschaft (Germany), Alfa Laval AB (Sweden), Krones AG (Germany), SPX Flow Inc. (U.S.), and KHS GmbH (Germany) as a major players. The other players in the market include A Due Di Squeri Donato & Cspa (Italy), Van Der Molen GmbH AG (Germany), and Seppelec SL (Spain), which also have a significant presence in this market.
Target Audience:
- Suppliers
- R&D institutes
- Technology providers
- Carbonated beverage processing equipment manufacturers/suppliers
- Carbonated beverage manufacturers/suppliers/processors
- Intermediary suppliers
- Wholesalers
- Dealers
- Consumers
- End users
- Retailers
�The study answers several questions for stakeholders, primarily which market segments to focus on in the next two to five years for prioritizing efforts and investments.�
Get online access to the report on the World's First Market Intelligence Cloud
Request Sample Scope of the Report

Based on Equipment Type, the market has been segmented as follows:
- Sugar dissolvers
- Carbonation equipment
- Blenders & mixers
- Heat exchangers
- Silos
- Filtration equipment
Based on Beverage Type, the Carbonated Beverage Processing Equipment Market has been segmented as follows:
- Flavored drinks
- Functional drinks
- Club soda & sparkling water
Based on Region, the market has been segmented as follows:
- North America
- Europe
- Asia-Pacific
- RoW (South America and Middle East & Africa)
Available Customizations
With the given market data, MarketsandMarkets offers customizations according to client-specific scientific needs.
The following customization options are available for the report:
Segmental Analysis
- Segmental analysis, which provides further breakdown of the flavored drinks, health drinks, and soda in the application segment.
Geographic Analysis
- Further breakdown of the Rest of Asia-Pacific carbonated beverage processing equipment market, by country
- Further breakdown of other countries in the Rest of the World market, by key country
Company Information
- Detailed analyses and profiling of additional market players (up to five)
The carbonated beverage processing equipment market has grown exponentially in the last few years. The market size is projected to reach USD 7.23 Billion by 2022, at a CAGR of around 5.8% from 2017 to 2022. Emerging countries such as India, China, Brazil, and Argentina are the primary targets of the industry. Factors such as increasing demand for functional drinks, emergence of new technologies and upgradation of equipment & machinery are the major driving factors for this market. Moreover, advanced technologies and automation helped to drive the carbonated beverage processing industry.
The global market, based on type, is segmented into sugar dissolvers, carbonation equipment, blenders & mixers, heat exchangers, silos, and filtration equipment. Sugar dissolvers accounted the largest market share in 2016 whereas heat exchangers is projected to grow at the highest CAGR during the forecast period due to the increased demand for functional drinks. Sugar dissolving and treatment is one of the important and critical stages in carbonated soft drink processing. This is followed by heat exchangers which plays a critical role in the heating and cooling of fluids during the process.
The global market, based on beverage type, is segmented into flavored drinks, functional drinks, and club soda & sparkling water. Flavored drinks accounted for the largest share of the carbonated beverage processing equipment market in 2016. The functional drinks market is projected to grow at the highest CAGR from 2017 to 2022. The rise in demand for functional drinks which have essential micronutrients and consumers� inclination toward health-based drinks will lead to the growth of functional drinks over the next five years.
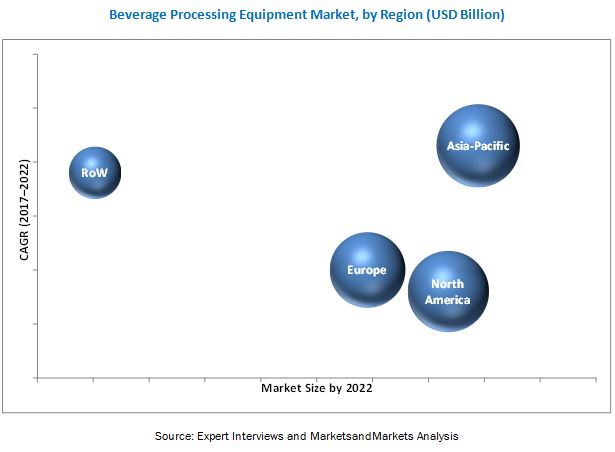
The carbonated beverage processing equipment market was dominated by the North American region in 2016. The Asia-Pacific region is projected to be the fastest-growing market during the forecast period due to the establishments by key players in the carbonated soft drink processing industry such as The Coca-Cola Company (U.S.) and PepsiCo Inc. (U.S.), . In terms of beverage type, the flavored drinks segment was the largest market and the functional drinks market is projected to be the fastest-growing market for carbonated beverage processing equipment from 2017 to 2022. Due to health concerns, functional drinks category is gaining popularity.
Carbonated beverage processing manufacturers require high capital investments to install processing equipment. Due to this reason, high capital investments is restraining the market growth.
The carbonated beverage processing equipment market is characterized by moderate competition due to the presence of a large number of both large- and small-scale firms. Acquisitions, expansions, new product and technology launches, and agreements & mergers are the key strategies adopted by market players to ensure their growth in the market. The market is dominated by players such as Tetra Laval Group (Switzerland), GEA Group Aktiengesellschaft (Germany), Alfa Laval AB (Sweden), Krones AG (Germany), SPX Flow Inc. (U.S.), and KHS GmbH (Germany). Other major players in the market are A Due Di Squeri Donato & Cspa (Italy), Van Der Molen GmbH AG (Germany), Seppelec SL (Spain), A. Water Systems s.r.l. (Italy), and TCP Pioneer Co. Ltd (Taiwan).
To speak to our analyst for a discussion on the above findings, click Speak to Analyst
Table of Contents
1 Introduction (Page No. - 13)
1.1 Objectives of the Study
1.2 Market Definition
1.3 Market Scope
1.4 Periodization Considered for the Study
1.5 Currency Considered
1.6 Stakeholders
1.7 Limitations
2 Research Methodology (Page No. - 17)
2.1 Research Data
2.1.1 Secondary Data
2.1.2 Primary Data
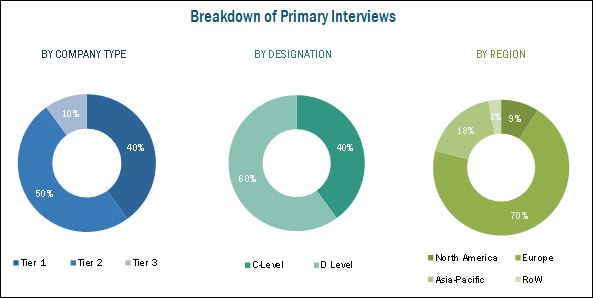
2.1.2.1 Breakdown of Primaries
2.2 Market Size Estimation
2.3 Market Breakdown & Data Triangulation
2.4 Research Assumptions
3 Executive Summary (Page No. - 23)
4 Premium Insights (Page No. - 27)
4.1 Opportunities in this Market
4.2 Carbonated Beverage Processing Equipment Market: Key Countries
4.3 Market, By Beverage Type and Region
4.4 Developed vs Developing Markets for Carbonated Beverage Processing Equipment
4.5 Market, By Type & Region
5 Market Overview (Page No. - 30)
5.1 Introduction
5.2 End User Industry Trends
5.3 Value Chain
5.4 Supply Chain
5.5 Market Dynamics
5.5.1 Drivers
5.5.1.1 Upgradation of Existing Technologies
5.5.1.1.1 Demand for Multifunctional Equipment
5.5.1.1.2 Demand for Equipment With Optimum Output
5.5.1.2 Influence of Advertisements on Consumers
5.5.1.3 Growth in End User Application
5.5.1.3.1 Increase in Demand for Carbonated Functional Drinks
5.5.1.3.2 Enhanced Flavor and Shelf Life Due to Carbonation
5.5.2 Restraints
5.5.2.1 High Capital Investment
5.5.3 Opportunities
5.5.3.1 Technological Developments to Meet the Innovative Product Portfolio
5.5.3.1.1 Sugar Dissolvers
5.5.3.1.2 Heat Exchangers
5.5.3.2 Technological Innovation With the Objective of Energy Conservation
5.5.3.3 Growth in Demand for Carbonated Soft Drinks in Emerging Countries
5.5.3.4 Beverage Processors� Demand for After-Sales Services to Enhance Operational Efficiency
5.5.4 Challenges
5.5.4.1 Heavy Duty Tax on Sugary Drinks
5.5.4.2 Increase in Costs of Energy and Power
6 Carbonated Beverage Processing Equipment Market, By Type (Page No. - 43)
6.1 Introduction
6.2 Sugar Dissolvers
6.3 Carbonation Equipment
6.4 Blenders & Mixers
6.5 Heat Exchangers
6.6 Silos
6.7 Filtration Equipment
7 Carbonated Beverage Processing Equipment Market, By Beverage Type (Page No. - 53)
7.1 Introduction
7.2 Flavored Drinks
7.3 Functional Drinks
7.4 Club Soda & Sparkling Water
8 Market, By Region (Page No. - 61)
8.1 Introduction
8.2 North America
8.2.1 U.S.
8.2.1.1 U.S. Food and Drug Administration: Regulatory Requirements for Carbonated Soft Drinks
8.2.2 Canada
8.2.3 Mexico
8.3 Europe
8.3.1 Germany
8.3.2 France
8.3.3 Italy
8.3.4 Spain
8.3.5 U.K.
8.3.6 Rest of Europe
8.4 Asia-Pacific
8.4.1 China
8.4.2 India
8.4.3 Japan
8.4.4 Rest of Asia-Pacific
8.5 RoW
8.5.1 South America
8.5.2 Middle East
8.5.3 Others in RoW
9 Competitive Landscape (Page No. - 92)
9.1 Overview
9.1.1 Key Market Strategies
9.1.2 Competitive Situation and Trends
9.1.3 New Product and Technology Launches
9.1.4 Agreements and Mergers
9.1.5 Expansions
9.1.6 Acquisitions
10 Company Profiles (Page No. - 97)
10.1 Introduction
(Overview, Financials, Products & Services, Strategy, and Developments)*
10.2 Tetra Laval Group
10.3 GEA Group Aktiengesellschaft
10.4 Alfa Laval AB
10.5 Krones AG
10.6 SPX Flow Inc.
10.7 KHS GmbH
10.8 Statco Engineering & Fabricators Inc.
10.9 A Due Di Squeri Donato & CSPA
10.10 Van Der Molen GmbH
10.11 Seppelec Sl
10.12 A. Water Systems S.R.L.
10.13 TCP Pioneer Co. Ltd
*Details on Overview, Financials, Product & Services, Strategy, and Developments Might Not Be Captured in Case of Unlisted Companies.
11 Appendix (Page No. - 127)
11.1 More Company Developments
11.1.1 New Product and Technology Launches
11.1.2 Expansions
11.1.3 Acquisitions
11.2 Discussion Guide
11.3 Knowledge Store: Marketsandmarkets� Subscription Portal
11.4 Introducing RT: Real Time Market Intelligence
11.5 Available Customizations
11.6 Related Reports
11.7 Author Details
List of Tables (84 Tables)
Table 1 End User Industry Trends
Table 2 Global Top 12 Soft Drink Brands, 2015
Table 3 Leading End-Use Industry Developments (2015�2017)
Table 4 Global Top 7 Soft Drink Brands and Their Average Sugar Content, 2015
Table 5 Carbonated Beverage Processing Equipment Market Size, By Type, 2015-2022 (USD Million)
Table 6 North America: By Market Size, By Type, 2015-2022 (USD Million)
Table 7 Europe: Market Size, By Type, 2015-2022 (USD Million)
Table 8 Asia Pacific: By Market Size, By Type, 2015-2022 (USD Million)
Table 9 RoW: Market Size, By Type, 2015-2022 (USD Million)
Table 10 Sugar Dissolvers Market Size, By Region, 2015-2022 (USD Million)
Table 11 Carbonation Equipment Market Size, By Region, 2015-2022 (USD Million)
Table 12 Blenders & Mixers Market Size, By Region, 2015-2022 (USD Million)
Table 13 Heat Exchangers Market Size, By Region, 2015-2022 (USD Million)
Table 14 Silos Market Size, By Region, 2015-2022 (USD Million)
Table 15 Applications of Some Major Filtration Equipment
Table 16 Filtration Equipment Market Size, By Region, 2015-2022 (USD Million)
Table 17 Carbonated Beverage Processing Equipment Market Size, By Beverage Type, 2015-2022 (USD Million)
Table 18 North America: By Market Size, By Beverage Type, 2015-2022 (USD Million)
Table 19 Europe: Market Size, By Beverage Type, 2015-2022 (USD Million)
Table 20 Asia Pacific: By Market Size, By Beverage Type, 2015-2022 (USD Million)
Table 21 RoW: Market Size, By Beverage Type, 2015-2022 (USD Million)
Table 22 Flavored Market Size, By Region, 2015-2022 (USD Million)
Table 23 Functional Market Size, By Region, 2015-2022 (USD Million)
Table 24 Club Soda & Sparkling Water Processing Equipment Market Size, By Region, 2015-2022 (USD Million)
Table 25 By Market Size, By Region, 2015�2022 (USD Million)
Table 26 North America: By Market Size, By Country, 2015�2022 (USD Million)
Table 27 North America: Flavored Carbonated Beverage Processing Equipment Market Size, By Country, 2015�2022 (USD Million)
Table 28 U.S.: By Market Size, By Type, 2015�2022 (USD Million)
Table 29 U.S.: Market Size, By Beverage Type, 2015�2022 (USD Million)
Table 30 Canada: Market Size, By Type, 2015�2022 (USD Million)
Table 31 Canada: Market Size, By Beverage Type, 2015�2022 (USD Million)
Table 32 Mexico: Market Size, By Type, 2015�2022 (USD Million)
Table 33 Mexico: Market Size, By Beverage Type, 2015�2022 (USD Million)
Table 34 Europe: Market Size, By Country, 2015�2022 (USD Million)
Table 35 Europe: Market Size, By Country, 2015�2022 (USD Million)
Table 36 Germany: Market Size, By Type, 2015�2022 (USD Million)
Table 37 Germany: Market Size, By Beverage Type, 2015�2022 (USD Million)
Table 38 France: Carbonated Beverage Processing Equipment Market Size, By Type, 2015�2022 (USD Million)
Table 39 France: Market Size, By Beverage Type, 2015�2022 (USD Million)
Table 40 Italy: Market Size, By Type, 2015�2022 (USD Million)
Table 41 Italy: Market Size, By Beverage Type, 2015�2022 (USD Million)
Table 42 Spain: Market Size, By Type, 2015�2022 (USD Million)
Table 43 Spain: Market Size, By Beverage Type, 2015�2022 (USD Million)
Table 44 U.K.: Market Size, By Type, 2015�2022 (USD Million)
Table 45 U.K.: Market Size, By Beverage Type, 2015�2022 (USD Million)
Table 46 Rest of Europe: Market Size, By Type, 2015�2022 (USD Million)
Table 47 Rest of Europe: Market Size, By Beverage Type, 2015�2022 (USD Million)
Table 48 Asia-Pacific: Market Size, By Country, 2015�2022 (USD Million)
Table 49 Asia-Pacific: Flavored Carbonated Beverage Processing Equipment Market Size, By Country, 2015�2022 (USD Million)
Table 50 China: Market Size, By Type, 2015�2022 (USD Million)
Table 51 China: Market Size, By Beverage Type, 2015�2022 (USD Million)
Table 52 India: Market Size, By Type, 2015�2022 (USD Million)
Table 53 India: Market Size, By Beverage Type, 2015�2022 (USD Million)
Table 54 Japan: Market Size, By Type, 2015�2022 (USD Million)
Table 55 Japan: Market Size, By Beverage Type, 2015�2022 (USD Million)
Table 56 Rest of Asia-Pacific: Market Size, By Type, 2015�2022 (USD Million)
Table 57 Rest of Asia-Pacific: Market Size, By Beverage Type, 2015�2022 (USD Million)
Table 58 RoW: Market Size, By Country, 2015�2022 (USD Million)
Table 59 RoW: Flavored Carbonated Beverage Processing Equipment Market Size, By Country, 2015�2022 (USD Million)
Table 60 South America: Market Size, By Type, 2015�2022 (USD Million)
Table 61 South America: Market Size, By Beverage Type, 2015�2022 (USD Million)
Table 62 The Middle East: Market Size, By Type, 2015�2022 (USD Million)
Table 63 Middle East: Market Size, By Beverage Type, 2015�2022 (USD Million)
Table 64 Others in RoW: Carbonated Beverage Processing Equipment Market Size, By Type, 2015�2022 (USD Million)
Table 65 Others in RoW: Market Size, By Beverage Type, 2015�2022 (USD Million)
Table 66 New Product and Technology Launches, 2016
Table 67 Agreements and Mergers, 2016�2017
Table 68 Expansions, 2015�2017
Table 69 Acquisitions, 2015�2016
Table 70 Tetra Laval Group: Products
Table 71 GEA Group Aktiengesellschaft: Products
Table 72 Alfa Laval AB: Products
Table 73 Krones AG: Products
Table 74 SPX Flow Inc.: Products
Table 75 KHS GmbH: Products
Table 76 Statco Engineering & Fabricators Inc.: Products
Table 77 A Due Di Squeri Donato & CSPA: Products
Table 78 Van Der Molen GmbH: Products
Table 79 Seppelec Sl: Products
Table 80 A. Water Systems S.R.L.: Products
Table 81 TCP Pioneer Co. Ltd: Products
Table 82 New Product and Technology Launches, 2012�2016
Table 83 Expansions, 2011�2016
Table 84 Acquisitions, 2011�2016
List of Figures (58 Figures)
Figure 1 Market Segmentation
Figure 2 Research Design: Carbonated Beverage Processing Equipment Market
Figure 3 Breakdown of Primaries: By Company Type, Designation, and Region
Figure 4 Market Size Estimation Methodology: Bottom-Up Approach
Figure 5 Market Size Estimation Methodology: Top-Down Approach
Figure 6 Data Triangulation Methodology
Figure 7 Carbonated Beverage Processing Equipment Market Snapshot, By Type, 2017 vs 2022
Figure 8 Asia-Pacific is the Fastest Growing Region for Market, 2017�2022
Figure 9 Market Size, By Beverage Type, 2017�2022
Figure 10 Market Share (Value), By Region, 2016
Figure 11 Requirement of Advanced and Multifunctional Equipment Would Drive the Growth of the Market
Figure 12 China is Projected to Be the Fastest-Growing Market During the Forecast Period
Figure 13 Flavored Drink Segment is Projected to Dominate the Market in 2016
Figure 14 Developing Countries Projected to Emerge at Relatively Higher Growth Rates During the Forecast Period
Figure 15 North America Dominated the Market Across All Types in 2016
Figure 16 Carbonated Beverage Processing Equipment in the European Region in 2016
Figure 17 Carbonated Soft Drinks are the Third-Largest Packaged Beverages in Terms of Global Consumption, 2015 (Billion Liter)
Figure 18 End User Market Share Analysis, 2015
Figure 19 Market Dynamics: Carbonated Beverage Processing Equipment Market
Figure 20 Soft Drinks: the Most Innovative Food Sector in Europe, 2014
Figure 21 Advertising Spending of Top Five Brands, 2010
Figure 22 Electric Energy Consumption at Various Processing Levels in Carbonated Beverage Manufacturing Plants
Figure 23 Carbonated Beverage Processing Equipment Market Size, By Type, 2015-2022 (USD Million)
Figure 24 Sugar Dissolvers Market Size, By Region, 2015-2022 (USD Million)
Figure 25 Market Size, By Beverage Type, 2015-2022 (USD Million)
Figure 26 Flavored Carbonated Beverage Processing Equipment Market Size, By Region, 2015-2022 (USD Million)
Figure 27 Per Capita Consumption of Soft Drinks in the Top 20 Countries, 2014 (Liters)
Figure 28 U.S. Held the Largest Share in the Market in 2016
Figure 29 Mexico is Projected to Witness the Highest Growth in the North American Carbonated Beverage Equipment Market From 2017 to 2022
Figure 30 Per Capita Consumption of Soft Drinks in the U.S., 2010�2015 (Gallons)
Figure 31 Per Capita Consumption of Soft Drinks in the Mexico., 2010�2015 (Gallons)
Figure 32 Germany Dominated the Market in Europe (USD Million)
Figure 33 Per Capita Consumption of Soft Drinks in Germany From 2010 to 2015 (Liters)
Figure 34 Per Capita Consumption of Soft Drinks in Italy From 2010 to 2015 (Liters)
Figure 35 Per Capita Consumption of Soft Drinks in Spain From 2010 to 2015 (Liters)
Figure 36 Per Capita Consumption of Soft Drinks in the U.K. From 2010 to 2015 (Liters)
Figure 37 Calorie-Wise Split of Carbonated Soft Drink Share in the U.K., 2014
Figure 38 Per Capita Consumption of Soft Drinks in Austria From 2010 to 2015 (Liters)
Figure 39 China is Projected to Witness the Fastest Growth From 2017 to 2022 (USD Million)
Figure 40 New Product & Technology Launches: Leading Approach of Key Companies
Figure 41 Carbonated Beverage Processing Equipment Market Developments, By Growth Strategy, 2011�2017
Figure 42 Market Growth Strategies, By Company, 2011�2017
Figure 43 Geographical Revenue Mix of Top Four Market Players
Figure 44 Tetra Laval Group: Company Snapshot
Figure 45 Tetra Laval Group: SWOT Analysis
Figure 46 GEA Group Aktiengesellschaft: Company Snapshot
Figure 47 GEA Group Aktiengesellschaft: SWOT Analysis
Figure 48 Alfa Laval AB: Company Snapshot
Figure 49 Alfa Laval AB: SWOT Analysis
Figure 50 Krones AG: Company Snapshot
Figure 51 Krones AG: SWOT Analysis
Figure 52 SPX Flow Inc.: Company Snapshot
Figure 53 SPX Flow Inc.: SWOT Analysis
Figure 54 KHS GmbH: Company Snapshot
Figure 55 KHS GmbH: SWOT Analysis
Figure 56 A Due Di Squeri Donato & CSPA: Company Snapshot
Figure 57 Seppelec Sl: Company Snapshot
Figure 58 A. Water Systems S.R.L.: Company Snapshot


Growth opportunities and latent adjacency in Carbonated Beverage Processing Equipment Market