 Email
Email Print
Print


Plant Growth Regulators Market - Forecast(2024 - 2030)
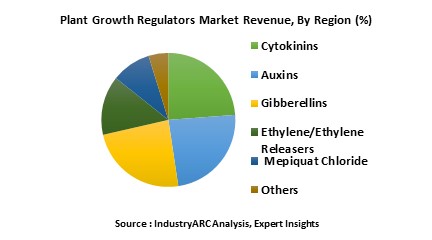
Global Plant growth regulator market is valued $1,550 million in the year 2017 and is expected to grow at a CAGR of 4.6% from 2018 to 2023. The market is growing steadily due to wide adoption of ethylene across groups. Cytokinins is having the highest market share in the year 2017 and is followed by Ethylene which is valued $448.5 million and $386.2 million respectively in the year 2017 and is anticipated to grow with a CAGR of 4.6% and 5.9% from the year 2018 to 2023.
What is plant growth regulator?
Plant growth regulators are the synthetic or natural chemicals that are responsible in controlling the growth and development of the plant. Natural plant growth regulators are produced with in specific parts of plants in minimal qualities and migrate to other parts, manipulating several physiological functions to regulate the plant’s growth such as promoting plant cell division and cell expansion, leaf expansion, retarding senescence of the leaves, ripening of fruits & vegetables, fruit & flower maturation, and seed germination. The major types of plant growth regulators are cytokinins, auxins, gibberellins, ethylene and abscisic acid.
What are the major applications for Plant growth regulator?
The various end users assessed include fruits & vegetables, turf & ornamental, cereals & grains, oil & seeds, and others. The major fruits that utilize PGR are apples, banana, grapes, mango, litchi, water melon, pine apple, kiwi and others. Vegetables like cucumber, lettuce, spinach, cabbage, pumpkin and others use these plant growth regulators. The main objective for the application of PGR in fruits and vegetables is to support their ripening. This is achieved by ethylene which is also called as ripening hormone.
The turf and ornamentals segments comprises of turf grass, nursery plants, ornamental plants, ornamental flowers, woody ornamentals, bedding plants, green house plants and others. In lawn and turf grass management, PGRs have applications in initiating and maintaining turf growth, preventing change in the color of the grass during conditions of cold stress, reducing mowing frequency, increasing plant thickness and limiting vegetative growth there by improving the quality of turf.
Market Research and Market Trends of Plant Growth Regulators Market
- RIO, which is developed from natural plant sources, boosts natural plant hormone activity and allows plants to develop more effectively. Environmental Protection Agency has recently approved this bio stimulant from Arysta Life Science, North America which activates endogenous natural plant hormone activity for enhanced plant reproductive growth.
- Companies into the manufacturing of PGRs are continuously looking for versatile solutions. One such versatile plant growth regulator is Ethrel. It improves coloration and accelerates uniform ripening of fruits. Moreover it can also applicable for specific uses that include defoliation in pomegranate and breaking alternate bearing in mango, etc.
Who are the Major Players in Plant growth regulators Market?
The companies referred in the market research report include the BASF, DOW Chemical, FMC Corporation, Nufarm, Syngenta and others.
What is our report scope?
The report incorporates in-depth assessment of the competitive landscape, product market sizing, product benchmarking, market trends, product developments, financial analysis, strategic analysis and so on to gauge the impact forces and potential opportunities of the market. Apart from this the report also includes a study of major developments in the market such as product launches, agreements, acquisitions, collaborations, mergers and so on to comprehend the prevailing market dynamics at present and its impact during the forecast period 2018-2023.
All our reports are customizable to your company needs to a certain extent, we do provide 20 free consulting hours along with purchase of each report, and this will allow you to request any additional data to customize the report to your needs.
Key Takeaways from this Report
- Evaluate market potential through analyzing growth rates (CAGR %), Volume (Units) and Value ($M) data given at country level – for product types, end use applications and by different industry verticals.
- Understand the different dynamics influencing the market – key driving factors, challenges and hidden opportunities.
- Get in-depth insights on your competitor performance – market shares, strategies, financial benchmarking, product benchmarking, SWOT and more.
- Analyze the sales and distribution channels across key geographies to improve top-line revenues.
- Understand the industry supply chain with a deep-dive on the value augmentation at each step, in order to optimize value and bring efficiencies in your processes.
- Get a quick outlook on the market entropy – M&A’s, deals, partnerships, product launches of all key players for the past 4 years.
- Evaluate the supply-demand gaps, import-export statistics and regulatory landscape for more than top 20 countries globally for the market.
1. Plant Growth Regulators Market Overview
2. Executive Summary
3. Plant Growth Regulators Market Landscape
3.1. Market Share Analysis
3.2. Comparative Analysis
3.2.1. Product Benchmarking
3.2.2. End User profiling
3.2.3. Patent Analysis
3.2.4. Top 5 Financials Analysis
4. Plant Growth Regulators Market Forces
4.1. Market Drivers
4.2. Market Constraints
4.3. Market Challenges
4.4. Attractiveness of the Industry
4.4.1. Power of Suppliers
4.4.2. Power of Customers
4.4.3. Threat of New entrants
4.4.4. Threat of Substitution
4.4.5. Degree of Competition
5. Plant Growth Regulators Market – Strategic Analysis
5.1. Value Chain Analysis
5.2. Pricing Analysis
5.3. Opportunities Analysis
5.4. Product/Market Life Cycle Analysis
5.5. Suppliers and Distributors
6. Plant Growth Regulators Market – By Hormone Type
6.1. Introduction
6.2. Cytokinins
6.3. Auxins
6.4. Gibberellins
6.5. Ethylene
6.6. Abscisic acid
6.7. Vitamins
6.8. Others
7. Plant Growth Regulators Market – By Crop Type
7.1. Introduction
7.2. Fruits and vegetables
7.3. Turf and ornamentals
7.4. Cereals & grains
7.4.1. Wheat
7.4.2. Rice
7.4.3. Corn
7.4.4. Others
7.5. Oilseeds & pulses
7.5.1. Cotton seed
7.5.2. Soya bean
7.5.3. Sunflower
7.5.4. Others
7.6. Others
8. Plant Growth Regulators Market – By Formulation
8.1. Water-Dispersible & water soluble
8.2. Wettable powders
8.3. Solutions
9. Plant Growth Regulators Market – By Function
9.1. Introduction
9.2. Plant growth Promoters
9.3. Plant growth Inhibitors
10. 1. Plant Growth Regulators Market - By Geography
10.1. Introduction
10.2. North America
10.2.1. U.S.
10.2.2. Canada
10.2.3. Mexico
10.3. South America
10.3.1. Brazil
10.3.2. Venezuela
10.3.3. Argentina
10.3.4. Ecuador
10.3.5. Peru
10.3.6. Colombia
10.3.7. Costa Rica
10.4. Europe
10.4.1. U.K
10.4.2. Germany
10.4.3. Italy
10.4.4. France
10.4.5. Netherlands
10.4.6. Belgium
10.4.7. Spain
10.4.8. Denmark
10.4.9. Rest of Europe
10.5. APAC
10.5.1. China
10.5.2. Australia
10.5.3. South Korea
10.5.4. India
10.5.5. Taiwan
10.5.6. Malaysia
10.5.7. Hong Kong
10.5.8. Rest of APAC
10.5.9. Middle East& Africa
10.5.10. Israel
10.5.11. South Africa
10.5.12. Saudi Arabia
10.6. Rest of Middle East and Africa
11. Market Entropy
11.1. New Product Launches
11.2. M&As, Collaborations, JVs, Partnership
12. Company Profiles (Overview, Financials, SWOT Analysis, Developments, Product Portfolio)
12.1. BASF
12.2. DOW Chemical
12.3. FMC Corporation
12.4. Nufarm
12.5. Syngenta
12.6. Company 6
12.7. Company 7
12.8. Company 8
12.9. Company 9
*More than 10 Companies are profiled in this Research Report*
"*Financials would be provided on a best efforts basis for private companies"
13. Appendix
13.1. Abbreviations
13.2. Sources
13.3. Research Methodology
13.4. Bibliography
13.5. Compilation of Expert Insights
13.6. Disclaimer
List of Tables:
Table 1. Product Benchmarking for Plant Growth Regulators Market, By Active Ingredients
Table 2. Global PGR Market Average Selling Price Analysis, By Type of System
Table 3. Global Market Revenue, By PGR Type, 2013 -2020 ($Million)
Table 4. Global Cytokinins Market Revenue, By Crop, 2013-2020 ($Million)
Table 5. Global Cytokinins Market Revenue, By Region, 2013-2020 ($Million)
Table 6. Global Auxins Market Revenue, By Crop, 2013-2020 ($Million)
Table 7. Global Auxins Market Revenue, By Region, 2013-2020 ($Million)
Table 8. Global Gibberellins Market Revenue, By Crop, 2013-2020 ($Million)
Table 9. Global Gibberellins Market Revenue, By Region, 2013-2020 ($Million)
Table 10. Global Ethylene/Ethylene Releasers Market Revenue, By Crop, 2013 -2020 ($Million)
Table 11. Global Ethylene/Ethylene Releasers Market Revenue, By Region, 2013-2020 ($Million)
Table 12. Global Mepiquat Chloride Market Revenue, By Crop, 2013-2020 ($Million)
Table 13. Global Mepiquat Chloride Market Revenue, By Region, 2013-2020 ($Million)
Table 14. Other PGRS Market Revenue, By Crop, 2013-2020 ($Million)
Table 15. Other PGRS Market Revenue, By Region, 2013-2020 ($Million)
Table 16. Global Market Revenue, By Crop Type, 2013 - 2020 ($Million)
Table 17. Global Row Crops PGR Market Revenue, By Type of PGR, 2013-2020 ($Million)
Table 18. Global Row Crops PGR Market Revenue, By Region, 2013-2020 ($Million)
Table 19. Global Fruits and Vegetables PGR Market Revenue, By Type of PGR, 2013-2020 ($Million)
Table 20. Global Fruits and Vegetables PGR Market Revenue, By Region, 2013-2020 ($Million)
Table 21. Global Turf and Ornamentals PGR Market Revenue, By Type of PGR, 2013-2020 ($Million)
Table 22. Global Turf and Ornamentals PGR Market Revenue, By Region, 2013-2020 ($Million)
Table 23. Global Other Crops PGR Market Revenue, By Type of PGR, 2013-2020 ($Million)
Table 24. Global Other Crops PGR Market Revenue, By Region, 2013-2020 ($Million)
Table 25. Global Market Revenue, By Region, 2013-2020 ($Million)
Table 26. Americas: Plant Growth Regulators Market Revenue, By Country, 2013-2020 ($Million)
Table 27. Americas: Market Revenue, By Crop Type, 2013-2020 ($Million)
Table 28. Americas: Market Revenue, By PGR Type, 2013-2020 ($Million)
Table 29. Americas: Row Crops Market Revenue, By PGR Type, 2013-2020 ($Million)
Table 30. Americas: Fruits and Vegetables Market Revenue, By PGR Type, 2013-2020 ($Million)
Table 31. Americas: Turf and Ornamentals Market Revenue, By PGR Type, 2013-2020 ($Million)
Table 32. Americas: Other Crops Market Revenue, By PGR Type, 2013-2020 ($Million)
Table 33. U.S.: PGR Market Revenue, By Crop Type, 2013-2020 ($Million)
Table 34. U.S. Market Revenue, By PGR Type, 2013-2020 ($Million)
Table 35. U.S.: Row Crops Market Revenue, By PGR Type, 2013-2020 ($Million)
Table 36. U.S.: Fruits and Vegetables Market Revenue, By PGR Type, 2013-2020 ($’000)
Table 37. U.S.: Turf and Ornamentals Market Revenue, By PGR Type, 2013-2020 ($’000)
Table 38. U.S.: Other Crops Market Revenue, By PGR Type, 2013-2020 ($’000)
Table 39. Brazil: PGR Market Revenue, By Crop, 2013-2020 ($Million)
Table 40. Brazil: Plant Growth Regulators Market Revenue, By PGR Type, 2013-2020 ($Million)
Table 41. Brazil: Row Crops Market Revenue, By PGR Type, 2013-2020 ($Million)
Table 42. Brazil: Fruits and Vegetables Market Revenue, By PGR Type, 2013-2020 ($’000)
Table 43. Brazil: Turf and Ornamentals Market Revenue, By PGR Type, 2013-2020 ($’000)
Table 44. Brazil: Other Crops Market Revenue, By PGR Type, 2013-2020 ($’000)
Table 45. Canada: PGR Market Revenue, By Crop Type, 2013-2020 ($’000)
Table 46. Canada: Plant Growth Regulators Market Revenue, By PGR Type, 2013-2020 ($’000)
Table 47. Canada: Row Crops Market Revenue, By PGR Type, 2013-2020 ($’000)
Table 48. Canada: Fruits and Vegetables Market Revenue, By PGR Type, 2013-2020 ($’000)
Table 49. Canada: Turf and Ornamentals Market Revenue, By PGR Type, 2013-2020 ($’000)
Table 50. Canada: Other Crops Market Revenue, By PGR Type, 2013-2020 ($’000)
Table 51. Americas: Others PGR Market Revenue, By Crop Type, 2013-2020 ($’000)
Table 52. Americas: Others Market Revenue, By PGR Type, 2013-2020 ($’000)
Table 53. Americas: Others Row Crops Market Revenue, By PGR Type, 2013-2020 ($’000)
Table 54. Americas: Others Fruits and Vegetables Market Revenue, By PGR Type, 2013-2020 ($’000)
Table 55. Americas: Other Turf and Ornamentals Market Revenue, By PGR Type, 2013-2020 ($’000)
Table 56. Americas: Others Other Crops Market Revenue, By PGR Type, 2013-2020 ($’000)
Table 57. Europe: PGR Market Revenue, By Country, 2013 -2020 ($Million)
Table 58. Europe: Plant Growth Regulators Market Revenue, By Crop Type, 2013 -2020 ($Million)
Table 59. Europe: Market Revenue, By PGR Type, 2013-2020 ($Million)
Table 60. Europe: Row Crops Market Revenue, By PGR Type, 2013-2020 ($Million)
Table 61. Europe: Fruits and Vegetables Market Revenue, By PGR Type, 2013-2020 ($Million)
Table 62. Europe: Turf and Ornamentals Market Revenue, By PGR Type, 2013-2020 ($’000)
Table 63. Europe: Other Crops Market Revenue, By PGR Type, 2013-2020 ($’000)
Table 64. Germany: PGR Market Revenue, By Crop, 2013-2020 ($Million)
Table 65. Germany: Market Revenue, By PGR Type, 2013-2020 ($Million)
Table 66. Germany: Row Crops Market Revenue, By PGR Type, 2013-2020 ($Million)
Table 67. Germany: Fruits and Vegetables Market Revenue, By PGR Type, 2013-2020 ($’000)
Table 68. Germany: Turf and Ornamentals Market Revenue, By PGR Type, 2013-2020 ($’000)
Table 69. Germany: Other Crops Market Revenue, By PGR Type, 2013-2020 ($’000)
Table 70. France: Plant Growth Regulators Market Revenue, By Crop Type, 2013-2020 ($Million)
Table 71. France: Market Revenue, By PGR Type, 2013-2020 ($Million)
Table 72. France: Row Crops Market Revenue, By PGR Type, 2013-2020 ($Million)
Table 73. France: Fruits and Vegetables Market Revenue, By PGR Type, 2013-2020 ($’000)
Table 74. France: Turf and Ornamentals Market Revenue, By PGR Type, 2013-2020 ($’000)
Table 75. France: Other Crops Market Revenue, By PGR Type, 2013-2020 ($’000)
Table 76. U.K.: Plant Growth Regulators Market Revenue, By Crop Type, 2013-2020 ($Million)
Table 77. U.K.: Market Revenue, By PGR Type, 2013-2020 ($Million)
Table 78. U.K.: Row Crops Market Revenue, By PGR Type, 2013-2020 ($Million)
Table 79. U.K.: Fruits and Vegetables Market Revenue, By PGR Type, 2013-2020 ($’000)
Table 80. U.K.: Turf and Ornamentals Market Revenue, By PGR Type, 2013-2020 ($’000)
Table 81. U.K.: Other Crops Market Revenue, By PGR Type, 2013-2020 ($’000)
Table 82. Poland Plant Growth Regulators Market Revenue, By Crop Type, 2013-2020 ($Million)
Table 83. Poland: Market Revenue, By PGR Type, 2013-2020 ($Million)
Table 84. Poland: Row Crops Market Revenue, By PGR Type, 2013-2020 ($Million)
Table 85. Poland: Fruits and Vegetables Market Revenue, By PGR Type, 2013-2020 ($’000)
Table 86. Poland: Turf and Ornamentals Market Revenue, By PGR Type, 2013-2020 ($’000)
Table 87. Poland: Other Crops Market Revenue, By PGR Type, 2013-2020 ($’000)
Table 88. Europe: Others Market Revenue, By Crop Type, 2013-2020 ($Million)
Table 89. Europe: Others Market Revenue, By PGR Type, 2013-2020 ($Million)
Table 90. Europe: Others Row Crops Market Revenue, By PGR Type, 2013-2020 ($Million)
Table 91. Europe: Others Fruits and Vegetables Market Revenue, By PGR Type, 2013-2020 ($’000)
Table 92. Europe: Others Turf and Ornamentals Market Revenue, By PGR Type, 2013-2020 ($’000)
Table 93. Europe: Others Other Crops Market Revenue, By PGR Type, 2013-2020 ($’000)
Table 94. APAC: Market Revenue, By Country, 2013-2020 ($Million)
Table 95. APAC: Market Revenue, By Crop Type, 2013-2020 ($Million)
Table 96. APAC: Market Revenue, By PGR Type, 2013-2020 ($Million)
Table 97. APAC: Row Crops Market Revenue, By PGR Type, 2013-2020 ($Million)
Table 98. APAC: Fruits and Vegetables Market Revenue, By PGR Type, 2013-2020 ($’000)
Table 99. APAC: Turf and Ornamentals Market Revenue, By PGR Type, 2013-2020 ($’000)
Table 100. APAC: Other Crops Market Revenue, By PGR Type, 2013-2020 ($’000)
Table 101. China: Market Revenue, By Crop Type, 2013-2020 ($Million)
Table 102. China: Market Revenue, By PGR Type, 2013-2020 ($Million)
Table 103. China: Row Crops Market Revenue, By PGR Type, 2013-2020 ($Million)
Table 104. China: Fruits and Vegetables Market Revenue, By PGR Type, 2013-2020 ($’000)
Table 105. China: Turf and Ornamentals Market Revenue, By PGR Type, 2013-2020 ($’000)
Table 106. China: Other Crops Market Revenue, By PGR Type, 2013-2020 ($’000)
Table 107. Japan: Market Revenue, By Crop Type, 2013-2020 ($’000)
Table 108. Japan: Market Revenue, By PGR Type, 2013-2020 ($’000)
Table 109. Japan: Row Crops Market Revenue, By PGR Type, 2013-2020 ($’000)
Table 110. Japan: Fruits and Vegetables Market Revenue, By PGR Type, 2013-2020 ($’000)
Table 111. Japan: Turf and Ornamentals Market Revenue, By PGR Type, 2013-2020 ($’000)
Table 112. Japan: Other Crops Market Revenue, By PGR Type, 2013-2020 ($’000)
Table 113. India: Market Revenue, By Crop Type, 2013-2020 ($Million)
Table 114. India: Market Revenue, By PGR Type, 2013-2020 ($Million)
Table 115. India: Row Crops Market Revenue, By PGR Type, 2013-2020 ($’000)
Table 116. India: Fruits and Vegetables Market Revenue, By PGR Type, 2013-2020 ($’000)
Table 117. India: Turf and Ornamentals Market Revenue, By PGR Type, 2013-2020 ($’000)
Table 118. India: Other Crops Market Revenue, By PGR Type, 2013-2020 ($’000)
Table 119. APAC: Others Market Revenue, By Crop, 2013-2020 ($Million)
Table 120. APAC: Others Market Revenue, By PGR Type, 2013-2020 ($Million)
Table 121. APAC: Others Row Crops Market Revenue, By PGR Type, 2013-2020 ($’000)
Table 122. APAC: Others Fruits and Vegetables Market Revenue, By PGR Type, 2013-2020 ($’000)
Table 123. APAC Others Turf and Ornamentals Market Revenue, By PGR Type, 2013-2020 ($’000)
Table 124. APAC: Others Other Crops Market Revenue, By PGR Type, 2013-2020 ($’000)
Table 125. Row: PGR Market Revenue, By Country, 2013-2020 ($Million)
Table 126. Row: Market Revenue, By Crop Type, 2013-2020 ($Million)
Table 127. Row: Market Revenue, By PGR Type, 2013-2020 ($Million)
Table 128. Row: Row Crops Market Revenue, By PGR Type, 2013 - 2020 ($Million)
Table 129. Row: Fruits and Vegetables Market Revenue, By PGR Type, 2013-2020 ($’000)
Table 130. Row: Turf and Ornamentals Market Revenue, By PGR Type, 2013-2020 ($’000)
Table 131. Row: Other Crops Market Revenue, By PGR Type, 2013-2020 ($’000)
Table 132. Africa: Market Revenue, By Crop Type, 2013-2020 ($’000)
Table 133. Africa: Market Revenue, By PGR Type, 2013-2020 ($’000)
Table 134. Africa: Row Crops Market Revenue, By PGR Type, 2013-2020 ($’000)
Table 135. Africa: Fruits and Vegetables Market Revenue, By PGR Type, 2013-2020 ($’000)
Table 136. Africa: Turf and Ornamentals Market Revenue, By PGR Type, 2013-2020 ($’000)
Table 137. Africa: Other Crops Market Revenue, By PGR Type, 2013-2020 ($’000)
Table 138. Middle East: Market Revenue, By Crop Type, 2013-2020 ($’000)
Table 139. Middle East: Market Revenue, By PGR Type, 2013-2020 ($’000)
Table 140. Middle East: Row Crops Market Revenue, By PGR Type, 2013-2020 ($’000)
Table 141. Middle East: Fruits and Vegetables Market Revenue, By PGR Type, 2013-2020 ($’000)
Table 142. Middle East Turf and Ornamentals Market Revenue, By PGR Type, 2013-2020 ($’000)
Table 143. Middle East Other Crops Market Revenue, By PGR Type, 2013-2020 ($’000)
Table 144. Basf Crop Protection Sales, By Region, 2012-2014 ($Million)
Table 145. Syngenta Sales, By Segment, 2012-2014 ($Billion)
Table 146. Syngenta Sales, By Region, 2012-2014 ($Billion)
Table 147. Syngenta Crop Protection Sales, By Type of Crop, 2013-2014 ($Million)
Table 148. Syngenta Crop Protection Sales, By Type of Chemical, 2013-2014($Million)
Table 149. Bayer Cropscience Sales, By Region, 2012-2014 ($Million)
Table 150. Bayer Cropscience Sales, By Segment, 2012-2014 ($Million)
Table 151. Nufarm Sales, By Segment, 2012-2014 ($Million)
Table 152. Nufarm Crop Protection Sales, By Region, 2012-2014 ($Million)
Table 153. Fmc Corporation Sales, By Segment, 2013-2014 ($Million)
Table 154. Fmc Corporation Sales, By Region, 2013-2014 ($Million)
Table 155. Sumitomo Chemical Company Sales, By Segment, 2014 ($Billion)
Table 156. Cheminova Total Sales, By Region, 2013 ($Million)
Table 157. American Vanguard Corporation Sales, By Segment, 2012-2014 ($Million)
Table 158. American Vanguard Corporation Sales, By Region, 2012-2014 ($Million)
Table 159. Chemtura Corporation Total Sales, By Segment, 2012-2014 ($Million)
Table 160. Chemtura Corporation Total Sales, By Geography, 2011-2013 ($Million)
Table 161. Adama Agricultural Solutions Total Sales, By Region, 2011-2013 ($Million)
List of Figures:
Figure 1. Global PGR Market Revenue, By Type of PGR, 2013 Vs 2020 ($Million)
Figure 2. Global Market, By Crop, 2014 (%)
Figure 3. Global Market, By Geography, 2014 (%)
Figure 4. Increasing World Population and Decreasing Arable Land Per Capita
Figure 5. Crop Protection Chemicals – Classification
Figure 6. Effect of Crop Protection on Crops
Figure 7. Plant Growth Regulators Market – Classification By Type
Figure 8. Plant Growth Regulators Market – Classification By Crop
Figure 9. Global Plant Growth Regulators - Market Share Analysis, 2014 (%)
Figure 10. Global Plant Growth Regulators Patent Analysis, By Type of Patent, 2012 -2104 (%)
Figure 11. Global Plant Growth Regulators Patent Analysis, By Country, 2012 – 2014 (%)
Figure 12. Global Cotton Production, 2010-2020 (Million Bales)
Figure 13. Demand of Major Food Crops, 2010-2020 (Million Metric Tonnes)
Figure 14. Arable Land Per Capita, 1960-2050 (Ha In Use Per Person)
Figure 15. Plant Growth Regulators - Value Chain Analysis
Figure 16. Global PGR Market Share, By Type, 2014 (%)
Figure 17. Global Market Share, By Crop Type, 2014 (%)
Figure 18. Global Plant Growth Regulators Market, By Geography, 2014 (%)
Figure 19. Americas PGR Market, By Country, 2014 (%)
Figure 20. European Market Share, By Country, 2014 (%)
Figure 21. APAC’s Market Share, By Country, 2014 (%)
Figure 22. Row PGR Market, By Country, 2014 (%)
Figure 23. Global Market Product Launches, By Year, 2010-2014
Figure 24. Global Market Product Launches, By Company, 2010-2014 (%)
Figure 25. Basf Sales, By Segment, 2014 (%)
Figure 26. Basf Agricultural Solutions Sales, 2012-2014 ($Million)
Figure 27. Basf Agricultural Solutions R&D Expenditure, 2012-2014 ($Million)
Figure 28. Syngenta: R&D Expenditure, 2012-2014 ($Billion)
Figure 29. Fmc Corporation Agricultural Solutions R&D Expenditure, 2012-2014 ($Million)
Figure 30. Cheminova Total Sales, By Year, 2012-2014 ($Million)
Figure 31. American Vanguard Corporation Total Sales, 2012-2014 ($Million)
Figure 32. Chemtura Corporation Total Sales, 2012-2014 ($Million)
Figure 33. Adama Agricultural Solutions Total Sales, 2011-2013 ($Billion)