Progressing Cavity Pump Market

Progressing Cavity Pump Market by Power Rating (Up To 50 Hp, 51–150 Hp, Above 150 Hp), Pumping Capacity, End-User (Oil & Gas, Water & Wastewater Treatment, Food & Beverage, Food Waste, Biogas, Battery Recycling) and Region - Global Forecast to 2029

Report Code: EP 6251 Apr, 2024, by marketsandmarkets.com

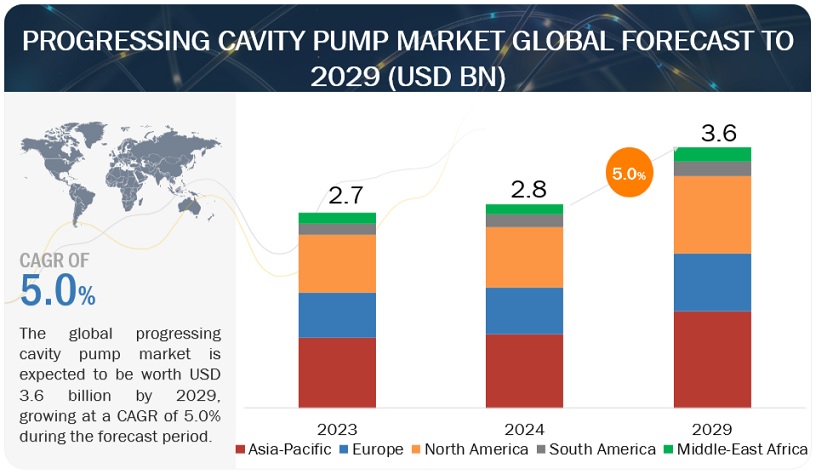
[273 Pages Report] The progressing cavity pump market is projected to witness steady growth with a compound annual growth rate (CAGR) of 5.0% throughout the forecast period, increasing from an estimated value of USD 2.8 billion in 2024 to reach USD 3.6 billion by 2029. The progressing cavity pump market is experiencing robust growth, propelled by increasing demand across diverse industries such as oil & gas, chemicals, wastewater treatment, and food & beverages. Factors driving this growth include the need for efficient fluid handling solutions, technological advancements enhancing pump performance and reliability, and rising investments in infrastructure development worldwide. Additionally, the market is benefiting from the expanding applications of progressing cavity pumps in emerging sectors such as pharmaceuticals, renewable energy, and mining. Moreover, the growing emphasis on sustainability and energy efficiency is fueling the adoption of eco-friendly pumping solutions, further stimulating market expansion. With ongoing innovation and strategic initiatives by key players, the market is poised for continued growth in the predictable future.
Progressing Cavity Pump Market

To know about the assumptions considered for the study, Request for Free Sample Report
Progressing Cavity Pump Market Opportunities

To know about the assumptions considered for the study, download the pdf brochure

Progressing Cavity Pump Market Dynamics

Driver: Growing demand from the water & wastewater treatment sector.

The growing demand from the water and wastewater treatment sector stems from several interconnected factors, including urbanization, population growth, and increasingly stringent environmental regulations worldwide. As urban populations continue to expand, the need for effective and sustainable water and wastewater management becomes paramount. Stricter environmental regulations further underscore the urgency for investment in water and wastewater treatment infrastructure to mitigate pollution and safeguard public health and the environment. The UN Water report on wastewater management highlights the need for $2 trillion annual investments in wastewater treatment infrastructure by 2030 to achieve Sustainable Development Goal 6 (SDG 6) on clean water and sanitation. This presents a significant opportunity for progressing cavity pumps in wastewater treatment plants.Progressing cavity pumps are particularly well-suited for addressing the diverse challenges encountered in water and wastewater treatment processes. Their versatility and robust design make them indispensable for various critical tasks within the sector. For instance, in sludge transfer applications, where the movement of thick, viscous substances is required, progressing cavity pumps excel due to their ability to handle high viscosity fluids effectively. Similarly, in dosing chemicals for water treatment purposes, these pumps offer precise metering capabilities, ensuring accurate and consistent dosing to achieve optimal treatment outcomes. Additionally, in applications involving the metering of liquids, such as the addition of disinfectants or pH adjustment agents, progressing cavity pumps provide reliable and efficient performance.

Restraints: Balancing Initial Investment Costs and Skilled Labor Constraints.

The high initial investment costs associated with progressing cavity pumps can indeed pose a significant barrier for potential buyers, particularly in industries where budgets are constrained, or capital expenditures are tightly regulated. Compared to some alternative pump technologies such as centrifugal pumps, which may have lower upfront costs, the initial purchase price of PCPs can be relatively higher due to factors such as the complexity of their design, the use of specialized materials, and the incorporation of advanced features like self-cleaning capabilities and digital monitoring systems. While the higher initial investment cost may deter some buyers, it's important to consider the total cost of ownership over the pump's lifecycle. Progressing cavity pumps often offer advantages such as longer service life, reduced maintenance requirements, and higher efficiency, which can result in lower operating costs and greater overall value for the investment. Additionally, advancements in manufacturing processes and economies of scale may lead to cost reductions over time, making PCPs more accessible to a broader range of customers. However, another challenge facing the widespread adoption of progressing cavity pumps is the availability of skilled labor for their installation, maintenance, and operation. These pumps require specialized knowledge and expertise to properly install, troubleshoot, and optimize, particularly in complex industrial environments or applications with demanding operating conditions. The shortage of skilled labor in certain regions or industries can pose a significant obstacle to the adoption of PCPs, as companies may struggle to find qualified personnel to manage their pumping systems effectively. This shortage can be exacerbated by factors such as an aging workforce, limited training and educational opportunities, and competition for talent from other sectors. To address this challenge, manufacturers and industry organizations may need to invest in training programs, certification courses, and knowledge-sharing initiatives to develop a pool of skilled professionals capable of supporting the widespread deployment of progressing cavity pumps. Collaboration between industry stakeholders, educational institutions, and government agencies can help to ensure that the necessary skills and expertise are available to meet the growing demand for PCP technology. Additionally, advancements in remote monitoring and predictive maintenance technologies can help to mitigate the impact of skill shortages by enabling more efficient troubleshooting and support processes, reducing the need for on-site expertise in some cases.

Opportunities:  Adoption of Industry 4.0 technologies.

Industry 4.0 refers to the integration of digital technologies like IoT, AI, and robotics into manufacturing, creating smart factories. It optimizes processes, boosts productivity, and enables customization through data-driven decision-making and automation. The integration of progressing cavity pumps with Industry 4.0 technologies presents a significant opportunity for pump manufacturers and users alike. By leveraging advancements in the Industrial Internet of Things (IIoT) and other Industry 4.0 innovations, such as data analytics and machine learning, pump systems can be transformed into smart, interconnected assets capable of delivering enhanced performance, reliability, and efficiency. One key opportunity lies in predictive maintenance enabled by IIoT integration. By equipping progressing cavity pumps with sensors and connectivity capabilities, manufacturers can collect real-time data on various parameters such as temperature, pressure, vibration, and fluid flow rates. This data can be analyzed using advanced algorithms to detect early signs of equipment degradation or potential failures, allowing for proactive maintenance interventions before critical issues arise. Predictive maintenance not only helps to prevent costly unplanned downtime but also extends the lifespan of pump components, optimizing asset utilization and reducing overall maintenance costs.

Challenges:Competition from traditional centrifugal pumps for lower-solids content wastewater applications

In the progressive cavity pump market, competition from traditional centrifugal pumps for lower-solids content wastewater applications poses a significant challenge. Centrifugal pumps have long been favored for applications involving fluids with lower solids content due to their simplicity, efficiency, and lower initial cost compared to progressive cavity pumps. One of the main reasons for the competition from centrifugal pumps is their ability to handle fluids with lower viscosity and fewer solids effectively. In wastewater applications where the solids content is relatively low, centrifugal pumps can provide sufficient pumping capacity at a lower cost, making them a preferred choice for many users. Additionally, centrifugal pumps are often easier to install and maintain, requiring less specialized knowledge for operation and upkeep compared to progressive cavity pumps. Another factor contributing to the competition is the perception that progressive cavity pumps are better suited for handling high-viscosity or high-solids content fluids. While progressive cavity pumps excel in these applications, advancements in centrifugal pump technology have enabled them to handle a wider range of fluid viscosities and solids content, narrowing the performance gap between the two types of pumps in certain applications.

Furthermore, cost considerations play a significant role in the decision-making process for many users. Centrifugal pumps typically have lower initial purchase costs compared to progressive cavity pumps, making them a more attractive option for budget-conscious buyers, especially in applications where the benefits of progressive cavity pumps, such as better solids handling capability, are not essential. To address this challenge, manufacturers of progressive cavity pumps must emphasize the unique advantages of their products, such as superior solids handling capability, gentle pumping action, and better performance in variable flow conditions. They may also need to focus on developing more cost-effective solutions, streamlining manufacturing processes, and offering competitive pricing to remain competitive in the market.


The Progressing Cavity Pump Market Ecosystem

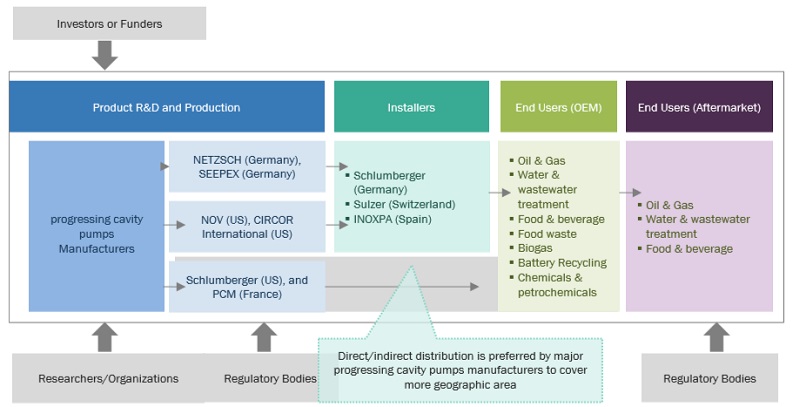
The progressing cavity pump market is characterized by the presence of well-established, financially stable companies with significant experience in producing progressing cavity pumps and related components. These companies are well-established in the market and offer a diverse range of products. Utilizing cutting-edge technologies, they uphold vast international networks for sales and marketing. Some of the leading companies in this market are NETZSCH (Germany), SEEPEX (Germany), NOV (US), CIRCOR International (US), Schlumberger (US), and PCM (France).
Progressing Cavity Pump  Market Ecosystem

Up to 50 HP segment, by power rating, to be fastest growing market from 2024 to 2029.

The up to 50 HP segment within the progressing cavity pump market is poised to emerge as the fastest-growing market from 2024 to 2029. This growth trajectory can be attributed to several factors, including the increasing adoption of compact and energy-efficient pumping solutions across various industries such as wastewater treatment, agriculture, and small-scale manufacturing. Additionally, the up to 50 HP segment caters to a wide range of applications where moderate power requirements are essential, aligning with the needs of both established industries and emerging sectors. Moreover, advancements in pump technology, coupled with a growing focus on sustainability and cost-effectiveness, are driving the demand for efficient pumping solutions within this power rating range. As a result, market players are expected to capitalize on this trend by offering innovative and reliable progressing cavity pumps tailored to the specific requirements of this segment, thereby driving its accelerated growth in the forecast period.

Water & Wastewater Treatment Segment, by end-use industry, to be the largest market from 2024 to 2029.

The Water & Wastewater Treatment segment is projected to emerge as the largest market within the progressing cavity pump industry from 2024 to 2029. This dominance can be attributed to escalating global concerns regarding water scarcity and pollution, driving significant investments in water infrastructure and treatment facilities worldwide. Progressing cavity pumps play a crucial role in various water and wastewater treatment processes, including pumping, dosing, and transferring fluids with high efficiency and reliability. Additionally, stringent environmental regulations mandating the use of advanced pumping solutions to ensure compliance further bolster the demand for progressing cavity pumps in this segment. As municipalities, industries, and governments continue to prioritize water management and sanitation, the Water & Wastewater Treatment segment is poised to sustain its leadership position in the progressing cavity pump market over the forecast period.

Up to 500 GPM, by pumping capacity, to have highest market share from 2024 to 2029.

In the progressing cavity pump market, the segment with pumping capacities of up to 500 gallons per minute (GPM) is anticipated to secure the highest market share between 2024 and 2029. This dominance can be attributed to several factors, including the widespread application of these pumps across various industries such as wastewater treatment, food processing, and oil & gas, where mid-range pumping capacities are often sufficient for operational needs. Additionally, technological advancements aimed at enhancing the efficiency, reliability, and versatility of pumps within this capacity range are driving their adoption among end-users. Furthermore, the increasing demand for compact, cost-effective pumping solutions in both established and emerging markets further contributes to the segment's market dominance during the forecast period.

Asia Pacific to account for largest market size during forecast period.

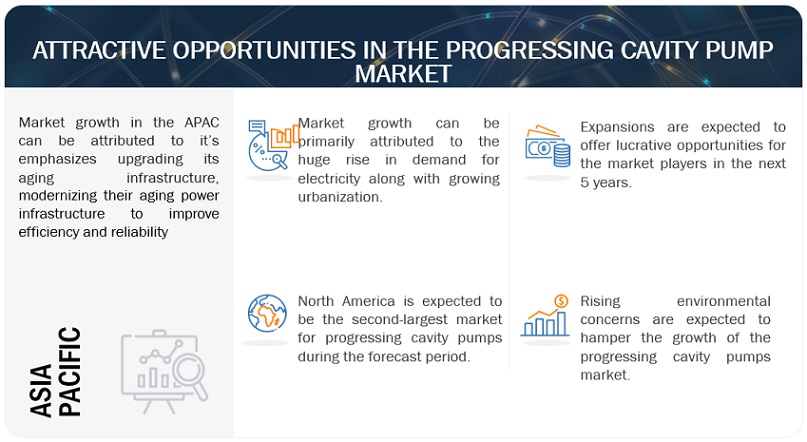
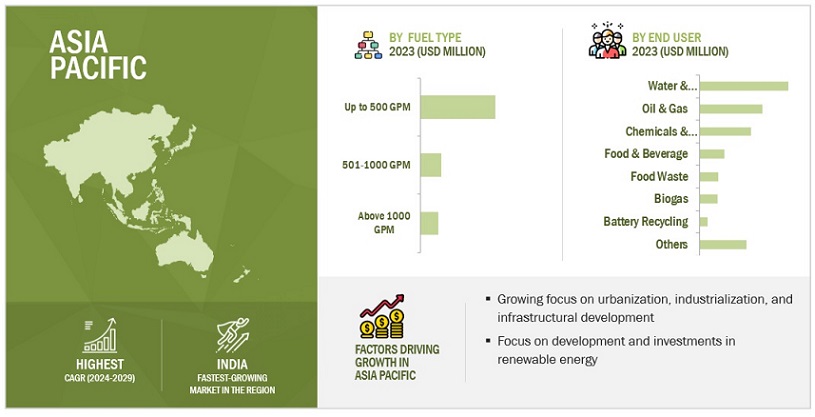
During the forecast period, the Asia Pacific region is poised to claim the largest market size in the progressing cavity pump sector. This dominance is attributed to several factors, including rapid industrialization, infrastructure development initiatives, and increasing investments in key sectors such as oil & gas, water & wastewater treatment, and food processing. Moreover, burgeoning populations and urbanization trends in countries like China, India, and Southeast Asian nations are driving the demand for efficient fluid handling solutions, thus propelling the market forward. Additionally, favorable government policies, coupled with rising awareness regarding energy efficiency and environmental sustainability, further augment the adoption of progressing cavity pumps across various industries in the Asia Pacific region.
Asia Pacific Progressing Cavity Pump Market Size, and Share

Key Market Players

NETZSCH (Germany), SEEPEX (Germany), NOV (US), CIRCOR International (US), Schlumberger (US), PCM (France), Xylem (US), Sulzer (Switzerland), ChampionX (US), Roto Pumps (India) .

Get online access to the report on the World's First Market Intelligence Cloud

  • Easy to Download Historical Data & Forecast Numbers
  • Company Analysis Dashboard for high growth potential opportunities
  • Research Analyst Access for customization & queries
  • Competitor Analysis with Interactive dashboard
  • Latest News, Updates & Trend analysis
Request Sample

Scope of the Report

Report Metric

Details

Market Size available for years

2020–2029

Base year considered

2023

Forecast period

2024–2029

Forecast units

Value (USD Million)

Segments covered

By Power Rating, By Pumping Capacity, By End-user Industry, By Product type, By Stage type

Geographies covered

Asia Pacific, North America, Europe, Middle East and Africa, and South America 

Companies covered

NETZSCH (Germany), seepex (Germany), PCM (France), NOV Inc. (United States), Circor International (United States), ChampionX (United States), Xylem (United States), Sulzer (Switzerland), SLB (Schlumberger Limited) (United States), Wilo (Germany), Varisco (Italy), Delta PD Pumps (United Kingdom), Nova Rotors (Italy), Roto Pumps (India), Inoxpa (Spain), Shanghai GL Environmental Technology (China), Hangzhou Xinglong Pump Industry (China), Shanghai Pacific Pump Manufacturer (China), PSP Pumps (India), Tapflo (Sweden), GEA Germany GmbH (Germany), Fristam Pumps India Pvt. Ltd. (India)

The progressing cavity pump market is classified in this research report based on power rating, pumping capacity, end-user industry, product type, stage type and region.

Based on power rating, the progressing cavity pump market has been segmented as follows:
  • Up to 50 HP
  • 51-150 HP
  • Above 150 HP
Based on pumping capacity, the market has been segmented as follows:
  • Up to 500 GPM
  • 501-1000 GPM
  • Above 1000 GPM
Based on end-user industry, the market has been segmented as follows:
  • Oil & Gas
  • Water & Wastewater Treatment
  • Food & Beverage
  • Food Waste
  • Biogas
  • Battery Recycling
  • Chemicals & Petrochemicals
  • Others
Based on product type, the market has been segmented as follows:
  • Dosing Pump
  • Flanged Pump
  • Hopper Pump
  • Food Grade Pump (EHEDG/3A Certified)
  • Food Grade Pump (Non-Certified)
  • Vertical Pump
  • Downhole Pump
Based on stage type, the market has been segmented as follows:
  • Single Stage (90- PSI)
  • Double Stage (180-PSI)
  • Four Stage (360-PSI)
  • Eight Stage (720- PSI)
Based on regions, the market has been segmented as follows:
  • North America
  • Asia Pacific
  • South America
  • Europe
  • Middle East and Africa

Recent Developments

  • In April 2022, NOV has extended the Low Flow Metering Range Pump's availability. The pumps have a strong tolerance to harsh chemicals and are needed for either continuous or intermittent dosing. The pump is suitable for a broad range of products and applications, such as chemical injection for wastewater, chemical processing for different industries, and the pharmaceutical sector. 
  • In January 2022, In Brazil, NETZSCH started building the new production facility. The new facility is situated in Santa Catarina's Ribeirão Souto, close to the existing facilities in Pomerode's core region. The new plant in South America will take over the entire production of multi-screw pumps. Additionally, the plant's functioning will enable the business to increase the production of its other product lines.
  • In April 2022, NOV has extended the Low Flow Metering Range Pump's availability. The pumps have a strong tolerance to harsh chemicals and are needed for either continuous or intermittent dosing. The pump is suitable for a broad range of products and applications, such as chemical injection for wastewater, chemical processing for different industries, and the pharmaceutical sector.

Frequently Asked Questions (FAQ):

To speak to our analyst for a discussion on the above findings, click Speak to Analyst

TABLE OF CONTENTS
 
1 INTRODUCTION (Page No. - 35)
    1.1 STUDY OBJECTIVES 
    1.2 MARKET DEFINITION 
    1.3 INCLUSIONS AND EXCLUSIONS 
           1.3.1 PROGRESSING CAVITY PUMP MARKET: INCLUSIONS AND EXCLUSIONS, BY POWER RATING
           1.3.2 MARKET: INCLUSIONS AND EXCLUSIONS, BY PUMPING CAPACITY
           1.3.3 MARKET: INCLUSIONS AND EXCLUSIONS, BY END USER
    1.4 STUDY SCOPE 
           1.4.1 MARKETS COVERED
           1.4.2 REGIONAL SCOPE
           1.4.3 YEARS CONSIDERED
           1.4.4 CURRENCY CONSIDERED
           1.4.5 UNITS CONSIDERED
    1.5 LIMITATIONS 
    1.6 STAKEHOLDERS 
    1.7 SUMMARY OF CHANGES 
    1.8 RECESSION IMPACT 
 
2 RESEARCH METHODOLOGY (Page No. - 42)
    2.1 RESEARCH DATA 
           FIGURE 1 PROGRESSING CAVITY PUMP MARKET: RESEARCH DESIGN
           2.1.1 SECONDARY DATA
                    2.1.1.1 List of major secondary sources
                               TABLE 1 LIST OF MAJOR SECONDARY SOURCES
                    2.1.1.2 Key data from secondary sources
           2.1.2 PRIMARY DATA
                    2.1.2.1 Key data from primary sources
                    2.1.2.2 Breakdown of primaries
                               FIGURE 2 BREAKDOWN OF PRIMARIES: BY COMPANY TYPE, DESIGNATION,  AND REGION
                               FIGURE 3 MAIN METRICS CONSIDERED TO ANALYZE AND ASSESS DEMAND FOR PROGRESSING CAVITY PUMPS
    2.2 MARKET SIZE ESTIMATION 
           2.2.1 BOTTOM-UP APPROACH
                    FIGURE 4 MARKET SIZE ESTIMATION METHODOLOGY: BOTTOM-UP APPROACH
           2.2.2 TOP-DOWN APPROACH
                    FIGURE 5 MARKET SIZE ESTIMATION METHODOLOGY: TOP-DOWN APPROACH
           2.2.3 DEMAND-SIDE ANALYSIS
                    2.2.3.1 Regional analysis
                    2.2.3.2 Country-level analysis
                    2.2.3.3 Demand-side assumptions
                    2.2.3.4 Demand-side calculations
           2.2.4 SUPPLY-SIDE ANALYSIS
                    FIGURE 6 KEY STEPS CONSIDERED TO ASSESS SUPPLY OF PROGRESSING CAVITY PUMPS
                    FIGURE 7 PROGRESSING CAVITY PUMP MARKET: SUPPLY-SIDE ANALYSIS
                    2.2.4.1 Supply-side calculations
                    2.2.4.2 Supply-side assumptions
    2.3 FORECAST 
    2.4 RISK ASSESSMENT 
    2.5 RESEARCH LIMITATIONS 
    2.6 IMPACT OF RECESSION 
    2.7 MARKET BREAKDOWN AND DATA TRIANGULATION 
           FIGURE 8 DATA TRIANGULATION
 
3 EXECUTIVE SUMMARY (Page No. - 54)
    TABLE 2 PROGRESSING CAVITY PUMP MARKET SNAPSHOT 
    FIGURE 9 ASIA PACIFIC TO HOLD LARGEST SHARE OF MARKET IN 2023 
    FIGURE 10 UP TO 50 HP SEGMENT TO REGISTER HIGHEST CAGR IN MARKET DURING FORECAST PERIOD 
    FIGURE 11 WATER & WASTEWATER TREATMENT INDUSTRY SEGMENT TO ACCOUNT FOR LARGEST SHARE OF MARKET IN 2029 
    FIGURE 12 UP TO 500 GPM SEGMENT TO HOLD LARGEST SHARE OF MARKET IN 2029 
 
4 PREMIUM INSIGHTS (Page No. - 58)
    4.1 ATTRACTIVE OPPORTUNITIES FOR PLAYERS IN PROGRESSING CAVITY PUMP MARKET 
           FIGURE 13 RISING DEMAND FOR CLEAN AND EFFICIENT POWER GENERATION TECHNOLOGIES TO DRIVE MARKET
    4.2 MARKET IN ASIA PACIFIC,  BY END USER AND COUNTRY 
           FIGURE 14 WATER & WASTEWATER TREATMENT INDUSTRY SEGMENT AND CHINA HELD LARGEST SHARES OF MARKET IN ASIA PACIFIC  IN 2023
    4.3 MARKET, BY POWER RATING 
           FIGURE 15 UP TO 50 HP SEGMENT TO ACCOUNT FOR LARGEST MARKET SHARE IN 2029
    4.4 MARKET, BY PUMPING CAPACITY 
           FIGURE 16 UP TO 500 GPM SEGMENT TO DOMINATE MARKET IN 2029
    4.5 MARKET, BY END USER 
           FIGURE 17 WATER & WASTEWATER TREATMENT INDUSTRY SEGMENT TO HOLD LARGEST MARKET SHARE IN 2029
    4.6 MARKET, BY REGION 
           FIGURE 18 ASIA PACIFIC MARKET TO RECORD HIGHEST CAGR DURING FORECAST PERIOD
 
5 MARKET OVERVIEW (Page No. - 62)
    5.1 INTRODUCTION 
    5.2 MARKET DYNAMICS 
           FIGURE 19 PROGRESSING CAVITY PUMP MARKET: DRIVERS, RESTRAINTS, OPPORTUNITIES, AND CHALLENGES
           5.2.1 DRIVERS
                    5.2.1.1 Growing demand in water & wastewater treatment industry
                               TABLE 3 PROPORTION OF SAFELY TREATED DOMESTIC WASTEWATER FLOWS (%)
                    5.2.1.2 Rising investments in oil & gas exploration
                               FIGURE 20 GLOBAL OIL DEMAND, 2019–2028 (MB/D)
                    5.2.1.3 Advancements in material science and progressing cavity pump design
                               FIGURE 21 GLOBAL ELECTRICITY INVESTMENT AND SHARE OF DIGITAL GRID INFRASTRUCTURE, 2015–2023 (USD BILLION)
           5.2.2 RESTRAINTS
                    5.2.2.1 High initial investment and shortage of skilled labor
                    5.2.2.2 Fluctuating raw material prices
           5.2.3 OPPORTUNITIES
                    5.2.3.1 Growing adoption of Industry 4.0 technologies
                    5.2.3.2 Rise in investments in food & beverages industry
                               FIGURE 22 CAPITAL EXPENDITURE BY TOP 100 COMPANIES IN FOOD & BEVERAGES INDUSTRY, 2016–2021 (USD BILLION)
                    5.2.3.3 Rising demand for electric vehicles (EVs)
           5.2.4 CHALLENGES
                    5.2.4.1 Preference for traditional centrifugal pumps over progressing cavity pumps in low-solid content wastewater applications
                    5.2.4.2 Counterfeiting and intellectual property concerns
    5.3 PORTER’S FIVE FORCES ANALYSIS 
           FIGURE 23 MARKET: PORTER’S FIVE FORCES ANALYSIS
           TABLE 4 MARKET: PORTER’S FIVE FORCES ANALYSIS
           5.3.1 THREAT OF NEW ENTRANTS
           5.3.2 BARGAINING POWER OF SUPPLIERS
           5.3.3 BARGAINING POWER OF BUYERS
           5.3.4 THREAT OF SUBSTITUTES
           5.3.5 INTENSITY OF COMPETITIVE RIVALRY
    5.4 PRICING ANALYSIS 
           5.4.1 INDICATIVE PRICING ANALYSIS OF PROGRESSING CAVITY PUMPS, BY PUMPING CAPACITY
                    TABLE 5 INDICATIVE PRICING ANALYSIS OF PROGRESSING CAVITY PUMPS, BY PUMPING CAPACITY
           5.4.2 AVERAGE SELLING PRICE (ASP) OF PROGRESSING CAVITY PUMPS, BY REGION
                    TABLE 6 AVERAGE SELLING PRICE (ASP) OF PROGRESSING CAVITY PUMPS, BY REGION,  2020–2029 (USD/UNIT)
                    FIGURE 24 AVERAGE SELLING PRICE (ASP) TREND OF PROGRESSING CAVITY PUMPS,  BY REGION, 2020–2029 (USD/UNIT)
    5.5 SUPPLY CHAIN ANALYSIS 
           FIGURE 25 MARKET: SUPPLY CHAIN ANALYSIS
           5.5.1 RAW MATERIAL PROVIDERS/SUPPLIERS
           5.5.2 COMPONENT MANUFACTURERS
           5.5.3 PROGRESSING CAVITY PUMP ASSEMBLERS/MANUFACTURERS
           5.5.4 DISTRIBUTORS
           5.5.5 END USERS
    5.6 ECOSYSTEM/MARKET MAP 
           FIGURE 26 MARKET: MARKET MAP
           TABLE 7 ROLES OF COMPANIES IN PROGRESSING CAVITY PUMP ECOSYSTEM
    5.7 TRENDS/DISRUPTIONS IMPACTING CUSTOMERS’ BUSINESSES 
           FIGURE 27 TRENDS/DISRUPTIONS IMPACTING CUSTOMERS’ BUSINESSES
    5.8 TECHNOLOGY ANALYSIS 
           5.8.1 KEY TECHNOLOGY
                    5.8.1.1 Smart pump systems
           5.8.2 COMPLEMENTARY TECHNOLOGY
                    5.8.2.1 Artificial intelligence (AI) and machine learning (ML)
    5.9 PATENT ANALYSIS 
           FIGURE 28 PATENTS GRANTED AND APPLIED RELATED TO PROGRESSING CAVITY PUMPS, 2014–2023
           TABLE 8 MARKET: PATENT ANALYSIS, FEBRUARY 2020– FEBRUARY 2024
    5.10 TRADE ANALYSIS 
           5.10.1 TRADE ANALYSIS RELATED TO ENGINES AND MOTORS
                    5.10.1.1 Import scenario
                               TABLE 9 IMPORT DATA FOR HS CODE 841360-COMPLIANT PRODUCTS, BY COUNTRY,  2020–2022 (USD THOUSAND)
                               FIGURE 29 IMPORT DATA FOR HS CODE 841360-COMPLIANT PRODUCTS, BY FIVE KEY COUNTRIES, 2020–2022 (USD THOUSAND)
                    5.10.1.2 Export scenario
                               TABLE 10 EXPORT DATA FOR HS CODE 841360-COMPLIANT PRODUCTS, BY COUNTRY, 2020–2022 (USD THOUSAND)
                               FIGURE 30 EXPORT DATA FOR HS CODE 841360-COMPLIANT PRODUCTS, BY FIVE KEY COUNTRIES, 2020–2022 (USD THOUSAND)
    5.11 CASE STUDY ANALYSIS 
           5.11.1 NETZSCH PARTNERED WITH DXP TO ADDRESS CHALLENGES ASSOCIATED WITH TRADITIONAL CENTRIFUGAL PUMPS OF OIL PRODUCER
                    5.11.1.1 Problem statement
                    5.11.1.2 Solution
           5.11.2 ALL-PUMPS UTILIZED NEXUS HELICAL ROTOR PUMPS TO TREAT MINING WATER
                    5.11.2.1 Problem statement
                    5.11.2.2 Solution
           5.11.3 IRISH DISTILLERY COLLABORATED WITH SEEPEX TO INCREASE PRODUCTIVITY OF WHISKEY BY 50%
                    5.11.3.1 Problem statement
                    5.11.3.2 Solution
    5.12 INVESTMENT AND FUNDING SCENARIO 
                    FIGURE 31 INVESTMENT AND FUNDING SCENARIO
    5.13 TARIFFS, STANDARDS, AND REGULATORY LANDSCAPE 
           5.13.1 TARIFF RELATED TO PROGRESSING CAVITY PUMPS
                    TABLE 11 IMPORT TARIFF FOR HS 841360-COMPLIANT ROTARY POSITIVE DISPLACEMENT PUMPS IN 2022
           5.13.2 REGULATORY BODIES, GOVERNMENT AGENCIES, AND OTHER ORGANIZATIONS
                    TABLE 12 NORTH AMERICA: LIST OF REGULATORY BODIES, GOVERNMENT AGENCIES, AND OTHER ORGANIZATIONS
                    TABLE 13 EUROPE: LIST OF REGULATORY BODIES, GOVERNMENT AGENCIES, AND OTHER ORGANIZATIONS
                    TABLE 14 ASIA PACIFIC: LIST OF REGULATORY BODIES, GOVERNMENT AGENCIES, AND OTHER ORGANIZATIONS
                    TABLE 15 ROW: LIST OF REGULATORY BODIES, GOVERNMENT AGENCIES, AND OTHER ORGANIZATIONS
                    TABLE 16 GLOBAL: LIST OF REGULATORY BODIES, GOVERNMENT AGENCIES, AND OTHER ORGANIZATIONS
           5.13.3 STANDARDS
                    TABLE 17 STANDARDS RELATED TO POSITIVE DISPLACEMENT ROTARY PUMPS
    5.14 KEY STAKEHOLDERS AND BUYING CRITERIA 
           5.14.1 KEY STAKEHOLDERS IN BUYING PROCESS
                    FIGURE 32 INFLUENCE OF KEY STAKEHOLDERS ON BUYING PROCESS FOR  TOP THREE END USERS
                    TABLE 18 INFLUENCE OF KEY STAKEHOLDERS ON BUYING PROCESS FOR TOP THREE END USERS
           5.14.2 BUYING CRITERIA
                    FIGURE 33 KEY BUYING CRITERIA FOR TOP THREE END USERS
                    TABLE 19 KEY BUYING CRITERIA FOR TOP THREE END USERS
    5.15 KEY CONFERENCES AND EVENTS, 2024–2025 
                    TABLE 20 MARKET: KEY CONFERENCES AND EVENTS, 2024–2025
 
6 MARKET, BY PRODUCT TYPE (Page No. - 97)
    6.1 INTRODUCTION 
    6.2 DOSING PUMPS 
           6.2.1 GROWING USE TO PRECISELY DELIVER FLUIDS ACROSS INDUSTRIES TO FUEL MARKET GROWTH
    6.3 FLANGED PUMPS 
           6.3.1 VERSATILE APPLICATIONS IN MINING, CONSTRUCTION, AND CHEMICALS INDUSTRIES TO DRIVE MARKET
    6.4 HOPPER PUMPS 
           6.4.1 ONGOING ADVANCEMENTS TO ENHANCE PERFORMANCE AND RELIABILITY TO DRIVE MARKET
    6.5 FOOD GRADE (EHEDG/3A-CERTIFIED) PUMPS 
           6.5.1 GROWING USE IN INDUSTRIAL FOOD PROCESSING FOR ENSURING HYGIENIC EXCELLENCE TO DRIVE MARKET
    6.6 FOOD GRADE (NON-CERTIFIED) PUMPS 
           6.6.1 SAFE CONTACT WITH FOOD AND COMPLIANCE WITH INDUSTRY REGULATIONS TO DRIVE DEMAND
    6.7 VERTICAL PUMPS 
           6.7.1 ABILITY TO EFFICIENTLY HANDLE FLUIDS WITH HIGH VISCOSITY OR ENTRAINED SOLIDS AND CORROSIVE OR ABRASIVE LIQUIDS TO DRIVE DEMAND
 
7 MARKET, BY STAGE TYPE (Page No. - 101)
    7.1 INTRODUCTION 
    7.2 SINGLE-STAGE (90-PSI) PUMPS 
           7.2.1 GROWING USE OF SINGLE-STAGE PROGRESSING CAVITY PUMPS FOR LOW-PRESSURE FLUID TRANSFER TO DRIVE MARKET
    7.3 DOUBLE-STAGE (180-PSI) PUMPS 
           7.3.1 RISING ADOPTION OF DOUBLE-STAGE PROGRESSING CAVITY PUMPS FOR MODERATE-PRESSURE FLUID TRANSFER IN VARIOUS INDUSTRIES TO DRIVE MARKET
    7.4 FOUR-STAGE (360-PSI) PUMPS 
           7.4.1 INCREASING DEMAND FOR FOUR-STAGE PROGRESSING CAVITY PUMPS IN VARIOUS SECTORS AND INDUSTRIES FOR CONVEYING AND DOSING APPLICATIONS TO DRIVE MARKET
    7.5 EIGHT-STAGE (720-PSI) PUMPS 
           7.5.1 UNPARALLELED PRESSURE CAPABILITIES AND HIGH RELIABILITY IN HIGH-PRESSURE FLUID TRANSFER APPLICATIONS TO DRIVE DEMAND
 
8 PROGRESSING CAVITY PUMP MARKET, BY POWER RATING (Page No. - 104)
    8.1 INTRODUCTION 
           FIGURE 34 PROGRESSING CAVITY PUMP MARKET, BY POWER RATING, 2023
           TABLE 21 MARKET, BY POWER RATING, 2020–2023 (USD MILLION)
           TABLE 22 MARKET, BY POWER RATING, 2024–2029 (USD MILLION)
    8.2 UP TO 50 HP 
           8.2.1 GROWING USE OF UP TO 50 HP PROGRESSING CAVITY PUMPS IN TOUGH PUMPING APPLICATIONS TO DRIVE MARKET
                    TABLE 23 UP TO 50 HP: MARKET, BY REGION,  2020–2023 (USD MILLION)
                    TABLE 24 UP TO 50 HP: MARKET, BY REGION,  2024–2029 (USD MILLION)
    8.3 51–150 HP 
           8.3.1 RISING EMPHASIS ON EFFICIENCY, RELIABILITY, AND COST-EFFECTIVENESS IN INDUSTRIAL PROCESSES TO DRIVE DEMAND
                    TABLE 25 51–150 HP: MARKET, BY REGION,  2020–2023 (USD MILLION)
                    TABLE 26 51–150 HP: MARKET, BY REGION,  2024–2029 (USD MILLION)
    8.4 ABOVE 150 HP 
           8.4.1 INCREASING DEPLOYMENT OF ABOVE 150 HP PROGRESSING CAVITY PUMPS IN UNCONVENTIONAL OIL & GAS WELLS TO DRIVE MARKET
                    TABLE 27 ABOVE 150 HP: MARKET, BY REGION,  2020–2023 (USD MILLION)
                    TABLE 28 ABOVE 150 HP: MARKET, BY REGION,  2024–2029 (USD MILLION)
 
9 PROGRESSING CAVITY PUMP MARKET, BY PUMPING CAPACITY (Page No. - 110)
    9.1 INTRODUCTION 
           FIGURE 35 MARKET, BY PUMPING CAPACITY, 2023
           TABLE 29 MARKET, BY PUMPING CAPACITY,  2020–2023 (USD MILLION)
           TABLE 30 MARKET, BY PUMPING CAPACITY,  2024–2029 (USD MILLION)
    9.2 UP TO 500 GPM 
           9.2.1 INCREASING DEMAND FOR WATER & WASTEWATER TREATMENT SOLUTIONS AND INDUSTRIALIZATION IN EMERGING ECONOMIES TO DRIVE DEMAND
                    TABLE 31 UP TO 500 GPM: MARKET, BY REGION,  2020–2023 (USD MILLION)
                    TABLE 32 UP TO 500 GPM: MARKET, BY REGION,  2024–2029 (USD MILLION)
    9.3 501–1,000 GPM 
           9.3.1 VERSATILITY, IMPROVED EFFICIENCY, AND REDUCED MAINTENANCE REQUIREMENTS TO DRIVE DEMAND
                    TABLE 33 501–1,000 GPM: MARKET, BY REGION,  2020–2023 (USD MILLION)
                    TABLE 34 501–1,000 GPM: MARKET, BY REGION,  2024–2029 (USD MILLION)
    9.4 ABOVE 1,000 GPM 
           9.4.1 INCREASING DEMAND FOR WATER AND ENERGY AND INFRASTRUCTURE DEVELOPMENT PROJECTS TO FUEL DEMAND
                    TABLE 35 ABOVE 1,000 GPM: MARKET, BY REGION,  2020–2023 (USD MILLION)
                    TABLE 36 ABOVE 1,000 GPM: MARKET, BY REGION,  2024–2029 (USD MILLION)
 
10 PROGRESSING CAVITY PUMP MARKET, BY END USER (Page No. - 115)
     10.1 INTRODUCTION 
               FIGURE 36 MARKET, BY END USER, 2023
               TABLE 37 MARKET, BY END USER, 2020–2023 (USD MILLION)
               TABLE 38 MARKET, BY END USER, 2024–2029 (USD MILLION)
     10.2 OIL & GAS INDUSTRY 
             10.2.1 INCREASING OIL & GAS EXPLORATION AND PRODUCTION ACTIVITIES, PARTICULARLY IN UNCONVENTIONAL RESERVES, TO DRIVE DEMAND
                       TABLE 39 OIL & GAS INDUSTRY: MARKET, BY REGION,  2020–2023 (USD MILLION)
                       TABLE 40 OIL & GAS INDUSTRY: MARKET, BY REGION,  2024–2029 (USD MILLION)
     10.3 WATER & WASTEWATER TREATMENT INDUSTRY 
             10.3.1 IMPLEMENTATION OF STRINGENT ENVIRONMENTAL REGULATIONS MANDATING WASTEWATER TREATMENT AND DISCHARGE STANDARDS TO DRIVE DEMAND
                       TABLE 41 WATER & WASTEWATER TREATMENT INDUSTRY: MARKET,  BY REGION, 2020–2023 (USD MILLION)
                       TABLE 42 WATER & WASTEWATER TREATMENT INDUSTRY: MARKET,  BY REGION, 2024–2029 (USD MILLION)
     10.4 FOOD & BEVERAGES INDUSTRY 
             10.4.1 INCREASING TREND OF AUTOMATION AND PROCESS OPTIMIZATION IN FOOD PROCESSING PLANTS TO FUEL ADOPTION
                       TABLE 43 FOOD & BEVERAGES INDUSTRY: MARKET, BY REGION,  2020–2023 (USD MILLION)
                       TABLE 44 FOOD & BEVERAGES INDUSTRY: MARKET, BY REGION,  2024–2029 (USD MILLION)
     10.5 FOOD WASTE INDUSTRY 
             10.5.1 ABILITY TO EFFICIENTLY TRANSFER AND PROCESS ORGANIC WASTE MATERIALS TO FUEL DEMAND
                       TABLE 45 FOOD WASTE INDUSTRY: MARKET, BY REGION,  2020–2023 (USD MILLION)
                       TABLE 46 FOOD WASTE INDUSTRY: MARKET, BY REGION,  2024–2029 (USD MILLION)
     10.6 BIOGAS PLANTS 
             10.6.1 INCREASING FOCUS ON RENEWABLE ENERGY SOURCES AND GOVERNMENT-LED INCENTIVES FOR BIOGAS PRODUCTION TO DRIVE DEMAND
                       TABLE 47 BIOGAS PLANTS: MARKET, BY REGION,  2020–2023 (USD MILLION)
                       TABLE 48 BIOGAS PLANTS: MARKET, BY REGION,  2024–2029 (USD MILLION)
     10.7 BATTERY RECYCLING PLANTS 
             10.7.1 ENHANCEMENT OF EFFICIENCY AND EFFECTIVENESS OF BATTERY RECYCLING OPERATIONS TO DRIVE DEMAND
                       TABLE 49 BATTERY RECYCLING PLANTS: MARKET, BY REGION,  2020–2023 (USD MILLION)
                       TABLE 50 BATTERY RECYCLING PLANTS: MARKET, BY REGION,  2024–2029 (USD MILLION)
     10.8 CHEMICALS & PETROCHEMICALS INDUSTRY 
             10.8.1 GROWTH OF CHEMICAL MANUFACTURING, EXPANSION OF PETROCHEMICAL FACILITIES, AND INCREASING DEMAND FOR SPECIALTY CHEMICALS TO DRIVE DEMAND
                       TABLE 51 CHEMICALS & PETROCHEMICALS INDUSTRY: MARKET,  BY REGION, 2020–2023 (USD MILLION)
                       TABLE 52 CHEMICALS & PETROCHEMICALS INDUSTRY: MARKET,  BY REGION, 2024–2029 (USD MILLION)
     10.9 OTHERS 
               TABLE 53 OTHERS: MARKET, BY REGION,  2020–2023 (USD MILLION)
               TABLE 54 OTHERS: MARKET, BY REGION,  2024–2029 (USD MILLION)
 
11 PROGRESSING CAVITY PUMP MARKET, BY REGION (Page No. - 129)
     11.1 INTRODUCTION 
               FIGURE 37 ASIA PACIFIC MARKET TO REGISTER HIGHEST CAGR DURING FORECAST PERIOD
               FIGURE 38 ASIA PACIFIC HELD LARGEST SHARE OF MARKET IN 2023
               TABLE 55 MARKET, BY REGION, 2020–2023 (USD MILLION)
               TABLE 56 MARKET, BY REGION, 2024–2029 (USD MILLION)
               TABLE 57 MARKET, BY REGION, 2020–2023 (THOUSAND UNITS)
               TABLE 58 MARKET, BY REGION, 2024–2029 (THOUSAND UNITS)
     11.2 ASIA PACIFIC 
             11.2.1 IMPACT OF RECESSION ON MARKET IN ASIA PACIFIC
                       FIGURE 39 ASIA PACIFIC: MARKET SNAPSHOT
             11.2.2 BY POWER RATING
                       TABLE 59 ASIA PACIFIC: MARKET, BY POWER RATING,  2020–2023 (USD MILLION)
                       TABLE 60 ASIA PACIFIC: MARKET, BY POWER RATING,  2024–2029 (USD MILLION)
             11.2.3 BY PUMPING CAPACITY
                       TABLE 61 ASIA PACIFIC: MARKET, BY PUMPING CAPACITY,  2020–2023 (USD MILLION)
                       TABLE 62 ASIA PACIFIC: MARKET, BY PUMPING CAPACITY,  2024–2029 (USD MILLION)
             11.2.4 BY END USER
                       TABLE 63 ASIA PACIFIC: MARKET, BY END USER,  2020–2023 (USD MILLION)
                       TABLE 64 ASIA PACIFIC: MARKET, BY END USER,  2024–2029 (USD MILLION)
             11.2.5 BY COUNTRY
                       TABLE 65 ASIA PACIFIC: MARKET, BY COUNTRY,  2020–2023 (USD MILLION)
                       TABLE 66 ASIA PACIFIC: MARKET, BY COUNTRY,  2024–2029 (USD MILLION)
                       11.2.5.1 China
                                   11.2.5.1.1 Rapid industrialization, infrastructure development, and environmental sustainability initiatives to drive market
                                   TABLE 67 CHINA: MARKET, BY POWER RATING, 2020–2023 (USD MILLION)
                                   TABLE 68 CHINA: MARKET, BY POWER RATING, 2024–2029 (USD MILLION)
                       11.2.5.2 India
                                   11.2.5.2.1 Increasing applications in oil & gas, water & wastewater treatment, food & beverages, and chemicals & petrochemicals industries to drive market
                                   TABLE 69 INDIA: MARKET, BY POWER RATING, 2020–2023 (USD MILLION)
                                   TABLE 70 INDIA: MARKET, BY POWER RATING, 2024–2029 (USD MILLION)
                       11.2.5.3 Australia
                                   11.2.5.3.1 Ongoing industrial developments, infrastructure investments, and increasing demand for efficient fluid handling solutions to drive market
                                   TABLE 71 AUSTRALIA: MARKET, BY POWER RATING, 2020–2023 (USD MILLION)
                                   TABLE 72 AUSTRALIA: MARKET, BY POWER RATING, 2024–2029 (USD MILLION)
                       11.2.5.4 Japan
                                   11.2.5.4.1 Efficiency, reliability, and sustainability features of progressing cavity pumps to drive demand
                                   TABLE 73 JAPAN: MARKET, BY POWER RATING , 2020–2023 (USD MILLION)
                                   TABLE 74 JAPAN: MARKET, BY POWER RATING , 2024–2029 (USD MILLION)
                       11.2.5.5 Rest of Asia Pacific
                                   TABLE 75 REST OF ASIA PACIFIC: MARKET, BY POWER RATING, 2020–2023 (USD MILLION)
                                   TABLE 76 REST OF ASIA PACIFIC: MARKET, BY POWER RATING, 2024–2029 (USD MILLION)
     11.3 NORTH AMERICA 
             11.3.1 IMPACT OF RECESSION ON MARKET IN NORTH AMERICA
                       FIGURE 40 NORTH AMERICA: MARKET SNAPSHOT
             11.3.2 BY POWER RATING
                       TABLE 77 NORTH AMERICA: MARKET, BY POWER RATING, 2020–2023 (USD MILLION)
                       TABLE 78 NORTH AMERICA: MARKET, BY POWER RATING, 2024–2029 (USD MILLION)
             11.3.3 BY PUMPING CAPACITY
                       TABLE 79 NORTH AMERICA: MARKET, BY PUMPING CAPACITY,  2020–2023 (USD MILLION)
                       TABLE 80 NORTH AMERICA: MARKET, BY PUMPING CAPACITY,  2024–2029 (USD MILLION)
             11.3.4 BY END USER
                       TABLE 81 NORTH AMERICA: MARKET, BY END USER,  2020–2023 (USD MILLION)
                       TABLE 82 NORTH AMERICA: MARKET, BY END USER,  2024–2029 (USD MILLION)
             11.3.5 BY COUNTRY
                       TABLE 83 NORTH AMERICA: MARKET, BY COUNTRY,  2020–2023 (USD MILLION)
                       TABLE 84 NORTH AMERICA: MARKET, BY COUNTRY,  2024–2029 (USD MILLION)
                       11.3.5.1 US
                                   11.3.5.1.1 Increasing focus on sustainability and resource management to drive demand
                                   TABLE 85 US: MARKET, BY POWER RATING,  2020–2023 (USD MILLION)
                                   TABLE 86 US: MARKET SIZE, BY POWER RATING,  2024–2029 (USD MILLION)
                       11.3.5.2 Canada
                                   11.3.5.2.1 Large presence of oil sands and shale gas reserves and increasing exploration activities to drive demand
                                   TABLE 87 CANADA: MARKET, BY POWER RATING,  2020–2023 (USD MILLION)
                                   TABLE 88 CANADA: MARKET SIZE, BY POWER RATING,  2024–2029 (USD MILLION)
                       11.3.5.3 Mexico
                                   11.3.5.3.1 Booming industrial sector and infrastructure development to drive demand
                                   TABLE 89 MEXICO: MARKET, BY POWER RATING,  2020–2023 (USD MILLION)
                                   TABLE 90 MEXICO: MARKET SIZE, BY POWER RATING,  2024–2029 (USD MILLION)
     11.4 EUROPE 
             11.4.1 IMPACT OF RECESSION ON MARKET  IN EUROPE
             11.4.2 BY POWER RATING
                       TABLE 91 EUROPE: MARKET, BY POWER RATING,  2020–2023 (USD MILLION)
                       TABLE 92 EUROPE: MARKET, BY POWER RATING,  2024–2029 (USD MILLION)
             11.4.3 BY PUMPING CAPACITY
                       TABLE 93 EUROPE: MARKET, BY PUMPING CAPACITY,  2020–2023 (USD MILLION)
                       TABLE 94 EUROPE: MARKET, BY PUMPING CAPACITY,  2024–2029 (USD MILLION)
             11.4.4 BY END USER
                       TABLE 95 EUROPE: MARKET, BY END USER,  2020–2023 (USD MILLION)
                       TABLE 96 EUROPE: MARKET, BY END USER,  2024–2029 (USD MILLION)
             11.4.5 BY COUNTRY
                       TABLE 97 EUROPE: MARKET, BY COUNTRY,  2020–2023 (USD MILLION)
                       TABLE 98 EUROPE: MARKET, BY COUNTRY,  2024–2029 (USD MILLION)
                       11.4.5.1 UK
                                   11.4.5.1.1 Rising offshore exploration and production activities to drive demand
                                   TABLE 99 UK: MARKET, BY POWER RATING,  2020–2023 (USD MILLION)
                                   TABLE 100 UK: MARKET, BY POWER RATING,  2024–2029 (USD MILLION)
                       11.4.5.2 France
                                   11.4.5.2.1 Expanding industrial, manufacturing, renewable energy, and food processing sectors to drive market
                                   TABLE 101 FRANCE: MARKET, BY POWER RATING,  2020–2023 (USD MILLION)
                                   TABLE 102 FRANCE: MARKET, BY POWER RATING,  2024–2029 (USD MILLION)
                       11.4.5.3 Germany
                                   11.4.5.3.1 Diverse industrial base, encompassing automotive, chemical, food processing, and renewable energy industries, to fuel demand
                                   TABLE 103 GERMANY: MARKET, BY POWER RATING,  2020–2023 (USD MILLION)
                                   TABLE 104 GERMANY: MARKET, BY POWER RATING,  2024–2029 (USD MILLION)
                       11.4.5.4 Russia
                                   11.4.5.4.1 Industrial development plans and strategic initiatives related to renewable energy initiatives to drive market
                                   TABLE 105 RUSSIA: MARKET, BY POWER RATING,  2020–2023 (USD MILLION)
                                   TABLE 106 RUSSIA: MARKET, BY POWER RATING,  2024–2029 (USD MILLION)
                       11.4.5.5 Italy
                                   11.4.5.5.1 Rising demand for reliable and efficient fluid-handling solutions to drive demand
                                   TABLE 107 ITALY: MARKET, BY POWER RATING,  2020–2023 (USD MILLION)
                                   TABLE 108 ITALY: MARKET, BY POWER RATING,  2024–2029 (USD MILLION)
             11.4.6 REST OF EUROPE
                       TABLE 109 REST OF EUROPE: MARKET, BY POWER RATING,  2020–2023 (USD MILLION)
                       TABLE 110 REST OF EUROPE: MARKET, BY POWER RATING,  2024–2029 (USD MILLION)
     11.5 MIDDLE EAST & AFRICA 
             11.5.1 IMPACT OF RECESSION ON MARKET IN MIDDLE EAST & AFRICA
             11.5.2 BY POWER RATING
                       TABLE 111 MIDDLE EAST & AFRICA: MARKET, BY POWER RATING,  2020–2023 (USD MILLION)
                       TABLE 112 MIDDLE EAST & AFRICA: MARKET, BY POWER RATING,  2024–2029 (USD MILLION)
             11.5.3 BY PUMPING CAPACITY
                       TABLE 113 MIDDLE EAST & AFRICA: MARKET, BY PUMPING CAPACITY,  2020–2023 (USD MILLION)
                       TABLE 114 MIDDLE EAST & AFRICA: MARKET, BY PUMPING CAPACITY,  2024–2029 (USD MILLION)
             11.5.4 BY END USER
                       TABLE 115 MIDDLE EAST & AFRICA: MARKET, BY END USER,  2020–2023 (USD MILLION)
                       TABLE 116 MIDDLE EAST & AFRICA: MARKET, BY END USER,  2024–2029 (USD MILLION)
             11.5.5 BY COUNTRY
                       TABLE 117 MIDDLE EAST & AFRICA: MARKET, BY COUNTRY,  2020–2023 (USD MILLION)
                       TABLE 118 MIDDLE EAST & AFRICA: MARKET, BY COUNTRY,  2024–2029 (USD MILLION)
                       TABLE 119 GCC: MARKET, BY COUNTRY,  2020–2023 (USD MILLION)
                       TABLE 120 GCC: MARKET, BY COUNTRY,  2024–2029 (USD MILLION)
                       11.5.5.1 GCC
                                   TABLE 121 GCC: MARKET, BY POWER RATING,  2020–2023 (USD MILLION)
                                   TABLE 122 GCC: MARKET, BY POWER RATING,  2024–2029 (USD MILLION)
                                   11.5.5.1.1 Saudi Arabia
                                                    11.5.5.1.1.1 Increased industrial activities, ambitious infrastructure projects, and growing emphasis on sustainability to drive market
                                   TABLE 123 SAUDI ARABIA: MARKET, BY POWER RATING,  2020–2023 (USD MILLION)
                                   TABLE 124 SAUDI ARABIA: MARKET, BY POWER RATING,  2024–2029 (USD MILLION)
                                   11.5.5.1.2 UAE
                                                    11.5.5.1.2.1 Robust demand across key industries such as oil & gas, construction, and logistics to drive market
                                   TABLE 125 UAE: MARKET, BY POWER RATING,  2020–2023 (USD MILLION)
                                   TABLE 126 UAE: MARKET, BY POWER RATING,  2024–2029 (USD MILLION)
                                   11.5.5.1.3 Rest of GCC
                                   TABLE 127 REST OF GCC: MARKET, BY POWER RATING,  2020–2023 (USD MILLION)
                                   TABLE 128 REST OF GCC: MARKET, BY POWER RATING,  2024–2029 (USD MILLION)
                       11.5.5.2 South Africa
                                   11.5.5.2.1 Rising exploration and production activities in oil & gas industry to create growth opportunities for market players
                                   TABLE 129 SOUTH AFRICA: MARKET, BY POWER RATING,  2020–2023 (USD MILLION)
                                   TABLE 130 SOUTH AFRICA: MARKET, BY POWER RATING,  2024–2029 (USD MILLION)
                       11.5.5.3 Rest of Middle East & Africa
                                   TABLE 131 REST OF MIDDLE EAST & AFRICA: MARKET, BY POWER RATING, 2020–2023 (USD MILLION)
                                   TABLE 132 REST OF MIDDLE EAST & AFRICA: MARKET, BY POWER RATING, 2024–2029 (USD MILLION)
     11.6 SOUTH AMERICA 
             11.6.1 IMPACT OF RECESSION ON MARKET IN SOUTH AMERICA
             11.6.2 BY POWER RATING
                       TABLE 133 SOUTH AMERICA: MARKET, BY POWER RATING,  2020–2023 (USD MILLION)
                       TABLE 134 SOUTH AMERICA: MARKET, BY POWER RATING,  2024–2029 (USD MILLION)
             11.6.3 BY PUMPING CAPACITY
                       TABLE 135 SOUTH AMERICA: MARKET, BY PUMPING CAPACITY,  2020–2023 (USD MILLION)
                       TABLE 136 SOUTH AMERICA: MARKET, BY PUMPING CAPACITY,  2024–2029 (USD MILLION)
             11.6.4 BY END USER
                       TABLE 137 SOUTH AMERICA: MARKET, BY END USER,  2020–2023 (USD MILLION)
                       TABLE 138 SOUTH AMERICA: MARKET, BY END USER,  2024–2029 (USD MILLION)
             11.6.5 BY COUNTRY
                       TABLE 139 SOUTH AMERICA: MARKET, BY COUNTRY,  2020–2023 (USD MILLION)
                       TABLE 140 SOUTH AMERICA: MARKET, BY COUNTRY,  2024–2029 (USD MILLION)
                       11.6.5.1 Brazil
                                   11.6.5.1.1 Presence of vast offshore oil reserves and expanding renewable energy industry to drive demand
                                   TABLE 141 BRAZIL: MARKET, BY POWER RATING,  2020–2023 (USD MILLION)
                                   TABLE 142 BRAZIL: MARKET, BY POWER RATING,  2024–2029 (USD MILLION)
                       11.6.5.2 Argentina
                                   11.6.5.2.1 Presence of extensive unconventional hydrocarbon reserves to drive demand
                                   TABLE 143 ARGENTINA: MARKET, BY POWER RATING,  2020–2023 (USD MILLION)
                                   TABLE 144 ARGENTINA: MARKET, BY POWER RATING,  2024–2029 (USD MILLION)
                       11.6.5.3 Chile
                                   11.6.5.3.1 High demand in mining, agriculture, and renewable energy industries to drive market
                                   TABLE 145 CHILE: MARKET, BY POWER RATING,  2020–2023 (USD MILLION)
                                   TABLE 146 CHILE: MARKET, BY POWER RATING,  2024–2029 (USD MILLION)
                       11.6.5.4 Rest of South America
                                   TABLE 147 REST OF SOUTH AMERICA: MARKET, BY POWER RATING,  2020–2023 (USD MILLION)
                                   TABLE 148 REST OF SOUTH AMERICA: MARKET, BY POWER RATING,  2024–2029 (USD MILLION)
 
12 COMPETITIVE LANDSCAPE (Page No. - 182)
     12.1 OVERVIEW 
     12.2 STRATEGIES ADOPTED BY KEY PLAYERS 
               TABLE 149 MARKET: OVERVIEW OF KEY STRATEGIES DEPLOYED BY TOP FIVE PLAYERS, JANUARY 2019–JUNE 2022
     12.3 MARKET SHARE ANALYSIS, 2022 
               TABLE 150 MARKET: DEGREE OF COMPETITION, 2022
               FIGURE 41 MARKET SHARE ANALYSIS, 2022
     12.4 REVENUE ANALYSIS, 2018–2022 
               FIGURE 42 MARKET: REVENUE ANALYSIS OF THREE KEY PLAYERS, 2018–2022
     12.5 VALUATION AND FINANCIAL METRICS, 2024 
               FIGURE 43 EV/EBITDA OF KEY VENDORS
     12.6 BRAND/PRODUCT COMPARISON 
               FIGURE 44 BRAND COMPARISON
     12.7 COMPANY EVALUATION MATRIX: KEY PLAYERS, 2023 
             12.7.1 STARS
             12.7.2 PERVASIVE PLAYERS
             12.7.3 EMERGING LEADERS
             12.7.4 PARTICIPANTS
                       FIGURE 45 MARKET: COMPANY EVALUATION MATRIX  (KEY PLAYERS), 2023
             12.7.5 COMPANY FOOTPRINT: KEY PLAYERS, 2023
                       12.7.5.1 Pumping capacity footprint
                                   TABLE 151 COMPANY PUMPING CAPACITY FOOTPRINT
                       12.7.5.2 End user footprint
                                   TABLE 152 COMPANY END USER FOOTPRINT
                       12.7.5.3 Regional footprint
                                   TABLE 153 COMPANY REGION FOOTPRINT
                       12.7.5.4 Overall footprint
                                   TABLE 154 COMPANY OVERALL FOOTPRINT
     12.8 COMPANY EVALUATION MATRIX: START-UPS/SMES, 2023 
             12.8.1 PROGRESSIVE COMPANIES
             12.8.2 RESPONSIVE COMPANIES
             12.8.3 DYNAMIC COMPANIES
             12.8.4 STARTING BLOCKS
                       FIGURE 46 MARKET: COMPANY EVALUATION MATRIX (START-UPS/SMES), 2023
             12.8.5 COMPETITIVE BENCHMARKING: START-UPS/SMES, 2023
                       12.8.5.1 List of key start-ups/SMEs
                                   TABLE 155 MARKET: LIST OF KEY START-UPS/SMES
                       12.8.5.2 Competitive benchmarking of key start-ups/SMEs
                                   TABLE 156 MARKET: COMPETITIVE BENCHMARKING OF KEY START-UPS/SMES
     12.9 COMPETITIVE SCENARIOS AND TRENDS 
             12.9.1 PRODUCT LAUNCHES
                       TABLE 157 MARKET: PRODUCT LAUNCHES,  JANUARY 2018–APRIL 2022
             12.9.2 DEALS
                       TABLE 158 MARKET: DEALS, AUGUST 2020–MARCH 2022
             12.9.3 EXPANSIONS
                       TABLE 159 MARKET: EXPANSIONS, FEBRUARY 2020–APRIL 2022
             12.9.4 OTHERS
                       TABLE 160 MARKET: OTHERS, JULY 2020
 
13 COMPANY PROFILES (Page No. - 202)
(Business overview, Products offered, Recent Developments, MNM view)*
     13.1 KEY PLAYERS 
             13.1.1 NETZSCH
                       TABLE 161 NETZSCH: COMPANY OVERVIEW
                       TABLE 162 NETZSCH: PRODUCTS OFFERED
                       TABLE 163 NETZSCH: EXPANSIONS
             13.1.2 PCM
                       TABLE 164 PCM: COMPANY OVERVIEW
                       TABLE 165 PCM: PRODUCTS OFFERED
                       TABLE 166 PCM: DEALS
                       TABLE 167 PCM: OTHERS
             13.1.3 NOV INC.
                       TABLE 168 NOV INC.: COMPANY OVERVIEW
                       FIGURE 47 NOV INC.: COMPANY SNAPSHOT
                       TABLE 169 NOV INC.: PRODUCTS OFFERED
                       TABLE 170 NOV INC.: PRODUCT LAUNCHES
                       TABLE 171 NOV INC.: DEALS
             13.1.4 CIRCOR INTERNATIONAL
                       TABLE 172 CIRCOR INTERNATIONAL: COMPANY OVERVIEW
                       FIGURE 48 CIRCOR INTERNATIONAL: COMPANY SNAPSHOT
                       TABLE 173 CIRCOR INTERNATIONAL: PRODUCTS OFFERED
                       TABLE 174 CIRCOR INTERNATIONAL: PRODUCT LAUNCHES
                       TABLE 175 CIRCOR INTERNATIONAL: EXPANSIONS
             13.1.5 SLB
                       TABLE 176 SLB: COMPANY OVERVIEW
                       FIGURE 49 SLB: COMPANY SNAPSHOT
                       TABLE 177 SLB: PRODUCTS OFFERED
                       TABLE 178 SLB: DEALS
                       TABLE 179 SLB: EXPANSIONS
                       TABLE 180 SLB: OTHERS
             13.1.6 SEEPEX GMBH (INGERSOLL RAND INC.)
                       TABLE 181 SEEPEX GMBH: COMPANY OVERVIEW
                       TABLE 182 SEEPEX GMBH: PRODUCTS OFFERED
                       TABLE 183 SEEPEX GMBH: PRODUCT LAUNCHES
                       TABLE 184 SEEPEX GMBH: DEALS
             13.1.7 CHAMPIONX
                       TABLE 185 CHAMPIONX: COMPANY OVERVIEW
                       FIGURE 50 CHAMPIONX: COMPANY SNAPSHOT
                       TABLE 186 CHAMPIONX: PRODUCTS OFFERED
                       TABLE 187 CHAMPIONX: DEALS
             13.1.8 SULZER
                       TABLE 188 SULZER: COMPANY OVERVIEW
                       FIGURE 51 SULZER: COMPANY SNAPSHOT
                       TABLE 189 SULZER: PRODUCTS OFFERED
                       TABLE 190 SULZER: PRODUCT LAUNCHES
                       TABLE 191 SULZER: DEALS
                       TABLE 192 SULZER: OTHERS
             13.1.9 XYLEM
                       TABLE 193 XYLEM: BUSINESS OVERVIEW
                       FIGURE 52 XYLEM: COMPANY SNAPSHOT, 2023
                       TABLE 194 XYLEM: PRODUCTS OFFERED
                       TABLE 195 XYLEM: PRODUCT LAUNCHES
                       TABLE 196 XYLEM: DEALS
                       TABLE 197 XYLEM: OTHERS
             13.1.10 WILO SE
                                   TABLE 198 WILO SE: COMPANY OVERVIEW
                                   FIGURE 53 WILO SE: COMPANY SNAPSHOT
                                   TABLE 199 WILO SE: PRODUCTS OFFERED
                                   TABLE 200 WILO SE: DEALS
                                   TABLE 201 WILO SE: EXPANSIONS
             13.1.11 VERDER LIQUIDS
                                   TABLE 202 VERDER LIQUIDS: COMPANY OVERVIEW
                                   TABLE 203 VERDER LIQUIDS: PRODUCTS OFFERED
                                   TABLE 204 VERDER LIQUIDS: DEALS
             13.1.12 VARISCO
                                   TABLE 205 VARISCO: COMPANY OVERVIEW
                                   TABLE 206 VARISCO: PRODUCTS OFFERED
             13.1.13 DELTA PD PUMPS
                                   TABLE 207 DELTA PD PUMPS: COMPANY OVERVIEW
                                   TABLE 208 DELTA PD PUMPS: PRODUCTS OFFERED
             13.1.14 NOVA ROTORS
                                   TABLE 209 NOVA ROTORS: COMPANY OVERVIEW
                                   TABLE 210 NOVA ROTORS: PRODUCTS OFFERED
             13.1.15 ROTO PUMPS
                                   TABLE 211 ROTO PUMPS: COMPANY OVERVIEW
                                   FIGURE 54 ROTO PUMPS: COMPANY SNAPSHOT
                                   TABLE 212 ROTO PUMPS: PRODUCTS OFFERED
             13.1.16 VOGELSANG
                                   TABLE 213 VOGELSANG: COMPANY OVERVIEW
                                   TABLE 214 VOGELSANG: PRODUCTS OFFERED
             13.1.17 INOXPA INDIA PVT. LTD.
                                   TABLE 215 INOXPA INDIA PVT. LTD.: COMPANY OVERVIEW
                                   TABLE 216 INOXPA INDIA PVT. LTD.: PRODUCTS OFFERED
             13.1.18 SHANGHAI GL ENVIRONMENTAL TECHNOLOGY CO., LTD.
                                   TABLE 217 SHANGHAI GL ENVIRONMENTAL TECHNOLOGY CO., LTD.: COMPANY OVERVIEW
                                   TABLE 218 SHANGHAI GL ENVIRONMENTAL TECHNOLOGY CO., LTD.: PRODUCTS OFFERED
             13.1.19 TAPFLO
                                   TABLE 219 TAPFLO: COMPANY OVERVIEW
                                   TABLE 220 TAPFLO: PRODUCTS OFFERED
             13.1.20 SPI PUMPS
                                   TABLE 221 SPI PUMPS: COMPANY OVERVIEW
                                   TABLE 222 SPI FLOW: PRODUCTS OFFERED
     13.2 OTHER PLAYERS 
             13.2.1 ZHEJIANG YONJOU TECHNOLOGY CO., LTD
             13.2.2 FRISTUM PUMPS INDIA PVT. LTD.
             13.2.3 PSP PUMPS
             13.2.4 SPX FLOW, INC.
             13.2.5 GEA GERMANY GMBH
*Details on Business overview, Products/Services/Solutions offered, Recent Developments, MNM view might not be captured in case of unlisted companies.
 
14 APPENDIX (Page No. - 265)
     14.1 INSIGHTS FROM INDUSTRY EXPERTS 
     14.2 DISCUSSION GUIDE 
     14.3 KNOWLEDGESTORE: MARKETSANDMARKETS’ SUBSCRIPTION PORTAL 
     14.4 CUSTOMIZATION OPTIONS 
     14.5 RELATED REPORTS 
     14.6 AUTHOR DETAILS 

This study embarked on a comprehensive process to ascertain the current size of the progressing cavity pump market. It commenced with an exhaustive secondary research phase, aimed at gathering data on the market, related sectors, and the broader industry landscape. Subsequently, the collected data, assumptions, and calculations underwent rigorous validation through primary research, involving consultations with industry experts spanning the entire value chain. The assessment of the overall market size was conducted through tailored analyses for each country. Following this, a meticulous examination of the market took place, with the data cross-referenced to estimate the sizes of various segments and sub-segments within the market. This two-phased approach, integrating both secondary and primary research methodologies, enhances the reliability and accuracy of the study's findings.

Secondary Research

Throughout this research study, an extensive array of secondary sources was leveraged, encompassing directories, databases, and reputable references such as Hoover's, Bloomberg BusinessWeek, Factiva, World Bank, the US Department of Energy (DOE), and the International Energy Agency (IEA). These sources played a pivotal role in acquiring crucial data necessary for conducting a comprehensive analysis of the global progressing cavity pump market. Encompassing technical, market-oriented, and commercial perspectives, these secondary sources significantly enriched the breadth and depth of the study. Additionally, supplementary secondary sources included annual reports, press releases, investor presentations, whitepapers, authoritative publications, articles authored by esteemed experts, information from industry associations, trade directories, and various database repositories. The utilization of a diverse range of secondary sources ensures a robust and well-informed foundation for the research study.

Primary Research

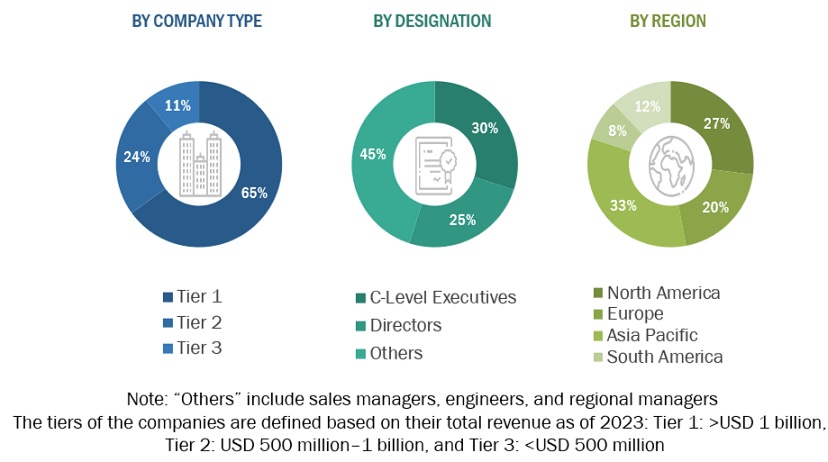
The progressing cavity pump market encompasses numerous stakeholders across its supply chain, including component manufacturers, product manufacturers/assemblers, service providers, distributors, and end-users. Industrial end-users are the primary drivers of market demand, with increasing requirements from transmission and distribution utilities also contributing significantly to market growth. On the supply side, a notable trend is the heightened demand for contracts from the industrial sector, alongside a significant prevalence of mergers and acquisitions among major industry players. To attain a comprehensive understanding of the market, both qualitatively and quantitatively, a diverse array of primary sources from both the supply and demand sides were interviewed. The breakdown provided below delineates the primary respondents who played a pivotal role in offering insights for the research study.
Progressing Cavity Pump  Market Size, and Share

To know about the assumptions considered for the study, download the pdf brochure

Market Size Estimation

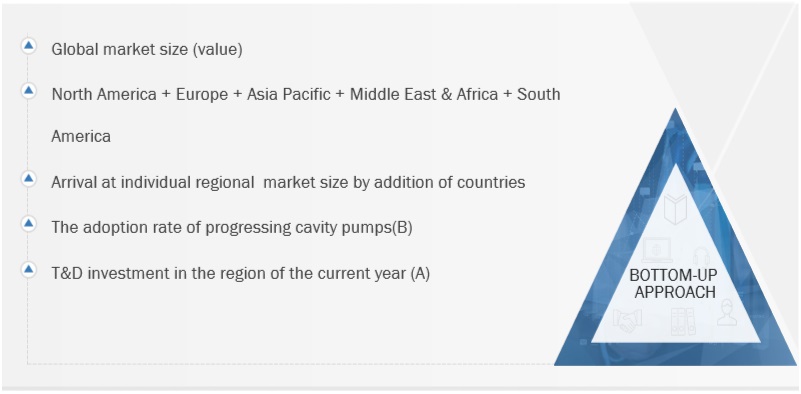
Bottom-up & Top down methodology was used to carefully assess and validate the market size for progressive cavity pumps. The dimensions of different market subsegments were determined with rigor using this procedure. The following are the main phases of the research process.

This methodology examined regional and national production data for all varieties of progressive cavity pumps.

In-depth secondary and primary research was carried out in order to fully comprehend the worldwide market environment for different kinds of cavity pumps.

Leading authorities on the development of progressive cavity pump systems, including significant OEMs and Tier I suppliers, were questioned in several primary interviews.

Qualitative elements including market drivers, limitations, opportunities, and challenges are taken into consideration when projecting and estimating market size.

Global Progressing cavity pump Market Size: Bottom-Up Approach
Progressing Cavity Pump  Market Bottom Up Approach

To know about the assumptions considered for the study, Request for Free Sample Report

Global Progressing cavity pump Market Size: Top-Down Approach

Progressing Cavity Pump  Market Top Down Approach

Data Triangulation

Using the previously mentioned approaches, which included segmenting the market into many segments and sub-segments, was the process of determining the total market size. Methods of data triangulation and market segmentation were used as appropriate to complete the thorough market analysis and acquire precise statistics for each market segment and subsegment. Data triangulation involved a detailed analysis of many variables and patterns from the supply and demand sides of the cavity pump industry environment.

Market Definition

The progressing cavity pump market encompasses the production, distribution, and utilization of progressing cavity pumps, a type of positive displacement pump characterized by a helical rotor rotating inside a fixed stator. These pumps are widely employed across various industries for the efficient handling of viscous, abrasive, and shear-sensitive fluids, making them indispensable in applications ranging from oil and gas extraction to water and wastewater treatment, food and beverage processing, chemicals and petrochemicals, mining, and construction. Key components of the market include manufacturers of pump components and complete systems, assemblers, service providers offering maintenance and repair services, distributors facilitating the supply chain, and end-users spanning industrial sectors with diverse fluid handling requirements. Market dynamics encompass factors such as technological advancements, regulatory landscape, industrial expansion, infrastructure development, and environmental considerations, all of which influence the demand for progressing cavity pumps and shape market trends on a global scale.

Key Stakeholders

  • Government Utility Providers
  • Independent Power Producers
  • Pump manufacturers
  • Power equipment and garden tool manufacturers
  • Consulting companies in the energy & power sector
  • Distribution utilities
  • Government and research organizations
  • Organizations, forums, and associations
  • Raw material suppliers
  • State and national regulatory authorities
  • Pump manufacturers, distributors, and suppliers
  • Pump original equipment manufacturers (OEMs)

Objectives of the Study

  • The progressing cavity pump market will be defined, characterised, segmented, and projected using parameters such as power rating, pumping capacity, end-user industry, product type & stage type.
  • To project market sizes for the key nations in each of the following five regions: North America, South America, Europe, Asia Pacific, the Middle East, and Africa.
  • To offer thorough insights into the elements influencing the industry's prospects, problems, opportunities, and constraints.
  • To strategically examine each subsegment's growth trends, future potential, and overall market share.
  • To assess the competitive environment for business executives and the market prospects for possible purchasers.
  • To develop strategic profiles for the top businesses after carefully examining their market shares and fundamental strengths.
  • To keep an eye on and assess competitive changes, including alliances, contracts for sales, the introduction of new products, contracts, joint ventures, expansions, and investments, in the cavity pump market as it develops.
  • This research assesses the market for advancing cavity pumps.

Available Customization

With the given market data, MarketsandMarkets offers customizations based on the company’s specific needs. The following customization options are available for the report:

Product Analysis

  • Product Matrix, which provides a detailed comparison of the product portfolio of each company

Company Information

  • Detailed analyses and profiling of additional market players (up to 5)
Custom Market Research Services

We will customize the research for you, in case the report listed above does not meet with your exact requirements. Our custom research will comprehensively cover the business information you require to help you arrive at strategic and profitable business decisions.

Request Customization

Instant Answers with GPT - Ask Now!

Ask real questions. Get complete answers !
Report Code
EP 6251
Published ON
Apr, 2024
Choose License Type
BUY NOW
  • SHARE
X
Request Customization
Speak to Analyst
Speak to Analyst
OR FACE-TO-FACE MEETING
PERSONALIZE THIS RESEARCH
  • Triangulate with your Own Data
  • Get Data as per your Format and Definition
  • Gain a Deeper Dive on a Specific Application, Geography, Customer or Competitor
  • Any level of Personalization
REQUEST A FREE CUSTOMIZATION
LET US HELP YOU!
  • What are the Known and Unknown Adjacencies Impacting the Progressing Cavity Pump Market
  • What will your New Revenue Sources be?
  • Who will be your Top Customer; what will make them switch?
  • Defend your Market Share or Win Competitors
  • Get a Scorecard for Target Partners
CUSTOMIZED WORKSHOP REQUEST
+1-888-600-6441
  • Call Us
  • +1-888-600-6441 (Corporate office hours)
  • +1-888-600-6441 (US/Can toll free)
  • +44-800-368-9399 (UK office hours)
CONNECT WITH US
ABOUT TRUST ONLINE
©2024 MarketsandMarkets Research Private Ltd. All rights reserved
DMCA.com Protection Status Website Feedback