Cultured Meat Market

Cultured Meat Market Size, Share, Share, Industry Growth, Trends Report by Source (Poultry, Beef, Seafood, Pork, Duck), End Use (Nuggets, Burgers, Meatballs, Sausages, Hot Dogs), and Region (North America, Europe, Asia Pacific, South America, Middle East & Africa) - Global Forecast to 2034

Report Code: FB 6247 Nov, 2023, by marketsandmarkets.com

Cultured Meat Market / Lab-Grown Meat Industry Size, Share & Trends Report - 2034

The global cultured meat market is predicted to grow at a compound annual growth rate of 16.5% from 2028 to 2034 to reach USD 1.1 billion by 2034 from a projection of $0.2 billion in 2023. In addition since 2023, the market is projected to grow at a CAGR of 16.1% over the next five years period. Consumers are increasingly inclined to seek alternatives that bypass the ethical dilemmas and cruelty often linked to raising and slaughtering animals for meat, making cultured meat an appealing choice.

Additionally, health and safety concerns have spurred the market's expansion. Modern consumers are more health-conscious than ever, and they seek meat products free from antibiotics, hormones, and the risks of foodborne pathogens. Cultured meat, produced in a controlled and hygienic environment, aligns with these preferences, thus driving demand. Furthermore, the market is addressing global food security challenges. With a growing global population, traditional meat production methods face limitations in meeting the increasing demand for meat. Cultured meat technology offers a sustainable and scalable solution to ensure a consistent meat supply, helping to alleviate food shortages and price fluctuations.
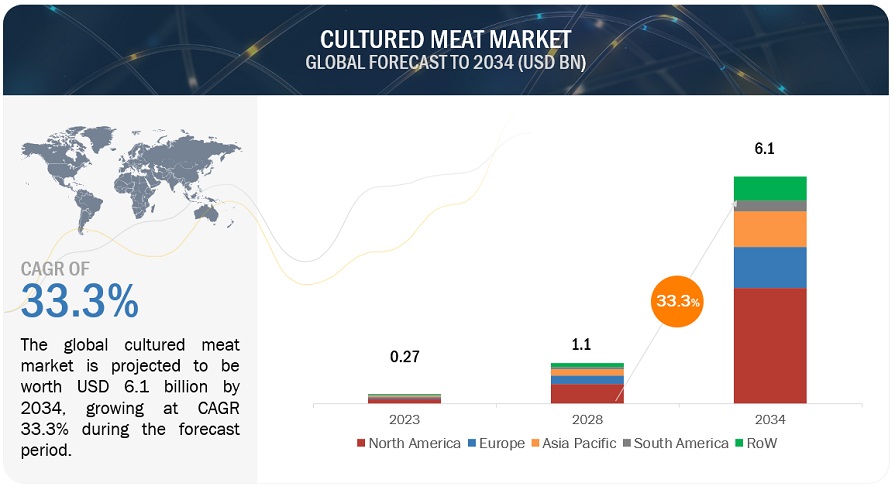
Cultured Meat Market Size, Share

To know about the assumptions considered for the study, Request for Free Sample Report

Cultured Meat Market Dynamics

Drivers:Increasing demand for alternative protein

The surging demand for alternative protein sources is a pivotal driver behind the burgeoning market growth of cultured meat. As consumers increasingly seek sustainable and ethical options, the allure of alternative proteins, like cultured meat, becomes evident. This demand is propelled by a convergence of factors, including environmental concerns linked to conventional livestock farming, the depletion of natural resources, and rising greenhouse gas emissions. These issues have led consumers to explore alternatives that can alleviate the detrimental impact of traditional meat production on the planet.

Furthermore, health-conscious consumers are turning to alternative proteins for their nutritional benefits, eschewing the use of antibiotics, hormones, and the risk of foodborne illnesses associated with conventional meat. Additionally, a growing market for plant-based diets and flexitarianism reflects a broader shift in consumer preferences towards protein sources that are not derived from animals. This rising demand for alternative proteins is creating a fertile ground for the cultured meat market to thrive, offering a more sustainable, ethical, and health-focused choice in the evolving landscape of food production.

Restraints: Stringent regulatory environment

The market is encountering significant growth limitations due to a stringent regulatory environment. Regulatory bodies worldwide are grappling with the novel nature of cultured meat production, often lacking specific guidelines to govern this emerging industry. This regulatory uncertainty poses challenges for market players in terms of securing approvals, navigating compliance hurdles, and ensuring the safety and quality of cultured meat products. The lengthy and intricate approval processes add substantial time and cost to bringing cultured meat to market, inhibiting its scalability and market competitiveness.

Additionally, concerns related to labeling, safety standards, and the classification of cultured meat further complicate the regulatory landscape. To unlock the full potential of the cultured meat market, collaboration between industry stakeholders and regulatory bodies is imperative to establish clear and harmonized guidelines that ensure both consumer safety and industry innovation.

Opportunities: High per capita meat consumption and imports in emerging southeast asian economies

The high per capita meat consumption and significant meat imports in emerging Southeast Asian economies are presenting a promising opportunity in the market. As these economies continue to grow, their rising middle-class populations are driving increased demand for meat, placing substantial pressure on conventional livestock production. Cultured meat can fill this gap, offering a sustainable and locally-produced alternative to traditional meat sources.

Moreover, the reliance on meat imports in these regions opens the door for cost-effective and domestically-produced cultured meat, reducing dependency on foreign suppliers and improving food security. Cultured meat's potential to align with consumer preferences for ethical and sustainable food choices makes it well-positioned to cater to the meat demand in these economies while addressing environmental and resource constraints. This presents a golden opportunity for cultured meat producers to establish a foothold in these dynamic and burgeoning cultured meat markets.
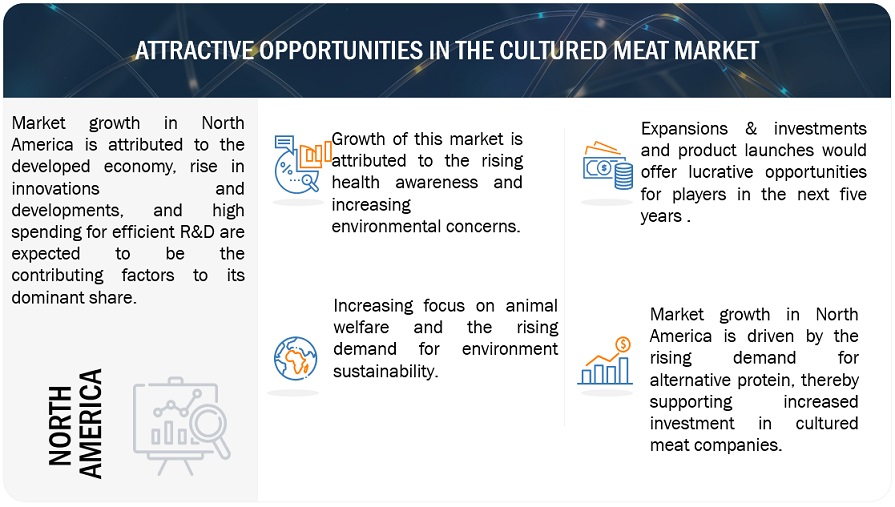
Cultured Meat Market Attractive Opportunities

To know about the assumptions considered for the study, download the pdf brochure

Challenges: Skeptism among consumers

Skepticism among consumers represents a significant challenge in the cultured meat market. Despite its potential benefits, many consumers remain uncertain about this novel food source. The unfamiliarity and perceived "unnatural" production process can lead to distrust and resistance. Concerns related to taste, safety, and the use of novel technology can further contribute to consumer skepticism. Additionally, cultural and emotional attachments to traditional meat production can make it difficult to convince consumers to make the switch to cultured meat. To address this challenge, the cultured meat industry must invest in education, transparency, and effective communication to demystify the production process, emphasize the sustainability and ethical aspects, and conduct rigorous safety testing. Overcoming consumer skepticism is vital for the widespread acceptance of cultured meat as a viable and sustainable alternative to traditional meat sources.

Cultured Meat Market Ecosystem
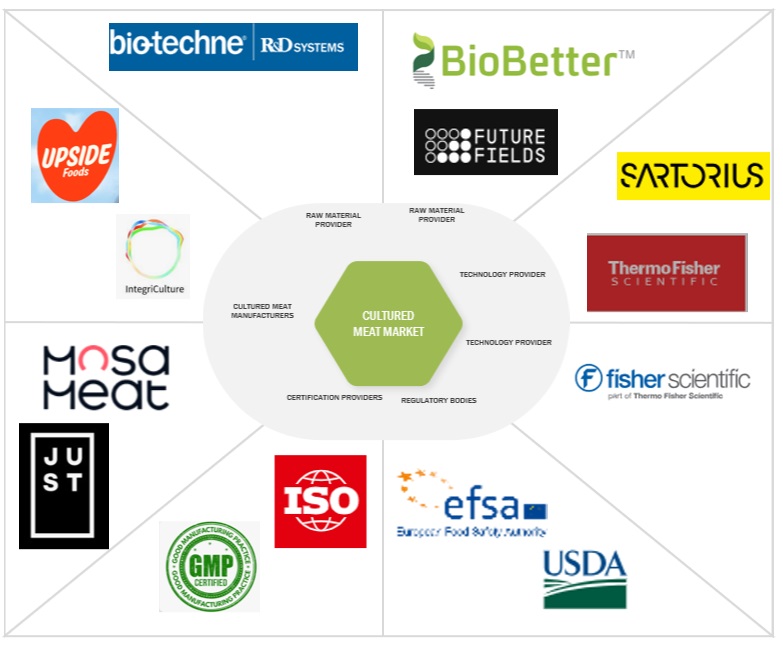
Cultured Meat Market Ecosystem

Source Insights:

Based on source, the raw material segment is estimated to hold the largest market share during the forecast period of the cultured meat market.

Poultry, particularly chicken, is one of the most widely consumed and versatile meats globally. Its popularity makes it a prime candidate for disruption within the meat market, as it addresses the increasing demand for animal protein while minimizing the environmental and ethical concerns associated with conventional poultry farming. Additionally, the production of poultry cultured meat is relatively more straightforward and cost-effective compared to other meat types, such as beef, which requires more complex tissue engineering processes. This makes poultry cultured meat a practical choice for scaling up production and achieving cost competitiveness.

Moreover, poultry cultured meat has a broad range of applications, including nuggets, burgers, sausages, and more, aligning with consumer preferences and making it accessible to a wide audience. These factors, combined with the versatility of poultry in various global cuisines, position it as the leader in the market, both in terms of market share and consumer acceptance.

Regional Insights:

North America Holds The Largest Share of the Cultured Meat Market

North America is poised to claim the largest share (50.89%) in the market in 2034 due to a combination of factors. The region benefits from a strong convergence of technological innovation and consumer interest in sustainability and ethical eating. The United States, in particular, has witnessed substantial investments in cultured meat startups, fostering research and development.

Additionally, North American consumers exhibit a growing appetite for plant-based and alternative protein options, driven by health consciousness and environmental concerns. This aligns well with the sustainable and cruelty-free aspects of cultured meat. Furthermore, regulatory agencies in the region have shown openness to fostering innovation in the food sector, facilitating a more favorable environment for cultured meat companies. This confluence of technological advancement, consumer demand, and regulatory support positions North America as a frontrunner in the market
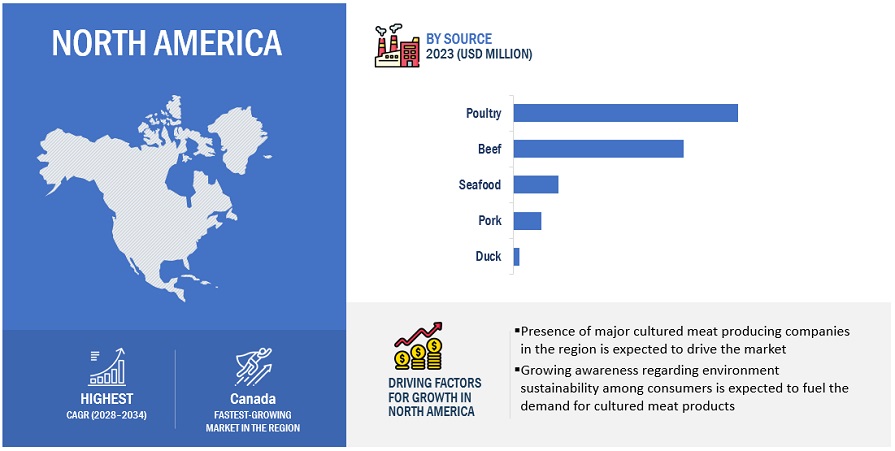
North America Cultured Meat Market

Top Companies in the Cultured Meat Market

The key players in this market include Mosa Meat (Netherlands), UPSIDE FOODS (US), JUST, Inc. (US), and Integriculture Inc. (Japan), and BioCraft, Inc (US)

Scope of the Cultured Meat Market Report

This research report categorizes the market based on Product, Type, Consumption, Distribution Channel, Freezing technique, and Region.

Report Metric

Details

Market valuation in 2023

USD 0.2 billion

Revenue forecast in 2028

USD 0.4 billion

Revenue forecast in 2034

USD 1.1 billion

Progress rate

CAGR of 16.5% from 2028 to 2034

Segments Covered

By Source, End Use, and Region

Regions covered

North America, Europe, Asia Pacific, South America, and Middle East & Africa

Market driving factors

Increasing demand for alternative protein

Opportunities

The high per capita meat consumption and substantial meat imports in emerging Southeast Asian economies are creating a favorable opportunity in the market.

Largest growing region

North America

Companies studied

  • Mosa Meat (Netherlands)
  • UPSIDE FOODS (US)
  • Eat Just Inc., (US)
  • IntegriCulture Inc (Japan)
  • Mewery (Czech republic)
  • BioCraft,Inc (US)
  • Finless Foods (US)
  • avantmeats (China)
  • BlueNalu (US)
  • Fork & Good (US)
  • And more

Target Audience of Cultured Meat Market

  • cultured meat producers, suppliers, distributors, importers, and exporters
  • Large-scale cultured meat manufacturers and research organizations
  • Related government authorities, commercial research & development (R&D) institutions, FDA, EFSA, USDA, FSANZ, EUFIC government agencies, and other regulatory bodies
  • Food product consumers
  • Commercial research & development (R&D) institutions and financial institutions

Cultured Meat Market Segmentation:

Aspect

Details

By Source

  • Poultry
  • Beef
  • Pork
  • Seafood
  • Duck

By End Use

  • Nuggets
  • Burgers
  • Meatballs
  • Sausages
  • Others

By Region

  • North America
  • Europe
  • Asia Pacific
  • South America
  • Middle East & Africa

Recent Developments in the Cultured Meat Market

  • In September 2023, Eat Just Inc., announced a strategic partnership with Halal Products Development Company (HDPC), wholly owned by the Public Investment Fund of Saudi Arabia .  Through the collaboration, HPDC would provide advisory solutions to help Eat Just obtain “Halal” certification and approvals needed to operate as a Halal food distributor. The partnership would also leverage HPDC’s services to help Eat Just develop a sustainable strategy to enter the Halal market, paving the way to export its products to both local and regional markets.
  • In May 2022, IntegriCulture Inc. successfully secured USD 7 million in funding from a group of 12 investors during its Series A funding round, significantly bolstering their financial resources. This latest round pushed their total funding to approximately USD 16.4 million. IntegriCulture Inc. intended to use the funds obtained to create an infrastructure platform for cellular agriculture that would be accessible to organisations of all sizes and industries.
  • In December 2020, Mosa Meat announced an increased investment from Bell Food Group, a prominent European meat and convenience food processor. This funding would facilitate the expansion of Mosa Meat's cultured meat production. Additionally, it would support the construction of Mosa Meat's pilot production facility and the advancement and scaling of its technology.

Frequently Asked Questions (FAQ):

To speak to our analyst for a discussion on the above findings, click Speak to Analyst

TABLE OF CONTENTS
 
1 INTRODUCTION (Page No. - 34)
    1.1 STUDY OBJECTIVES 
    1.2 CULTURED MEAT MARKET DEFINITION 
    1.3 STUDY SCOPE 
           FIGURE 1 MARKET SEGMENTATION
           1.3.1 REGIONS COVERED
                    FIGURE 2 REGIONAL SEGMENTATION
    1.4 INCLUSIONS & EXCLUSIONS 
    1.5 YEARS CONSIDERED 
    1.6 CURRENCY CONSIDERED 
           TABLE 1 USD EXCHANGE RATES CONSIDERED, 2019–2022
    1.7 UNIT CONSIDERED 
    1.8 STAKEHOLDERS 
    1.9 SUMMARY OF CHANGES 
           1.9.1 RECESSION IMPACT
 
2 RESEARCH METHODOLOGY (Page No. - 39)
    2.1 RESEARCH DATA 
           FIGURE 3 CULTURED MEAT MARKET: RESEARCH DESIGN
           2.1.1 SECONDARY DATA
                    2.1.1.1 Key data from secondary sources
           2.1.2 PRIMARY DATA
                    2.1.2.1 Key data from primary sources
                    2.1.2.2 Breakdown of primaries
                    2.1.2.3 Key primary insights
    2.2 MARKET SIZE ESTIMATION 
           2.2.1 APPROACH ONE: BOTTOM-UP (BASED ON SOURCE, BY REGION)
           2.2.2 APPROACH TWO: TOP-DOWN (BASED ON GLOBAL MARKET)
    2.3 DATA TRIANGULATION 
           FIGURE 4 DATA TRIANGULATION METHODOLOGY
    2.4 STUDY ASSUMPTIONS 
    2.5 STUDY LIMITATIONS AND RISK ASSESSMENT 
    2.6 RECESSION IMPACT ANALYSIS 
           2.6.1 MACRO INDICATORS OF RECESSION
                    FIGURE 5 INDICATORS OF RECESSION
                    FIGURE 6 WORLD INFLATION RATE, 2011–2021
                    FIGURE 7 GLOBAL GROSS DOMESTIC PRODUCT, 2011–2021 (USD TRILLION)
                    FIGURE 8 RECESSION INDICATORS AND THEIR IMPACT ON THE MARKET
 
3 EXECUTIVE SUMMARY (Page No. - 50)
    TABLE 2 CULTURED MEAT MARKET SNAPSHOT, 2028 VS. 2034 (NORMAL SCENARIO) 
    FIGURE 9 MARKET SIZE, BY SOURCE (NORMAL SCENARIO),  2028 VS. 2034 (USD MILLION) 
    FIGURE 10 MARKET SIZE, BY END USE (NORMAL SCENARIO),  2028 VS. 2034 (USD MILLION) 
    FIGURE 11 REGION-WISE MARKET SHARE AND CAGR  (NORMAL SCENARIO), 2023 
 
4 PREMIUM INSIGHTS (Page No. - 54)
    4.1 ATTRACTIVE GROWTH OPPORTUNITIES IN THE MARKET 
           FIGURE 12 GROWING HEALTH CONCERNS RELATED TO TRADITIONAL MEAT AND SHORTFALL IN SUPPLY OF MEAT PRODUCTS TO DRIVE THE MARKET GROWTH IN NORMAL SCENARIO
    4.2 MARKET, BY REGION, 2028 VS. 2034  (USD MILLION) (NORMAL SCENARIO) 
           FIGURE 13 NORTH AMERICA PROJECTED TO DOMINATE THE MARKET  BY 2034
    4.3 MARKET, BY END USE, 2028 VS. 2034  (USD MILLION) (NORMAL SCENARIO) 
           FIGURE 14 NUGGETS SEGMENT TO DOMINATE MARKET DURING  FORECAST PERIOD
    4.4 EUROPE: MARKET, BY SOURCE,  2028 (NORMAL SCENARIO) 
           FIGURE 15 POULTRY SEGMENT PROJECTED TO DOMINATE MARKET BY 2028
    4.5 MARKET, BY KEY COUNTRY (NORMAL SCENARIO) 
           FIGURE 16 CANADA PROJECTED TO BE FASTEST-GROWING COUNTRY-LEVEL MARKET FOR CULTURED MEAT IN NORMAL SCENARIO
 
5 MARKET OVERVIEW (Page No. - 57)
    5.1 INTRODUCTION 
    5.2 MARKET DYNAMICS 
           FIGURE 17 CULTURED MEAT MARKET DYNAMICS
    5.3 MACROECONOMIC INDICATORS 
           5.3.1 CULTURED MEAT TO BE RESILIENT AND SUSTAINABLE PROTEIN SOURCE
           5.3.2 CRUCIAL ROLE OF INVESTMENT TRENDS IN CULTURED MEAT INNOVATION
           5.3.3 DRIVERS
                    5.3.3.1 Increasing demand for alternative protein
                    5.3.3.2 Technological advancements in cellular agriculture
                    5.3.3.3 Enhanced food safety
                    5.3.3.4 Investments by key industry giants
                    5.3.3.5 Environmental sustainability
                    5.3.3.6 Focus on animal welfare
                    5.3.3.7 Health benefits offered by cultured meat
           5.3.4 RESTRAINTS
                    5.3.4.1 Stringent regulatory environment
                    5.3.4.2 High setup cost
           5.3.5 OPPORTUNITIES
                    5.3.5.1 High per capita meat consumption and imports in emerging Southeast Asian economies
                               FIGURE 18 PROJECTED PER CAPITA POULTRY CONSUMPTION IN SOUTHEAST  ASIAN COUNTRIES, 2021–2029
           5.3.6 CHALLENGES
                    5.3.6.1 Skepticism among consumers
                               TABLE 3 SURVEY CONDUCTED ON “ATTITUDES TO IN VITRO MEAT: A SURVEY OF POTENTIAL CONSUMERS IN THE UNITED STATES”
                    5.3.6.2 Increased demand for plant-based protein
 
6 INDUSTRY TRENDS (Page No. - 65)
    6.1 INTRODUCTION 
    6.2 VALUE CHAIN ANALYSIS 
           FIGURE 19 CULTURED MEAT MARKET: VALUE CHAIN ANALYSIS
           6.2.1 CELL SOURCING
           6.2.2 CELL CULTIVATION
           6.2.3 CELL DIFFERENTIATION
           6.2.4 TISSUE STRUCTURING
           6.2.5 POST-PRODUCTION PROCESSING
           6.2.6 QUALITY CONTROL
           6.2.7 PACKAGING & DISTRIBUTION
    6.3 TRENDS/DISRUPTIONS IMPACTING CUSTOMERS’ BUSINESSES 
           FIGURE 20 REVENUE SHIFT FOR THE MARKET
    6.4 TARIFF AND REGULATORY LANDSCAPE 
           TABLE 4 NORTH AMERICA: LIST OF REGULATORY BODIES, GOVERNMENT AGENCIES, AND OTHER ORGANIZATIONS
           TABLE 5 EUROPE: LIST OF REGULATORY BODIES, GOVERNMENT AGENCIES, AND OTHER ORGANIZATIONS
           TABLE 6 ASIA PACIFIC: LIST OF REGULATORY BODIES, GOVERNMENT AGENCIES,  AND OTHER ORGANIZATIONS
    6.5 REGULATORY FRAMEWORK 
           6.5.1 NORTH AMERICA
                    6.5.1.1 US
                    6.5.1.2 Canada
           6.5.2 EUROPE
           6.5.3 ASIA PACIFIC
    6.6 PATENT ANALYSIS 
           FIGURE 21 NUMBER OF PATENTS GRANTED FOR CULTURED MEAT IN GLOBAL MARKET, 2013–2022
           FIGURE 22 REGIONAL ANALYSIS OF PATENTS GRANTED IN CULTURED MEAT MARKET
           TABLE 7 LIST OF MAJOR PATENTS PERTAINING TO THE MARKET, 2013–2022
    6.7 TRADE ANALYSIS 
           TABLE 8 IMPORT VALUE OF CULTURED MEAT FOR KEY COUNTRIES, 2022 (USD THOUSAND)
           TABLE 9 EXPORT VALUE OF CULTURED MEAT FOR KEY COUNTRIES, 2022 (USD THOUSAND)
    6.8 PRICING ANALYSIS 
           6.8.1 INDICATIVE AVERAGE SELLING PRICE TREND ANALYSIS
                    TABLE 10 NUGGETS: GLOBAL MARKET, BY REGION, 2020–2022 (USD PER KG)
                    TABLE 11 BURGERS: GLOBAL MARKET, BY REGION, 2020–2022 (USD PER KG)
                    TABLE 12 MEATBALLS: GLOBAL MARKET, BY REGION, 2020–2022 (USD PER KG)
    6.9 MARKET: ECOSYSTEM MARKET MAP 
           6.9.1 DEMAND SIDE
           6.9.2 SUPPLY SIDE
                    FIGURE 23 CULTURED MEAT: MARKET MAP
                    TABLE 13 CULTURED MEAT MARKET: ECOSYSTEM
    6.10 TECHNOLOGY ANALYSIS 
           6.10.1 SCAFFOLDING TECHNOLOGY
           6.10.2 3D BIOPRINTING
    6.11 CASE STUDIES 
           6.11.1 REVOLUTIONIZING CELL CULTURE WITH ETHICAL AND FBS-FREE SOLUTIONS
    6.12 PORTER’S FIVE FORCES ANALYSIS 
                    TABLE 14 MARKET: PORTER’S FIVE FORCES ANALYSIS
           6.12.1 INTENSITY OF COMPETITIVE RIVALRY
           6.12.2 BARGAINING POWER OF SUPPLIERS
           6.12.3 BARGAINING POWER OF BUYERS
           6.12.4 THREAT OF SUBSTITUTES
           6.12.5 THREAT OF NEW ENTRANTS
    6.13 KEY STAKEHOLDERS AND BUYING CRITERIA 
           6.13.1 KEY STAKEHOLDERS IN BUYING PROCESS
           6.13.2 KEY STAKEHOLDERS AND BUYING CRITERIA
                    FIGURE 24 INFLUENCE OF STAKEHOLDERS ON BUYING CULTURED MEAT FOR DIFFERENT END USES
                    TABLE 15 INFLUENCE OF STAKEHOLDERS ON BUYING PROCESS FOR CULTURED MEAT,  BY END USE (%)
           6.13.3 BUYING CRITERIA
                    TABLE 16 KEY CRITERIA FOR SELECTING SUPPLIER/VENDOR
                    FIGURE 25 KEY CRITERIA FOR SELECTING SUPPLIERS/VENDORS
    6.14 KEY CONFERENCES AND EVENTS, 2023–2024 
                    TABLE 17 KEY CONFERENCES AND EVENTS IN THE MARKET, 2023–2024
 
7 CULTURED MEAT MARKET, BY SOURCE (Page No. - 86)
    7.1 INTRODUCTION 
           FIGURE 26 MARKET SIZE IN OPTIMISTIC SCENARIO, BY SOURCE,  2028 VS. 2034 (USD MILLION)
           FIGURE 27 MARKET SIZE IN NORMAL SCENARIO, BY SOURCE,  2028 VS. 2034 (USD MILLION)
           FIGURE 28 MARKET SIZE IN PESSIMISTIC SCENARIO, BY SOURCE,  2028 VS. 2034 (USD MILLION)
           TABLE 18 MARKET IN OPTIMISTIC SCENARIO, BY SOURCE,  2023–2034 (USD MILLION)
           TABLE 19 MARKET IN OPTIMISTIC SCENARIO, BY SOURCE, 2023–2034 (TONS)
           TABLE 20 MARKET IN NORMAL SCENARIO, BY SOURCE,  2023–2034 (USD MILLION)
           TABLE 21 MARKET IN NORMAL SCENARIO, BY SOURCE, 2023–2034 (TONS)
           TABLE 22 MARKET IN PESSIMISTIC SCENARIO, BY SOURCE,  2023–2034 (USD MILLION)
           TABLE 23 MARKET IN PESSIMISTIC SCENARIO, BY SOURCE, 2023–2034 (TONS)
    7.2 POULTRY 
           7.2.1 HIGH DEMAND FROM QUICK-SERVICE RESTAURANTS TO DRIVE  DEMAND FOR CULTURED POULTRY MEAT PRODUCTS
                    TABLE 24 CULTURED POULTRY MEAT MARKET IN OPTIMISTIC SCENARIO, BY REGION,  2023–2034 (USD MILLION)
                    TABLE 25 CULTURED POULTRY MEAT MARKET IN OPTIMISTIC SCENARIO, BY REGION,  2023–2034 (TONS)
                    TABLE 26 CULTURED POULTRY MEAT MARKET IN NORMAL SCENARIO, BY REGION,  2023–2034 (USD MILLION)
                    TABLE 27 CULTURED POULTRY MEAT MARKET IN NORMAL SCENARIO, BY REGION,  2023–2034 (TONS)
                    TABLE 28 CULTURED POULTRY MEAT MARKET IN PESSIMISTIC SCENARIO, BY REGION,  2023–2034 (USD MILLION)
                    TABLE 29 CULTURED POULTRY MEAT MARKET IN PESSIMISTIC SCENARIO, BY REGION, 2023–2034 (TONS)
    7.3 PORK 
           7.3.1 CULTURED PORK MARKET TO THRIVE AMID GLOBAL DEMAND SURGE AND SUSTAINABILITY CONCERNS
                    TABLE 30 CULTURED PORK MEAT MARKET IN OPTIMISTIC SCENARIO, BY REGION,  2023–2034 (USD MILLION)
                    TABLE 31 CULTURED PORK MEAT MARKET IN OPTIMISTIC SCENARIO, BY REGION,  2023–2034 (TONS)
                    TABLE 32 CULTURED PORK MEAT MARKET IN NORMAL SCENARIO, BY REGION,  2023–2034 (USD MILLION)
                    TABLE 33 CULTURED PORK MEAT MARKET IN NORMAL SCENARIO, BY REGION,  2023–2034 (TONS)
                    TABLE 34 CULTURED PORK MEAT MARKET IN PESSIMISTIC SCENARIO, BY REGION,  2023–2034 (USD MILLION)
                    TABLE 35 CULTURED PORK MEAT MARKET IN PESSIMISTIC SCENARIO, BY REGION,  2023–2034 (TONS)
    7.4 BEEF 
           7.4.1 RISING DEMAND FOR SUSTAINABLE & ETHICAL PROTEIN TO DRIVE CULTURED BEEF MARKET GROWTH
                    TABLE 36 CULTURED BEEF MEAT MARKET IN OPTIMISTIC SCENARIO, BY REGION,  2023–2034 (USD MILLION)
                    TABLE 37 CULTURED BEEF MEAT MARKET IN OPTIMISTIC SCENARIO, BY REGION,  2023–2034 (TONS)
                    TABLE 38 CULTURED BEEF MEAT MARKET IN NORMAL SCENARIO, BY REGION,  2023–2034 (USD MILLION)
                    TABLE 39 CULTURED BEEF MEAT MARKET IN NORMAL SCENARIO, BY REGION,  2023–2034 (TONS)
                    TABLE 40 CULTURED BEEF MEAT MARKET IN PESSIMISTIC SCENARIO, BY REGION,  2023–2034 (USD MILLION)
                    TABLE 41 CULTURED BEEF MEAT MARKET IN PESSIMISTIC SCENARIO, BY REGION,  2023–2034 (TONS)
    7.5 SEAFOOD 
           7.5.1 RISING CONSUMPTION OF FISH MAW TO CONTRIBUTE TO CULTURED MEAT MARKET GROWTH
                    TABLE 42 CULTURED SEAFOOD MEAT MARKET IN OPTIMISTIC SCENARIO, BY REGION,  2023–2034 (USD MILLION)
                    TABLE 43 CULTURED SEAFOOD MEAT MARKET IN OPTIMISTIC SCENARIO, BY REGION,  2023–2034 (TONS)
                    TABLE 44 CULTURED SEAFOOD MEAT MARKET IN NORMAL SCENARIO, BY REGION,  2023–2034 (USD MILLION)
                    TABLE 45 CULTURED SEAFOOD MEAT MARKET IN NORMAL SCENARIO, BY REGION,  2023–2034 (TONS)
                    TABLE 46 CULTURED SEAFOOD MEAT MARKET IN PESSIMISTIC SCENARIO, BY REGION,  2023–2034 (USD MILLION)
                    TABLE 47 CULTURED SEAFOOD MEAT MARKET IN PESSIMISTIC SCENARIO, BY REGION,  2023–2034 (TONS)
    7.6 DUCK 
           7.6.1 HIGH AVAILABILITY OF DUCK MEAT IN SUPERMARKETS TO DRIVE GROWTH
                    TABLE 48 CULTURED DUCK MEAT MARKET IN OPTIMISTIC SCENARIO, BY REGION,  2023–2034 (USD MILLION)
                    TABLE 49 CULTURED DUCK MEAT MARKET IN OPTIMISTIC SCENARIO, BY REGION,  2023–2034 (TONS)
                    TABLE 50 CULTURED DUCK MEAT MARKET IN NORMAL SCENARIO, BY REGION,  2023–2034 (USD MILLION)
                    TABLE 51 CULTURED DUCK MEAT MARKET IN NORMAL SCENARIO, BY REGION,  2023–2034 (TONS)
                    TABLE 52 CULTURED DUCK MEAT MARKET IN PESSIMISTIC SCENARIO, BY REGION,  2023–2034 (USD MILLION)
                    TABLE 53 CULTURED DUCK MEAT MARKET IN PESSIMISTIC SCENARIO, BY REGION,  2023–2034 (TONS)
 
8 CULTURED MEAT MARKET, BY END USE (Page No. - 105)
    8.1 INTRODUCTION 
           FIGURE 29 MARKET SIZE IN NORMAL SCENARIO, BY END USE,  2028 VS. 2034 (USD MILLION)
           FIGURE 30 MARKET SIZE IN OPTIMISTIC SCENARIO, BY END USE,  2028 VS. 2034 (USD MILLION)
           FIGURE 31 MARKET SIZE IN PESSIMISTIC SCENARIO, BY END USE,  2028 VS. 2034 (USD MILLION)
           TABLE 54 MARKET IN OPTIMISTIC SCENARIO, BY END USE,  2023–2034 (USD MILLION)
           TABLE 55 MARKET IN OPTIMISTIC SCENARIO, BY END USE,  2023–2034 (T0NS)
           TABLE 56 MARKET IN NORMAL SCENARIO, BY END USE,  2023–2034 (USD MILLION)
           TABLE 57 MARKET IN NORMAL SCENARIO, BY END USE, 2023–2034 (TONS)
           TABLE 58 MARKET IN PESSIMISTIC SCENARIO, BY END USE,  2023–2034 (USD MILLION)
           TABLE 59 MARKET IN PESSIMISTIC SCENARIO, BY END USE,  2023–2034 (TONS)
    8.2 NUGGETS 
           8.2.1 COST-EFFICIENCY AND REGULATORY ACCEPTANCE TO DRIVE MARKET GROWTH
                    TABLE 60 NUGGETS: MARKET IN OPTIMISTIC SCENARIO, BY REGION,  2023–2034 (USD MILLION)
                    TABLE 61 NUGGETS: MARKET IN OPTIMISTIC SCENARIO, BY REGION,  2023–2034 (TONS)
                    TABLE 62 NUGGETS: MARKET IN NORMAL SCENARIO, BY REGION,  2023–2034 (USD MILLION)
                    TABLE 63 NUGGETS: MARKET IN NORMAL SCENARIO, BY REGION,  2023–2034 (TONS)
                    TABLE 64 NUGGETS: MARKET IN PESSIMISTIC SCENARIO, BY REGION,  2023–2034 (USD MILLION)
                    TABLE 65 NUGGETS: MARKET IN PESSIMISTIC SCENARIO, BY REGION,  2023–2034 (TONS)
    8.3 BURGERS 
           8.3.1 INNOVATIONS AND SCALING EFFORTS TO DRIVE MARKET GROWTH
                    TABLE 66 BURGERS: CULTURED MEAT MARKET IN OPTIMISTIC SCENARIO, BY REGION,  2023–2034 (USD MILLION)
                    TABLE 67 BURGERS: MARKET IN OPTIMISTIC SCENARIO, BY REGION,  2023–2034 (TONS)
                    TABLE 68 BURGERS: MARKET IN NORMAL SCENARIO, BY REGION,  2023–2034 (USD MILLION)
                    TABLE 69 BURGERS: MARKET IN NORMAL SCENARIO, BY REGION,  2023–2034 (TONS)
                    TABLE 70 BURGERS: MARKET IN PESSIMISTIC SCENARIO, BY REGION,  2023–2034 (USD MILLION)
                    TABLE 71 BURGERS: MARKET IN PESSIMISTIC SCENARIO, BY REGION,  2023–2034 (TONS)
    8.4 MEATBALLS 
           8.4.1 COMBINATION OF ENVIRONMENTAL AWARENESS, TECHNOLOGICAL PROGRESS, AND CULINARY VERSATILITY TO PROPEL MARKET GROWTH
                    TABLE 72 MEATBALLS: MARKET IN OPTIMISTIC SCENARIO, BY REGION,  2023–2034 (USD MILLION)
                    TABLE 73 MEATBALLS: MARKET IN OPTIMISTIC SCENARIO, BY REGION,  2023–2034 (TONS)
                    TABLE 74 MEATBALLS: MARKET IN NORMAL SCENARIO, BY REGION,  2023–2034 (USD MILLION)
                    TABLE 75 MEATBALLS: MARKET IN NORMAL SCENARIO, BY REGION,  2023–2034 (TONS)
                    TABLE 76 MEATBALLS: MARKET IN PESSIMISTIC SCENARIO, BY REGION,  2023–2034 (USD MILLION)
                    TABLE 77 MEATBALLS: MARKET IN PESSIMISTIC SCENARIO, BY REGION,  2023–2034 (TONS)
    8.5 SAUSAGES 
           8.5.1 INCREASED DEMAND FOR CLEAN MEAT PRODUCTS TO DRIVE MARKET GROWTH
                    TABLE 78 SAUSAGES: MARKET IN OPTIMISTIC SCENARIO, BY REGION,  2023–2034 (USD MILLION)
                    TABLE 79 SAUSAGES: MARKET IN OPTIMISTIC SCENARIO, BY REGION,  2023–2034 (TONS)
                    TABLE 80 SAUSAGES: MARKET IN NORMAL SCENARIO, BY REGION,  2023–2034 (USD MILLION)
                    TABLE 81 SAUSAGES: MARKET IN NORMAL SCENARIO, BY REGION,  2023–2034 (TONS)
                    TABLE 82 SAUSAGES: MARKET IN PESSIMISTIC SCENARIO, BY REGION,  2023–2034 (USD MILLION)
                    TABLE 83 SAUSAGES: MARKET IN PESSIMISTIC SCENARIO,  BY REGION, 2023–2034 (TONS)
    8.6 HOT DOGS 
           8.6.1 CULTURED HOT DOG MARKET TO GROW AMID GLOBAL MEAT DEMAND AND SUSTAINABILITY CONCERNS
                    TABLE 84 HOT DOGS: CULTURED MEAT MARKET IN OPTIMISTIC SCENARIO, BY REGION,  2023–2034 (USD MILLION)
                    TABLE 85 HOT DOGS: MARKET IN OPTIMISTIC SCENARIO, BY REGION,  2023–2034 (TONS)
                    TABLE 86 HOT DOGS: MARKET IN NORMAL SCENARIO, BY REGION,  2023–2034 (USD MILLION)
                    TABLE 87 HOT DOGS: MARKET IN NORMAL SCENARIO, BY REGION,  2023–2034 (TONS)
                    TABLE 88 HOT DOGS: MARKET IN PESSIMISTIC SCENARIO, BY REGION,  2023–2034 (USD MILLION)
                    TABLE 89 HOT DOGS: MARKET IN PESSIMISTIC SCENARIO, BY REGION,  2023–2034 (TONS)
    8.7 OTHER END USES 
           TABLE 90 OTHER END USES: MARKET IN OPTIMISTIC SCENARIO, BY REGION, 2023–2034 (USD MILLION)
           TABLE 91 OTHER END USES: MARKET IN OPTIMISTIC SCENARIO, BY REGION, 2023–2034 (TONS)
           TABLE 92 OTHER END USES: MARKET IN NORMAL SCENARIO, BY REGION,  2023–2034 (USD MILLION)
           TABLE 93 OTHER END USES: MARKET IN NORMAL SCENARIO, BY REGION,  2023–2034 (TONS)
           TABLE 94 OTHER END USES: MARKET IN PESSIMISTIC SCENARIO, BY REGION, 2023–2034 (USD MILLION)
           TABLE 95 OTHER END USES: MARKET IN PESSIMISTIC SCENARIO, BY REGION, 2023–2034 (TONS)
 
9 CULTURED MEAT MARKET, BY REGION (Page No. - 128)
    9.1 INTRODUCTION 
           FIGURE 32 CANADA TO DOMINATE THE MARKET AND RECORD HIGHEST CAGR DURING FORECAST PERIOD (NORMAL SCENARIO)
           TABLE 96 OPTIMISTIC SCENARIO: MARKET, BY REGION,  2023–2034 (USD MILLION)
           TABLE 97 OPTIMISTIC SCENARIO: MARKET, BY REGION, 2023–2034 (TONS)
           TABLE 98 NORMAL SCENARIO: MARKET, BY REGION, 2023–2034 (USD MILLION)
           TABLE 99 NORMAL SCENARIO: MARKET, BY REGION, 2023–2034 (TONS)
           TABLE 100 PESSIMISTIC SCENARIO: MARKET, BY REGION,  2023–2034 (USD MILLION)
           TABLE 101 PESSIMISTIC SCENARIO: MARKET, BY REGION, 2023–2034 (TONS)
    9.2 NORTH AMERICA 
           FIGURE 33 NORTH AMERICA: MARKET SNAPSHOT (NORMAL SCENARIO)
           TABLE 102 NORTH AMERICA: MARKET IN OPTIMISTIC SCENARIO, BY COUNTRY, 2023–2034 (USD MILLION)
           TABLE 103 NORTH AMERICA: MARKET IN OPTIMISTIC SCENARIO, BY COUNTRY, 2023–2034 (TONS)
           TABLE 104 NORTH AMERICA: MARKET IN NORMAL SCENARIO, BY COUNTRY,  2023–2034 (USD MILLION)
           TABLE 105 NORTH AMERICA: MARKET IN NORMAL SCENARIO,  BY COUNTRY, 2023–2034 (TONS)
           TABLE 106 NORTH AMERICA: MARKET IN PESSIMISTIC SCENARIO,  BY COUNTRY, 2023–2034 (USD MILLION)
           TABLE 107 NORTH AMERICA: MARKET IN PESSIMISTIC SCENARIO, BY COUNTRY, 2023–2034 (TONS)
           TABLE 108 NORTH AMERICA: MARKET IN OPTIMISTIC SCENARIO, BY SOURCE, 2023–2034 (USD MILLION)
           TABLE 109 NORTH AMERICA: MARKET IN OPTIMISTIC SCENARIO, BY SOURCE, 2023–2034 (TONS)
           TABLE 110 NORTH AMERICA: CULTURED MEAT MARKET IN NORMAL SCENARIO, BY SOURCE,  2023–2034 (USD MILLION)
           TABLE 111 NORTH AMERICA: MARKET IN NORMAL SCENARIO,  BY SOURCE, 2023–2034 (TONS)
           TABLE 112 NORTH AMERICA: MARKET IN PESSIMISTIC SCENARIO,  BY SOURCE, 2023–2034 (USD MILLION)
           TABLE 113 NORTH AMERICA: MARKET IN PESSIMISTIC SCENARIO, BY SOURCE, 2023–2034 (TONS)
           TABLE 114 NORTH AMERICA: MARKET IN OPTIMISTIC SCENARIO, BY END USE, 2023–2034 (USD MILLION)
           TABLE 115 NORTH AMERICA: MARKET IN OPTIMISTIC SCENARIO, BY END USE, 2023–2034 (TONS)
           TABLE 116 NORTH AMERICA: MARKET IN NORMAL SCENARIO, BY END USE,  2023–2034 (USD MILLION)
           TABLE 117 NORTH AMERICA: MARKET IN NORMAL SCENARIO,  BY END USE, 2023–2034 (TONS)
           TABLE 118 NORTH AMERICA: MARKET IN PESSIMISTIC SCENARIO,  BY END USE, 2023–2034 (USD MILLION)
           TABLE 119 NORTH AMERICA: MARKET IN PESSIMISTIC SCENARIO,  BY END USE, 2023–2034 (TONS)
           9.2.1 NORTH AMERICA: RECESSION IMPACT
           9.2.2 US
                    9.2.2.1 Rising US meat consumption to spark demand for cultured meat
           9.2.3 CANADA
                    9.2.3.1 Canada’s meat export strength to drive cultured meat evolution
           9.2.4 MEXICO
                    9.2.4.1 Mexico’s cultured meat pioneers to drive market growth
    9.3 EUROPE 
           TABLE 120 EUROPE: CULTURED MEAT MARKET IN OPTIMISTIC SCENARIO, BY COUNTRY,  2023–2034 (USD MILLION)
           TABLE 121 EUROPE: MARKET IN OPTIMISTIC SCENARIO, BY COUNTRY,  2023–2034 (TONS)
           TABLE 122 EUROPE: MARKET IN NORMAL SCENARIO, BY COUNTRY,  2023–2034 (USD MILLION)
           TABLE 123 EUROPE: MARKET IN NORMAL SCENARIO, BY COUNTRY,  2023–2034 (TONS)
           TABLE 124 EUROPE: MARKET IN PESSIMISTIC SCENARIO, BY COUNTRY,  2023–2034 (USD MILLION)
           TABLE 125 EUROPE: MARKET IN PESSIMISTIC SCENARIO, BY COUNTRY,  2023–2034 (TONS)
           TABLE 126 EUROPE: MARKET IN OPTIMISTIC SCENARIO,  BY SOURCE, 2023–2034 (USD MILLION)
           TABLE 127 EUROPE: MARKET IN OPTIMISTIC SCENARIO,  BY SOURCE, 2023–2034 (TONS)
           TABLE 128 EUROPE: MARKET IN NORMAL SCENARIO,  BY SOURCE, 2023–2034 (USD MILLION)
           TABLE 129 EUROPE: MARKET IN NORMAL SCENARIO,  BY SOURCE, 2023–2034 (TONS)
           TABLE 130 EUROPE: MARKET IN PESSIMISTIC SCENARIO,  BY SOURCE, 2023–2034 (USD MILLION)
           TABLE 131 EUROPE: MARKET IN PESSIMISTIC SCENARIO,  BY SOURCE, 2023–2034 (TONS)
           TABLE 132 EUROPE: MARKET IN OPTIMISTIC SCENARIO,  BY END USE, 2023–2034 (USD MILLION)
           TABLE 133 EUROPE: MARKET IN OPTIMISTIC SCENARIO,  BY END USE, 2023–2034 (TONS)
           TABLE 134 EUROPE: MARKET IN NORMAL SCENARIO,  BY END USE, 2023–2034 (USD MILLION)
           TABLE 135 EUROPE: MARKET IN NORMAL SCENARIO,  BY END USE, 2023–2034 (TONS)
           TABLE 136 EUROPE: MARKET IN PESSIMISTIC SCENARIO,  BY END USE, 2023–2034 (USD MILLION)
           TABLE 137 EUROPE: CULTURED MEAT MARKET IN PESSIMISTIC SCENARIO,  BY END USE, 2023–2034 (TONS)
           9.3.1 EUROPE: RECESSION IMPACT
           9.3.2 GERMANY
                    9.3.2.1 High acceptance of cultured meat in Germany to drive market growth
           9.3.3 UK
                    9.3.3.1 UK to be prominent hub for cellular agriculture, thereby driving market growth
           9.3.4 NETHERLANDS
                    9.3.4.1 Increased presence of cultured meat manufacturers and research centers to facilitate market growth
           9.3.5 FRANCE
                    9.3.5.1 Unsupportive regulatory environment expected to hinder market growth
           9.3.6 SPAIN
                    9.3.6.1 Strategic developments undertaken by market players to drive growth
           9.3.7 ITALY
                    9.3.7.1 Governmental ban on cultured meat to restrict market growth
           9.3.8 REST OF EUROPE
    9.4 ASIA PACIFIC 
           TABLE 138 ASIA PACIFIC: MARKET IN OPTIMISTIC SCENARIO, BY COUNTRY,  2023–2034 (USD MILLION)
           TABLE 139 ASIA PACIFIC: MARKET IN OPTIMISTIC SCENARIO, BY COUNTRY,  2023–2034 (TONS)
           TABLE 140 ASIA PACIFIC: MARKET IN NORMAL SCENARIO, BY COUNTRY,  2023–2034 (USD MILLION)
           TABLE 141 ASIA PACIFIC: MARKET IN NORMAL SCENARIO, BY COUNTRY,  2023–2034 (TONS)
           TABLE 142 ASIA PACIFIC: MARKET IN PESSIMISTIC SCENARIO,  BY COUNTRY, 2023–2034 (USD MILLION)
           TABLE 143 ASIA PACIFIC: CULTURED MEAT MARKET IN PESSIMISTIC SCENARIO,  BY COUNTRY, 2023–2034 (TONS)
           TABLE 144 ASIA PACIFIC: MARKET IN OPTIMISTIC SCENARIO,  BY SOURCE, 2023–2034 (USD MILLION)
           TABLE 145 ASIA PACIFIC: MARKET IN OPTIMISTIC SCENARIO,  BY SOURCE, 2023–2034 (TONS)
           TABLE 146 ASIA PACIFIC: MARKET IN NORMAL SCENARIO,  BY SOURCE, 2023–2034 (USD MILLION)
           TABLE 147 ASIA PACIFIC: MARKET IN NORMAL SCENARIO,  BY SOURCE, 2023–2034 (TONS)
           TABLE 148 ASIA PACIFIC: MARKET IN PESSIMISTIC SCENARIO,  BY SOURCE, 2023–2034 (USD MILLION)
           TABLE 149 ASIA PACIFIC: MARKET IN PESSIMISTIC SCENARIO,  BY SOURCE, 2023–2034 (TONS)
           TABLE 150 ASIA PACIFIC: MARKET IN OPTIMISTIC SCENARIO,  BY END USE, 2023–2034 (USD MILLION)
           TABLE 151 ASIA PACIFIC: MARKET IN OPTIMISTIC SCENARIO,  BY END USE, 2023–2034 (TONS)
           TABLE 152 ASIA PACIFIC: MARKET IN NORMAL SCENARIO,  BY END USE, 2023–2034 (USD MILLION)
           TABLE 153 ASIA PACIFIC: MARKET IN NORMAL SCENARIO,  BY END USE, 2023–2034 (TONS)
           TABLE 154 ASIA PACIFIC: MARKET IN PESSIMISTIC SCENARIO,  BY END USE, 2023–2034 (USD MILLION)
           TABLE 155 ASIA PACIFIC: MARKET IN PESSIMISTIC SCENARIO,  BY END USE, 2023–2034 (TONS)
           9.4.1 ASIA PACIFIC: RECESSION IMPACT
           9.4.2 CHINA
                    9.4.2.1 Substantial investments and governmental support to propel market growth
           9.4.3 JAPAN
                    9.4.3.1 Increasing protein-rich diet to facilitate market growth
           9.4.4 SINGAPORE
                    9.4.4.1 Increasing acceptance among consumers and governmental approval to drive market growth
           9.4.5 INDIA
                    9.4.5.1 Increased environmental threats owing to upsurge in meat consumption to facilitate market growth
           9.4.6 AUSTRALIA & NEW ZEALAND
                    9.4.6.1 Environmental awareness to fuel demand for cultured meat in Australia
           9.4.7 REST OF ASIA PACIFIC
    9.5 SOUTH AMERICA 
           TABLE 156 SOUTH AMERICA: CULTURED MEAT MARKET IN OPTIMISTIC SCENARIO,  BY COUNTRY, 2023–2034 (USD MILLION)
           TABLE 157 SOUTH AMERICA: MARKET IN OPTIMISTIC SCENARIO,  BY COUNTRY, 2023–2034 (TONS)
           TABLE 158 SOUTH AMERICA: MARKET IN NORMAL SCENARIO,  BY COUNTRY, 2023–2034 (USD MILLION)
           TABLE 159 SOUTH AMERICA: MARKET IN NORMAL SCENARIO,  BY COUNTRY, 2023–2034 (TONS)
           TABLE 160 SOUTH AMERICA: MARKET IN PESSIMISTIC SCENARIO,  BY COUNTRY, 2023–2034 (USD MILLION)
           TABLE 161 SOUTH AMERICA: MARKET IN PESSIMISTIC SCENARIO,  BY COUNTRY, 2023–2034 (TONS)
           TABLE 162 SOUTH AMERICA: MARKET IN OPTIMISTIC SCENARIO, BY SOURCE, 2023–2034 (USD MILLION)
           TABLE 163 SOUTH AMERICA: MARKET IN OPTIMISTIC SCENARIO,  BY SOURCE, 2023–2034 (TONS)
           TABLE 164 SOUTH AMERICA: MARKET IN NORMAL SCENARIO, BY SOURCE,  2023–2034 (USD MILLION)
           TABLE 165 SOUTH AMERICA: MARKET IN NORMAL SCENARIO,  BY SOURCE, 2023–2034 (TONS)
           TABLE 166 SOUTH AMERICA: MARKET IN PESSIMISTIC SCENARIO, BY SOURCE, 2023–2034 (USD MILLION)
           TABLE 167 SOUTH AMERICA: MARKET IN PESSIMISTIC SCENARIO,  BY SOURCE, 2023–2034 (TONS)
           TABLE 168 SOUTH AMERICA: MARKET IN OPTIMISTIC SCENARIO,  BY END USE, 2023–2034 (USD MILLION)
           TABLE 169 SOUTH AMERICA: MARKET IN OPTIMISTIC SCENARIO,  BY END USE, 2023–2034 (TONS)
           TABLE 170 SOUTH AMERICA: MARKET IN NORMAL SCENARIO,  BY END USE, 2023–2034 (USD MILLION)
           TABLE 171 SOUTH AMERICA: MARKET IN NORMAL SCENARIO,  BY END USE, 2023–2034 (TONS)
           TABLE 172 SOUTH AMERICA: MARKET IN PESSIMISTIC SCENARIO,  BY END USE, 2023–2034 (USD MILLION)
           TABLE 173 SOUTH AMERICA: MARKET IN PESSIMISTIC SCENARIO,  BY END USE, 2023–2034 (TONS)
           9.5.1 SOUTH AMERICA: RECESSION IMPACT
           9.5.2 BRAZIL
                    9.5.2.1 Brazil’s established meat industry to drive market growth
           9.5.3 REST OF SOUTH AMERICA
    9.6 MIDDLE EAST & AFRICA 
           TABLE 174 MIDDLE EAST & AFRICA: CULTURED MEAT MARKET IN OPTIMISTIC SCENARIO,  BY COUNTRY, 2023–2034 (USD MILLION)
           TABLE 175 MIDDLE EAST & AFRICA: MARKET IN OPTIMISTIC SCENARIO,  BY COUNTRY, 2023–2034 (TONS)
           TABLE 176 MIDDLE EAST & AFRICA: MARKET IN NORMAL SCENARIO,  BY COUNTRY, 2023–2034 (USD MILLION)
           TABLE 177 MIDDLE EAST & AFRICA: MARKET IN NORMAL SCENARIO,  BY COUNTRY, 2023–2034 (TONS)
           TABLE 178 MIDDLE EAST & AFRICA: MARKET IN PESSIMISTIC SCENARIO,  BY COUNTRY, 2023–2034 (USD MILLION)
           TABLE 179 MIDDLE EAST & AFRICA: MARKET IN PESSIMISTIC SCENARIO,  BY COUNTRY, 2023–2034 (TONS)
           TABLE 180 MIDDLE EAST & AFRICA: MARKET IN OPTIMISTIC SCENARIO,  BY SOURCE, 2023–2034 (USD MILLION)
           TABLE 181 MIDDLE EAST & AFRICA: MARKET IN OPTIMISTIC SCENARIO,  BY SOURCE, 2023–2034 (TONS)
           TABLE 182 MIDDLE EAST & AFRICA: MARKET IN NORMAL SCENARIO,  BY SOURCE, 2023–2034 (USD MILLION)
           TABLE 183 MIDDLE EAST & AFRICA: MARKET IN NORMAL SCENARIO,  BY SOURCE, 2023–2034 (TONS)
           TABLE 184 MIDDLE EAST & AFRICA: MARKET IN PESSIMISTIC SCENARIO,  BY SOURCE, 2023–2034 (USD MILLION)
           TABLE 185 MIDDLE EAST & AFRICA: MARKET IN PESSIMISTIC SCENARIO,  BY SOURCE, 2023–2034 (TONS)
           TABLE 186 MIDDLE EAST & AFRICA: MARKET IN OPTIMISTIC SCENARIO,  BY END USE, 2023–2034 (USD MILLION)
           TABLE 187 MIDDLE EAST & AFRICA: MARKET IN OPTIMISTIC SCENARIO,  BY END USE, 2023–2034 (TONS)
           TABLE 188 MIDDLE EAST & AFRICA: MARKET IN NORMAL SCENARIO,  BY END USE, 2023–2034 (USD MILLION)
           TABLE 189 MIDDLE EAST & AFRICA: MARKET IN NORMAL SCENARIO,  BY END USE, 2023–2034 (TONS)
           TABLE 190 MIDDLE EAST & AFRICA: MARKET IN PESSIMISTIC SCENARIO,  BY END USE, 2023–2034 (USD MILLION)
           TABLE 191 MIDDLE EAST & AFRICA: MARKET IN PESSIMISTIC SCENARIO,  BY END USE, 2023–2034 (TONS)
           9.6.1 MIDDLE EAST & AFRICA: RECESSION IMPACT
           9.6.2 UAE
                    9.6.2.1 Gradual developments in cultured meat sector to drive market growth
           9.6.3 REST OF MIDDLE EAST & AFRICA
 
10 COMPETITIVE LANDSCAPE (Page No. - 178)
     10.1 OVERVIEW 
     10.2 MARKET SHARE ANALYSIS, 2022 
               TABLE 192 CULTURED MEAT MARKET: DEGREE OF COMPETITION (COMPETITIVE)
     10.3 STRATEGIES ADOPTED BY KEY PLAYERS 
               TABLE 193 STRATEGIES ADOPTED BY KEY PLAYERS IN THE MARKET
     10.4 REVENUE ANALYSIS 
     10.5 GLOBAL SNAPSHOT OF KEY MARKET PARTICIPANTS 
               FIGURE 34 MARKET: GLOBAL SNAPSHOT OF KEY PARTICIPANTS, 2022
     10.6 COMPANY EVALUATION MATRIX 
             10.6.1 STARS
             10.6.2 EMERGING LEADERS
             10.6.3 PERVASIVE PLAYERS
             10.6.4 PARTICIPANTS
                       FIGURE 35 MARKET: COMPANY EVALUATION MATRIX, 2022
     10.7 COMPANY FOOTPRINT 
               TABLE 194 COMPANY FOOTPRINT, BY SOURCE
               TABLE 195 COMPANY FOOTPRINT, BY REGION
               TABLE 196 OVERALL COMPANY FOOTPRINT
     10.8 STARTUP/SME EVALUATION MATRIX 
             10.8.1 PROGRESSIVE COMPANIES
             10.8.2 RESPONSIVE COMPANIES
             10.8.3 DYNAMIC COMPANIES
             10.8.4 STARTING BLOCKS
                       FIGURE 36 CULTURED MEAT MARKET: STARTUP/SME EVALUATION MATRIX, 2022
             10.8.5 COMPETITIVE BENCHMARKING OF KEY STARTUPS/SMES
                       TABLE 197 MARKET: DETAILED LIST OF KEY STARTUPS/SMES
                       TABLE 198 MARKET: COMPETITIVE BENCHMARKING OF STARTUPS/SMES
     10.9 COMPETITIVE SCENARIO 
             10.9.1 DEALS
                       TABLE 199 MARKET: DEALS, 2019–2023
             10.9.2 OTHERS
                       TABLE 200 MARKET: OTHERS, 2019–2023
 
11 COMPANY PROFILES (Page No. - 198)
(Business Overview, Products Offered, Recent Developments, MnM View Right to win, Strategic choices made, Weaknesses and competitive threats) *
     11.1 MAJOR PLAYERS 
             11.1.1 MOSA MEAT
                       TABLE 201 MOSA MEAT: BUSINESS OVERVIEW
                       TABLE 202 MOSA MEAT: DEALS
                       TABLE 203 MOSA MEAT: OTHERS
             11.1.2 UPSIDE FOODS
                       TABLE 204 UPSIDE FOODS: BUSINESS OVERVIEW
                       TABLE 205 UPSIDE FOODS: DEALS
                       TABLE 206 UPSIDE FOODS: OTHERS
             11.1.3 EAT JUST, INC.
                       TABLE 207 EAT JUST, INC.: BUSINESS OVERVIEW
                       TABLE 208 EAT JUST, INC.: DEALS
             11.1.4 INTEGRICULTURE INC.
                       TABLE 209 INTEGRICULTURE INC.: CULTURED MEAT MARKET BUSINESS OVERVIEW
                       TABLE 210 INTEGRICULTURE INC.: DEALS
             11.1.5 MEWERY
                       TABLE 211 MEWERY: BUSINESS OVERVIEW
             11.1.6 BIOCRAFT, INC.
                       TABLE 212 BIOCRAFT, INC.: BUSINESS OVERVIEW
             11.1.7 FINLESS FOODS, INC.
                       TABLE 213 FINLESS FOODS, INC.: BUSINESS OVERVIEW
                       TABLE 214 FINLESS FOODS, INC.: DEALS
             11.1.8 AVANT MEATS
                       TABLE 215 AVANT MEATS: BUSINESS OVERVIEW
                       TABLE 216 AVANT MEATS: DEALS
                       TABLE 217 AVANT MEATS: OTHERS
             11.1.9 BLUENALU
                       TABLE 218 BLUENALU: BUSINESS OVERVIEW
                       TABLE 219 BLUENALU: DEALS
                       TABLE 220 BLUENALU: OTHERS
             11.1.10 FORK & GOOD
                       TABLE 221 FORK & GOOD: BUSINESS OVERVIEW
             11.1.11 MISSION BARNS
                       TABLE 222 MISSION BARNS: BUSINESS OVERVIEW
                       TABLE 223 MISSION BARNS: DEALS
             11.1.12 CUBIQ FOODS
                       TABLE 224 CUBIQ FOODS: CULTURED MEAT MARKET BUSINESS OVERVIEW
             11.1.13 IVY FARM TECHNOLOGIES LIMITED
                       TABLE 225 IVY FARM TECHNOLOGIES LIMITED: BUSINESS OVERVIEW
             11.1.14 MEATABLE
                       TABLE 226 MEATABLE: BUSINESS OVERVIEW
     11.2 STARTUPS/SMES/OTHER PLAYERS 
             11.2.1 BIOTECH FOODS
                       TABLE 227 BIOTECH FOODS: BUSINESS OVERVIEW
             11.2.2 O MEAT
                       TABLE 228 O MEAT: BUSINESS OVERVIEW
             11.2.3 BIOBQ
                       TABLE 229 BIOBQ: BUSINESS OVERVIEW
             11.2.4 PEARLITA FOODS
                       TABLE 230 PEARLITA FOODS: BUSINESS OVERVIEW
             11.2.5 WILDBIO
                       TABLE 231 WILDBIO: BUSINESS OVERVIEW
             11.2.6 GOURMEY
                       TABLE 232 GOURMEY: BUSINESS OVERVIEW
             11.2.7 PEACE OF MEAT
                       TABLE 233 PEACE OF MEAT: BUSINESS OVERVIEW
             11.2.8 WILD TYPE
             11.2.9 LABFARM
             11.2.10 SHIOK MEATS PTE LTD
             11.2.11 CLEARMEAT
             11.2.12 EAT JUST, INC.
*Details on Business Overview, Products Offered, Recent Developments, MnM View, Right to win, Strategic choices made, Weaknesses and competitive threats might not be captured in case of unlisted companies.
 
12 ADJACENT AND RELATED MARKETS TO CULTURED MEAT MARKET(Page No. - 231)
     12.1 INTRODUCTION 
     12.2 LIMITATIONS 
     12.3 MEAT SUBSTITUTES MARKET 
             12.3.1 MARKET DEFINITION
             12.3.2 MARKET OVERVIEW
                       TABLE 234 MEAT SUBSTITUTES MARKET, BY SOURCE, 2017–2020 (USD MILLION)
                       TABLE 235 MEAT SUBSTITUTES MARKET, BY SOURCE, 2021–2027 (USD MILLION)
                       TABLE 236 MEAT SUBSTITUTES MARKET, BY SOURCE, 2017–2020 (KT)
                       TABLE 237 MEAT SUBSTITUTES MARKET, BY SOURCE, 2021–2027 (KT)
     12.4 PLANT-BASED MEAT MARKET 
             12.4.1 MARKET DEFINITION
             12.4.2 MARKET OVERVIEW
                       TABLE 238 PLANT-BASED MEAT MARKET, BY SOURCE, 2019–2021 (USD MILLION)
                       TABLE 239 PLANT-BASED MEAT MARKET, BY SOURCE, 2022–2027 (USD MILLION)
                       TABLE 240 PLANT-BASED MEAT MARKET, BY SOURCE, 2019–2021 (TONS)
                       TABLE 241 PLANT-BASED MEAT MARKET, BY SOURCE, 2022–2027 (TONS)
 
13 APPENDIX (Page No. - 236)
     13.1 DISCUSSION GUIDE 
     13.2 KNOWLEDGESTORE: MARKETSANDMARKETS’  SUBSCRIPTION PORTAL 
     13.3 CUSTOMIZATION OPTIONS 
     13.4 RELATED REPORTS 
     13.5 AUTHOR DETAILS 

The study involved four major activities in estimating the current size of the cultured meat market. Exhaustive secondary research was done to collect information on the market, peer, and parent markets. The next step was to validate these findings, assumptions, and sizing with industry experts across the value chain through primary research. Both top-down and bottom-up approaches were employed to estimate the complete market size. After that, market breakdown and data triangulation were used to estimate the market size of segments and subsegments.

Secondary Research

This research study involved the extensive use of secondary sources—directories and databases such as Bloomberg Businessweek and Factiva—to identify and collect information useful for a technical, market-oriented, and commercial study of the market.

In the secondary research process, various sources such as annual reports, press releases & investor presentations of companies, white papers, food journals, certified publications, articles from recognized authors, gold & silver standard websites, directories, and databases, were referred to identify and collect information. This research study involved the extensive use of secondary sources—directories and databases such as Bloomberg Businessweek and Factiva—to identify and collect information useful for a technical, market-oriented, and commercial study of the cultured meat market.

Secondary research was mainly used to obtain key information about the industry’s supply chain, the total pool of key players, and market classification and segmentation as per the industry trends to the bottom-most level, regional markets, and key developments from both market- and technology-oriented perspectives.

Primary Research

Extensive primary research was conducted after obtaining information regarding the cultured meat market scenario through secondary research. Several primary interviews were conducted with market experts from both the demand and supply sides across major countries of North America, Europe, Asia Pacific, South America, and the Rest of the World. Primary data was collected through questionnaires, emails, and telephonic interviews. The primary sources from the supply side included various industry experts, such as Chief X Officers (CXOs), Vice Presidents (VPs), Directors, from business development, marketing, research, and development teams, and related key executives from distributors, and key opinion leaders. Primary interviews were conducted to gather insights such as market statistics, data on revenue collected from the products and services, market breakdowns, market size estimations, market forecasting, and data triangulation. Primary research also helped in understanding the various trends related to types of cultured meat, type, product, consumption, distribution channel, freezing technique, and region. Stakeholders from the demand side, such as food and beverage companies and health and personal care companies who are using cultured meat were interviewed to understand the buyer’s perspective on the suppliers, products, and their current usage of cultured meat and outlook of their business which will affect the overall market.
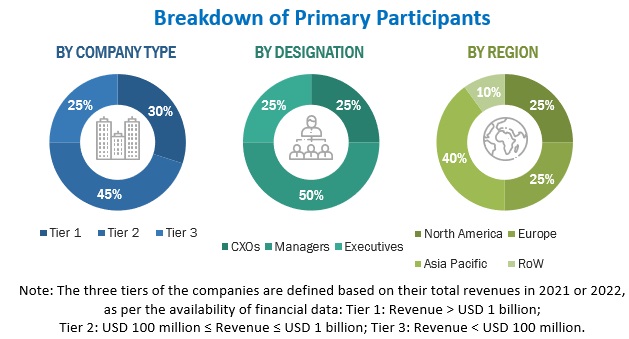
Cultured Meat Market Primary Research

To know about the assumptions considered for the study, download the pdf brochure

COMPANY NAME

designation

BioCraft,Inc (US)

General Manager

Finless Foods (US)

Sales Manager

BlueNalu (US)

Individual Industry Expert

Fork & Good (US)

Marketing Manager

Mission Barns (US)

Sales Executive

Ivy Farm Technologies Limited (UK)

Sales Manager

Cultured Meat Market Size Estimation

Both the top-down and bottom-up approaches were used to estimate and validate the total size of the market. These approaches were also used extensively to determine the size of various subsegments in the market. The research methodology used to estimate the market size includes the following details:

  • The key players in the industry and the overall markets were identified through extensive secondary research.
  • The revenues of the major cultured meat players were determined through primary and secondary research, which were used as the basis for market sizing and estimation.
  • All percentage shares, splits, and breakdowns were determined using secondary sources and verified through primary sources.
  • All macroeconomic and microeconomic factors affecting the growth of the market were considered while estimating the market size.
  • All possible parameters that affect the market covered in this research study were accounted for, viewed in extensive detail, verified through primary research, and analyzed to obtain final quantitative and qualitative data.

Global cultured meat Market: Bottom-Up Approach
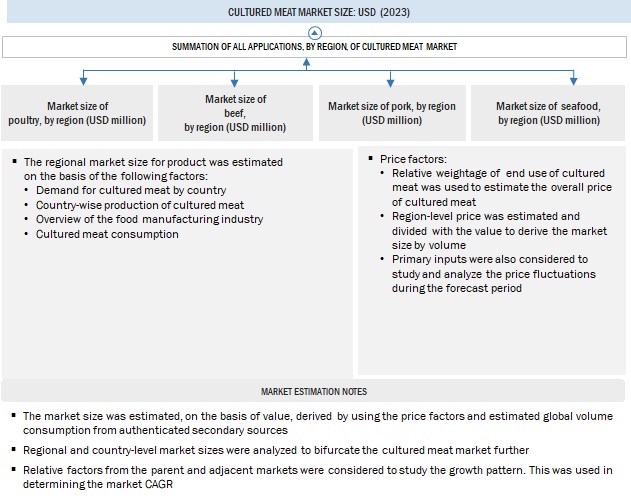
Cultured Meat Market Bottom-Up Approach

To know about the assumptions considered for the study, Request for Free Sample Report

Global cultured meat Market: Top-Down Approach
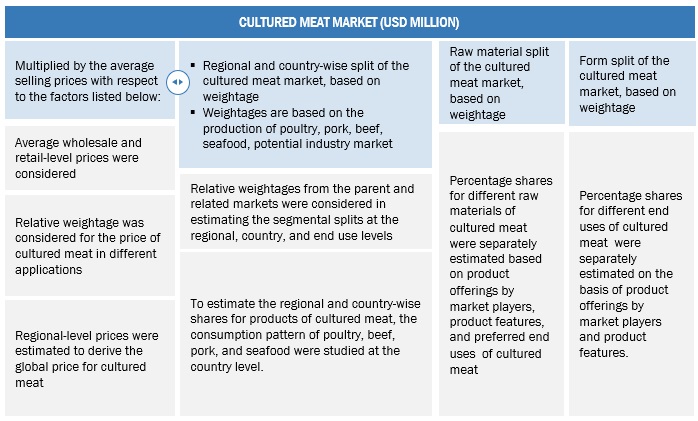
Cultured Meat Market Top-Down Approach

Data Triangulation

After arriving at the overall size from the market size estimation process explained above, the total market was split into several segments and subsegments. The data triangulation and market breakdown procedures explained below were implemented, wherever applicable, to complete the overall market engineering process and arrive at the exact statistics for various market segments and subsegments. The data was triangulated by studying various factors and trends from the demand and supply sides. Along with this, the market size was validated using both the top-down and bottom-up approaches.

Cultured Meat Market Definition

According to the Federation of American Scientists, “Cell-cultured meat (also referred to as lab-grown meat, clean meat, in-vitro meat, imitation meat, synthetic meat, and fake meat) is grown in laboratories from animal cell cultures.”

Key Stakeholders

  • Venture capitalists and investors
  • Meat processors, traders, distributors, importers, exporters, and suppliers
  • Food retailers
  • Commercial research & development (R&D) organizations and financial institutions
  • Livestock research organizations
  • Cultured meat associations and regulatory bodies such as the Cultured Meat Foundation, and Future Food
  • Other associations such as the United States Cattlemen's Association (USCA), National Cattlemen's Beef Association, and the National Pork Producers Council

Cultured Meat Market Report Objectives

  • Determining and projecting the size of the market, with respect to source, end use and regions, over 10 years, ranging from 2024 to 2034
  • Identifying the attractive opportunities in the market by determining the largest and fastest-growing segments across regions
  • Providing detailed information about the key factors influencing the growth of the market (drivers, restraints, opportunities, and industry-specific challenges)
  • Analyzing the micro-markets with respect to individual growth trends, prospects, and their contribution to the total market
  • Impact of macro- and microeconomic factors on the market
  • Impact of recession on the global market
  • Shifts in demand patterns across different subsegments and regions.
  • Identifying and profiling the key market players in the market
  • Understanding the competitive landscape and identifying the major growth strategies adopted by players across the key regions.

Available Customizations:

With the given market data, MarketsandMarkets offers customizations according to company-specific scientific needs.

The following customization options are available for the report:

Product Analysis

  • Product Matrix, which gives a detailed comparison of the product portfolio of each company.

Geographic Analysis of Cultured Meat Market

With the given market data, MarketsandMarkets offers customizations according to company-specific scientific needs.

  • Further breakdown of the Rest of Europe into Poland, Portugal, Ireland, Sweden, Finland, Austria, Belgium, Bulgaria, Greece, the Czech Republic, Russia, and Denmark.
  • Further breakdown of the Rest of Asia Pacific into Malaysia, Myanmar, the Philippines, Indonesia, South Korea, Thailand, Sri Lanka, and Vietnam
  • Further breakdown of the Rest of the Middle East & Africa into Saudi Arabia, Iran, Iraq, Oman, Bahrain, Qatar, Kuwait, Egypt, Turkey, Syria, South Africa, Nigeria, Kenya, Morocco, Ghana, and Algeria.

Company Information

  • Detailed analyses and profiling of additional market players (up to five)
Custom Market Research Services

We will customize the research for you, in case the report listed above does not meet with your exact requirements. Our custom research will comprehensively cover the business information you require to help you arrive at strategic and profitable business decisions.

Request Customization
Report Code
FB 6247
Published ON
Nov, 2023
Choose License Type
BUY NOW
  • SHARE
X
Request Customization
Speak to Analyst
Speak to Analyst
OR FACE-TO-FACE MEETING
PERSONALIZE THIS RESEARCH
  • Triangulate with your Own Data
  • Get Data as per your Format and Definition
  • Gain a Deeper Dive on a Specific Application, Geography, Customer or Competitor
  • Any level of Personalization
REQUEST A FREE CUSTOMIZATION
LET US HELP YOU!
  • What are the Known and Unknown Adjacencies Impacting the Cultured Meat Market
  • What will your New Revenue Sources be?
  • Who will be your Top Customer; what will make them switch?
  • Defend your Market Share or Win Competitors
  • Get a Scorecard for Target Partners
CUSTOMIZED WORKSHOP REQUEST
+1-888-600-6441
  • Call Us
  • +1-888-600-6441 (Corporate office hours)
  • +1-888-600-6441 (US/Can toll free)
  • +44-800-368-9399 (UK office hours)
CONNECT WITH US
ABOUT TRUST ONLINE
©2024 MarketsandMarkets Research Private Ltd. All rights reserved
DMCA.com Protection Status Website Feedback