Bag Filter Market by Type (Pulse Jet, Shaker, Reverse Air), Media (Woven, Non-Woven), Fluid Type (Air, Liquid), Applications (Power Generation, Cement, Mining, Chemical, and Municipal), and Region - Global Forecast to 2023


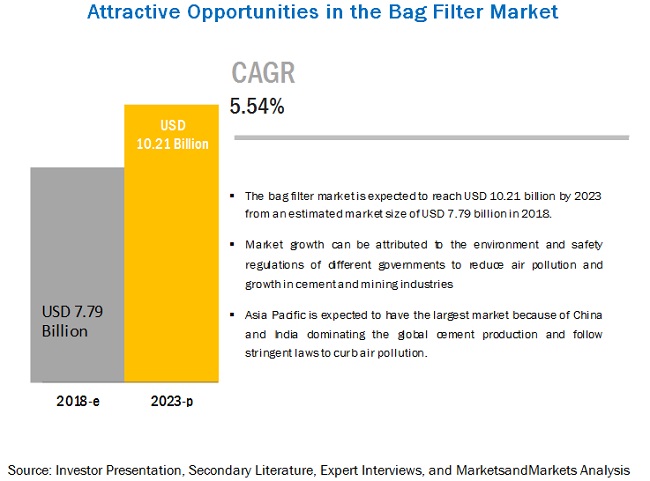
[149 Pages Report] MarketsandMarkets forecasts the global bag filter market to grow from USD 7.7 billion in 2018 to USD 10.2 billion by 2023, at a Compound Annual Growth Rate (CAGR) of 5.54% during the forecast period. The major factors driving the bag filter market include environment and safety regulations of different governments to reduce air pollution and global growth of cement and mining industries. The objective of the report is to define, describe, and forecast the global bag filter market by type, media, fluid, application and region.
By Type, the pulse jet segment is expected to grow at the highest CAGR from 2018 to 2023
The type segment of the bag filter market, pulse jet is estimated to be the fastest growing market from 2018 to 2023. The market for pulse jet is driven by need for higher operational efficiencies in applications such as cement manufacturing, power generation, chemicals and municipal waste.
By Media, the nonwoven segment is expected to dominate the market from 2018 to 2023
The nonwoven segment of the bag filter market, by media, is estimated to dominate the market and grow at the highest CAGR from 2018 to 2023. The market for nonwoven bag filters is driven by the limited maintenance and low operational cost of the nonwoven bag filters.
By Fluid, the air type segment is estimated to be the fastest-growing segment
The air fluid type segment is estimated to be the fastest-growing segment of the bag filter market, by fluid type, from 2018 to 2023. Air type bag filters are used majorly in power generation, food and beverage, chemical & pharmaceuticals and water and waste water treatment sectors.
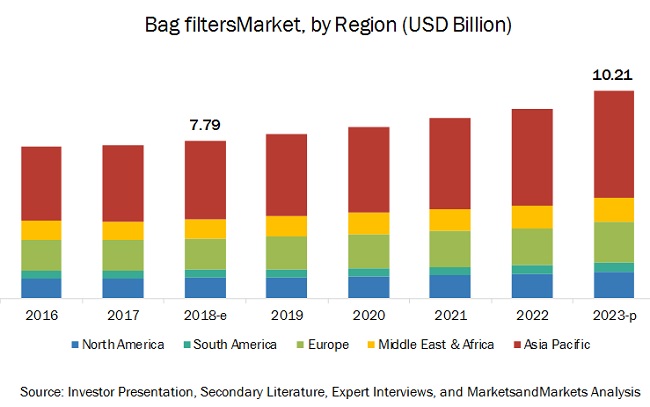
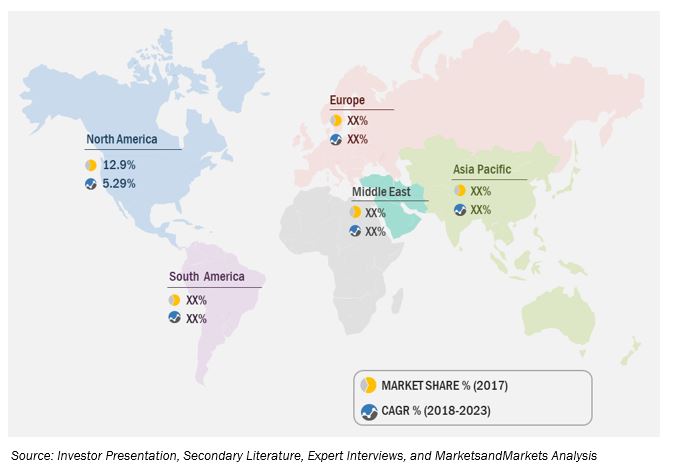
Asia Pacific to account for the largest market size and fastest growing market during the forecast period.
In the bag filters market, Asia Pacific is projected to grow at the fastest rate from 2018 to 2023. Rapid economic growth in the region would lead to an increase in the demand for cement and power generation from fossil fuel plants. Increasing environmental restrictions on pollution from the operation of these plants will boost the demand for bag filters in the region.
Market Dynamics
Driver: Environment and Safety Regulations of different governments to reduce air pollution
Globally, government regulations for particulate control have taken a different shape over the past decade. In the developed countries of North America and Western Europe, several new regulations have been introduced to control harmful industrial emissions. Frequent modifications of regulations make it mandatory for the industrial players to install and upgrade the bag filter systems in their plants. The industry is highly regulatory driven. Various countries have different norms to control the emission of harmful compounds such as SOx, NOx, VOCs, and toxic metals.
In North America, the air pollution control regulations are extremely stringent and ever-changing. In the US, most of the air pollution control regulations are implemented and regulated by the Environmental Protection Agency (EPA). Some of the most important regulations in the US include the Clean Air Act, Cross-State Air Pollution Rule (CSAPR), Clean Air Interstate Rule (CAIR), Mercury and Air Toxic Standards (MATS), Maximum Achievable Control Technology Standards (MACT), and National Emission Standards for Hazardous Air Pollutants (NESHAPS).
In the European Union, some of the main regulations and standards include Air Quality Directive, The VOC Solvents Emissions Directive, and IPPC Directive. Such strong regulations and standards compel the utility and industrial players to install bag filter systems. Other countries in the Asia Pacific and Middle East regions are also setting up nationwide network of monitoring sites to check and improve ambient air quality trends. This is expected to drive the bag filter market.
Restraint: Slow implementation of pollution control reforms
To reduce air pollution, many developed and developing nations have often amended many environmental laws and regulations that are directed at controlling the industrial emissions of air and water. However, this has not helped to reduce environmental emissions or improve air quality. For the effective implementation of standards, it is vital for industries to comply with environmental norms. On the other hand, the complexity of environmental monitoring and pollution control reforms result in limited implementation of the standards, especially in countries such as China and India.
Pollution control programs in the US focus on detailed regulation of air quality monitoring and frequent upgrades to the latest technologies. This, however, results in increased product procurement costs, which restrict the adoption of environment protection initiatives among industries and residential users.
Moreover, in industries, there is a lack of robust training structure for undertaking pollution monitoring and control measures Limited R&D infrastructure to develop affordable air pollution monitoring technologies in developing countries are further hampering the implementation of effective pollution monitoring and control reforms.
Opportunity: Implementation of Mercury and Air Toxics Standards (MATS) in the US
The Environmental Protection Agency in the US introduced MATS to reduce mercury and other toxic air pollutants that are generated by coal- and oil-fired power plants across the country. The standard was implemented for all coal- and oil-fired electrical generating units that are larger than 25 MW. Due to the implementation of this standard, about 1,400 coal-fired power plants are being affected.
The pointers given below highlight the new emission standards:
- All existing and new coal-fired power generation units now have numerical emission limits for mercury, PM, and Hydrogen Chloride (HCl).
- All existing and new oil-fired units now have numerical emission limits for PM, HCl, and Hydrogen Fluoride (HF). These power plants can also show MATS compliance for HCl and HF by limiting the moisture content of the oil used.
- The MATS replace a hard-numerical emission limit for dioxin/furan for new and existing coal- and oil-fired power plants, with work practices that require an annual performance test and tune-ups. To demonstrate compliance, plants will need to submit documentation that the unit has undergone regular inspections and maintenance, once every 36 months.
Implementation of this new standard will drive the mercury control and particulate control equipment (bag filter) market in the US. Several coal-fired plants in the US are already adding or upgrading fabric filters to meet the MATS PM emissions requirements.
Challenge: Emergence of alternative and renewable sources of energy
Although coal is a cheap source of power generation, alternative and renewable sources are also gaining importance. Many power generation sources, such as nuclear, hydro, wind, and solar, have no emissions. In a step toward cleaner environment, new constructions of coal-based power plants have seen a steep decline, especially in emerging economies such as India and China. China is also investing in clean coal technologies such as supercritical and ultra-supercritical plants that are about twice as efficient as subcritical boilers. Coal power is expected to be replaced with renewable energy because renewable energy generation is more cost-effective than fossil fuel and further restrictions are being imposed on coal-based power generation.
Power generation through renewable energy sources could reduce the use of bag filter systems and services in the coming years. Moreover, in several countries, due to pollution concerns and cheaper availability, natural gas is preferred over coal for power generation. As per EIA statistics, the share of natural gas for power generation in the US is expected to reach 27% in 2035 from 24% in 2010. Power generation from renewable energy sources is expected to increase significantly between 2010 and 2035. During the same period, the share of coal in the overall electricity generation sector is expected to fall to 39.0% in 2040 from about 45.0% in 2014. Gradual increase in the use of alternate and renewable sources for power generation could affect the industry as most have less or no emissions.
Get online access to the report on the World's First Market Intelligence Cloud
- Easy to Download Historical Data & Forecast Numbers
- Company Analysis Dashboard for high growth potential opportunities
- Research Analyst Access for customization & queries
- Competitor Analysis with Interactive dashboard
- Latest News, Updates & Trend analysis
Request Sample Scope of the Report
Get online access to the report on the World's First Market Intelligence Cloud
- Easy to Download Historical Data & Forecast Numbers
- Company Analysis Dashboard for high growth potential opportunities
- Research Analyst Access for customization & queries
- Competitor Analysis with Interactive dashboard
- Latest News, Updates & Trend analysis

|
Report Metric |
Details |
|
Market size available for years |
2016–2023 |
|
Base year considered |
2017 |
|
Forecast period |
2018–2023 |
|
Forecast units |
Billion (USD) |
|
Segments covered |
By Type (Pulse Jet, Reverse Air and Shaker), By media (nonwoven and woven), By Fluid (Air and Liquid), By Application (Power generation, cement, mining, chemical, pulp & paper, municipal wate and others) |
|
Geographies covered |
Asia Pacific, Europe, North America, South America, Middle East & Africa |
|
|
Danaher, Donaldson, Thermax, Babcock & Wilcox CO, Eaton Corporation (Ireland), , Mitsubishi Hitachi Power Systems (Japan), General Electric (US), Camfil Farr (Sweden), BWF Envirotech (Germany), W.L. Gore & Associates (US), Lenntech (The Netherlands), Rosedale Products (US), Parker Hannifin Corporation (US). |
The research report categorizes the bag filter market to forecast the revenues and analyze the trends in each of the following sub-segments:
By Type
- Pulse Jet
- Reverse Air
- Shaker
By Media
- Nonwoven
- Woven
- Others
By Fluid
- Air
- Liquid
By Application
- Power Generation
- Cement
- Mining
- Chemical
- Pulp & Paper
- Municipal Waste
- Others
By Region
- North America
- Europe
- Asia Pacific
- Middle East & Africa
- South America
Key Market Players
Danaher (US), Donaldson (US), Thermax (India), Babcock & Wilcox CO (US), Eaton Corporation (Ireland), Mitsubishi Hitachi Power Systems (Japan), General Electric (US), Camfil Farr (Sweden), Camfil Farr(Sweden), BWF Envirotech (Germany), W.L. Gore & Associates (US), Lenntech (The Netherlands), Rosedale Products (US), and Parker Hannifin Corporation (US).
Babcock & Wilcox (B&W) is one of the leading companies that provide energy and environmental technologies and services to power and industrial markets, globally. The company operates its business through 3 segments, namely, power, industrial, and renewable. It provides bag filters under its industrial segment. The industrial segment generated 25.4% of the total revenue in 2017. In June 2014, Babcock & Wilcox Power Generation Group, one of the subsidiaries of Babcock & Wilcox, acquired Megtec, one of the leading suppliers of innovative environmental control technologies worldwide. Through Megtec, B&W provide environmental products and services to various industries. The company offers its products and services in over 90 countries. Some of its subsidiaries include Allen-Sherman-Hoff ash and material handling, Babcock & Wilcox steam generation and environmental system, and B&W Vølund renewable energy systems.
Recent Developments
- In November 2018, Donaldson acquired BOFA International, a manufacturer of fume extraction systems across a wide range of industrial air filtration applications. This would help the company to expand its offerings in new industrial air filtration markets and applications.
- In June 2018, B&W signed a definitive agreement to sell its MEGTEC and Universal businesses to Dürr AG. The scope behind the selling was to increase focus on providing products and services for the power generation industry, and driving efficiencies and cost reductions throughout the organization.
- In February 2018, Parker Hannifin expanded its business by opening a new industrial filter test laboratory and customer experience facility in the US. The laboratory will provide quantitative methods for determining the performance of pulse cleaned filter and perform tests in accordance with ANSI/ASHRAE 199-2016.
- In September 2017, Thermax was awarded a contract from a leading cement company in the UAE. The scope of the contract included designing, engineering, manufacturing, construction, and commissioning of the solid fuel based power plant with 2 CFBC boilers. This would help the company to expand its footprint in the Middle East region.
Critical questions the report answers:
- Where will all these developments take the industry in the long term?
- What are the upcoming trends for the bag filter market?
- Which segment provides the most opportunity for growth?
- Who are the leading manufacturers operating in this market?
- What are the opportunities for new market entrants?
To speak to our analyst for a discussion on the above findings, click Speak to Analyst
Table of Contents
1 Introduction (Page No. - 16)
1.1 Objectives of the Study
1.2 Definition
1.3 Market Scope
1.3.1 Market Segmentation
1.3.2 Regional Scope
1.4 Years Considered for the Study
1.5 Currency
1.6 Stakeholders
2 Research Methodology (Page No. - 20)
2.1 Research Data
2.1.1 Secondary Data
2.1.1.1 Key Data From Secondary Sources
2.1.2 Primary Data
2.1.2.1 Key Data From Primary Sources
2.1.2.2 Key Industry Insights
2.1.2.3 Breakdown of Primaries
2.2 Market Size Estimation
2.2.1 Bottom-Up Approach
2.2.2 Top-Down Approach
2.3 Data Triangulation
2.4 Research Assumptions
3 Executive Summary (Page No. - 27)
4 Premium Insights (Page No. - 33)
4.1 Attractive Opportunities in the Bag Filter Market
4.2 Asia Pacific Bag Filter Market, By Type & Country
4.3 Bag Filter Market, By Application
4.4 Bag Filter Market, By Media Type
4.5 Bag Filter Market, By Fluid Type
5 Market Overview (Page No. - 36)
5.1 Introduction
5.2 Market Dynamics
5.2.1 Drivers
5.2.1.1 Environment and Safety Regulations of Different Governments to Reduce Air Pollution
5.2.1.2 Growth in Cement and Mining Industry
5.2.1.3 Requirement of Safe Working Environment in Industries
5.2.2 Restraints
5.2.2.1 Slow Implementation of Pollution Control Reforms
5.2.2.2 Unfavorable Economic Conditions
5.2.3 Opportunities
5.2.3.1 Implementation of Mercury and Air Toxics Standards (MATS) in the Us
5.2.3.2 Increasing Investments to Improve Air Quality
5.2.3.3 Marketable Byproducts
5.2.4 Challenges
5.2.4.1 Emergence of Alternative and Renewable Sources of Energy
5.2.4.2 Availability of Low Cost and Inferior Quality Bag Filter Products
6 Bag Filter Market, By Type (Page No. - 44)
6.1 Introduction
6.2 Pulse Jet
6.2.1 Need for High Operational Efficiencies is Driving the Market Pulse Jet
6.3 Reverse Air
6.3.1 Need for Continuous Operations is Driving the Market for Reverse Air Filters
6.4 Shaker
6.4.1 Cost Effective Bag Filter Solutions is Driving the Market
7 Bag Filter Market, By Media (Page No. - 49)
7.1 Introduction
7.2 Nonwoven
7.2.1 Limited Maintenance and Operational Cost is Driving the Market for Non-Woven Filters
7.3 Woven
7.3.1 Low Temperature Applications are Driving the Market for Woven Bag Filters
7.4 Others
8 Bag Filter Market, By Fluid (Page No. - 53)
8.1 Introduction
8.2 Air
8.2.1 Highly Polluting Industries Such as Cement and Power Generation is Driving the Market
8.3 Liquid
8.3.1 Chemical and Other Process Industry Filtration Need is Driving the Market
9 Bag Filter Market, By Application (Page No. - 57)
9.1 Introduction
9.2 Power Generation
9.2.1 Need to Reduce Particulate Matter Emission From Fossil Fuel Generation is Driving the Bag Filter
9.3 Cement
9.3.1 Growing Infrastructure Need is Driving the Demand for Cement Industry Bag Filter Market
9.4 Mining
9.4.1 Necessity to Meet Mining Emission Control Norms is Driving the Market
9.5 Chemical
9.5.1 Stringent Pollution Control Norms on Chemical and Petrochemical Industry is Driving the Market
9.6 Pulp & Paper
9.6.1 Need to Reduce Particulate Matter Emission From Pulp Processing is Driving the Market
9.7 Municipal Waste
9.7.1 Growing Waste Recycling Sectors is Driving the Need for Bag Filters
9.8 Other
10 Bag Filter Market, By Region (Page No. - 65)
10.1 Introduction
10.2 Asia Pacific
10.2.1 Asia Pacific: Bag Filter Market Size, By Country
10.2.2 Asia Pacific: Bag Filter Market Size, By Application
10.2.3 Asia Pacific: Bag Filter Market Size, By Type
10.2.4 Asia Pacific: Bag Filter Market Size, By Media
10.2.5 Asia Pacific: Bag Filter Market Size, By Fluid Type
10.2.6 China
10.2.6.1 Cement Production and Coal Power Plants are Driving the Bag Filters Market
10.2.7 India
10.2.7.1 Growing Poor Air Quality and Industrial Pollution are Driving the Market
10.2.8 Japan
10.2.8.1 Fossil Fuel Power Generation is Driving the Demand for Bag Filters
10.2.9 Australia
10.2.9.1 Mining Industry Pollution Norms are Driving the Demand for Bag Filters
10.2.10 Rest of Asia Pacific
10.2.10.1 Growing Power Demand and Cement Consumption are Driving the Market
10.3 North America
10.3.1 North America: Bag Filter Market Size, By Country
10.3.2 North America: Bag Filter Market Size, By Application
10.3.3 North America: Bag Filter Market Size, By Type
10.3.4 North America: Bag Filter Market Size, By Media
10.3.5 North America: Bag Filter Market Size, By Fluid Type
10.3.6 US
10.3.6.1 Growing Chemical and Cement Industry Demands are Driving the Market
10.3.7 Canada
10.3.7.1 Pollution Control Norms of Chemical and Mining Sectors are Driving the Market
10.3.8 Mexico
10.3.8.1 Planned Infrastructure Spending and Demand for Cement are Expected to Drive the Market
10.4 Europe
10.4.1 Europe: Bag Filter Market Size, By Country
10.4.2 Europe: Bag Filter Market Size, By Application
10.4.3 Europe: Bag Filter Market Size, By Type
10.4.4 Europe: Bag Filter Market Size, By Media
10.4.5 Europe: Bag Filter Market Size, By Fluid Type
10.4.6 Germany
10.4.6.1 Increasing Chemical Consumption is Driving the Market
10.4.7 UK
10.4.7.1 Need for Clean Air Quality is Driving the Market
10.4.8 Italy
10.4.8.1 Increased Infrastructure Spending and Cement Demand are Expected to Drive the Market
10.4.9 France
10.4.9.1 Increased Air Quality Monitoring Regulations are Driving the Market
10.4.10 Russia
10.4.10.1 Mining Industry Pollution Norms are Driving the Market for Bag Filters
10.4.11 Rest of Europe
10.4.11.1 Quality of Breathing Air Regulation Norms is Driving the Market
10.5 South America
10.5.1 South America: Bag Filter Market Size, By Country
10.5.2 South America: Bag Filter Market Size, By Application
10.5.3 South America: Bag Filter Market Size, By Type
10.5.4 South America: Bag Filter Market Size, By Media
10.5.5 Brazil
10.5.5.1 Need to Reduce Dust From Cement Industry is Driving the Market for Bag Filters
10.5.6 Argentina
10.5.6.1 New Construction Activities are Expected to Drive the Market for Bag Filters
10.5.7 Venezuela
10.5.7.1 Cement and Chemical Industry Demand is Driving the Market
10.5.8 Rest of South America
10.5.8.1 Growing Emphasis on Industry Pollution Reduction is Driving the Market
10.6 Middle East & Africa
10.6.1 Middle East & Africa: Bag Filter Market Size, By Country
10.6.2 Middle East & Africa: Bag Filter Market Size, By Application
10.6.3 Middle East & Africa: Bag Filter Market Size, By Type
10.6.4 Middle East & Africa: Bag Filter Market Size, By Media
10.6.5 Middle East & Africa: Bag Filter Market Size, By Fluid Type
10.6.6 South Africa
10.6.6.1 Pollution Control Norms of Mining and Power Sectors are Driving the Market
10.6.7 Saudi Arabia
10.6.7.1 Rising Construction Spending and Mining Industry Pollution Norms are Driving the Market
10.6.8 UAE
10.6.8.1 Air Quality Requirement is Driving the Market for Bag Filters in the UAE
10.6.9 Nigeria
10.6.9.1 Infrastructure Spending is Driving the Market for Bag Filters
10.6.10 Rest of Middle East & Africa
10.6.10.1 Continuous Spending on Infrastructure Developments and Cement Demand are Expected to Drive the Market
11 Competitive Landscape (Page No. - 102)
11.1 Overview
11.2 Ranking of Players and Industry Concentration, 2017
11.3 Competitive Scenario
11.3.1 Mergers & Acquisitions
11.3.2 Contracts & Agreements
11.3.3 New Product Launches
11.3.4 Investments & Expansions
11.3.5 Others
12 Company Profiles (Page No. - 108)
12.1 Company Benchmarking
12.2 Babcock & Wilcox
12.2.1 Business Overview
12.2.2 Products Offered
12.2.3 Recent Developments
12.2.4 MnM View
12.3 Danaher
12.3.1 Business Overview
12.3.2 Products Offered
12.3.3 Recent Developments
12.3.4 MnM View
12.4 Thermax
12.4.1 Business Overview
12.4.2 Products Offered
12.4.3 Recent Developments
12.4.4 MnM View
12.5 Eaton Corporation
12.5.1 Business Overview
12.5.2 Products Offered
12.5.3 Recent Developments
12.5.4 MnM View
12.6 Mitsubishi Hitachi Power Systems
12.6.1 Business Overview
12.6.2 Products Offered
12.7 Donaldson
12.7.1 Business Overview
12.7.2 Products Offered
12.7.3 Recent Developments
12.7.4 MnM View
12.8 General Electric
12.8.1 Business Overview
12.8.2 Products Offered
12.8.3 MnM View
12.9 Parker Hannifin
12.9.1 Business Overview
12.9.2 Products Offered
12.9.3 Recent Developments
12.10 Camfil Farr
12.10.1 Business Overview
12.10.2 Products Offered
12.10.3 Recent Development
12.10.4 MnM View
12.11 BWF Envirotech
12.11.1 Business Overview
12.11.2 Products Offered
12.12 W.L. Gore & Associates
12.12.1 Business Overview
12.12.2 Products Offered
12.12.3 Recent Development
12.13 Lenntech
12.13.1 Business Overview
12.13.2 Products Offered
12.14 Rosedale Products
12.14.1 Business Overview
12.14.2 Products Offered
13 Appendix (Page No. - 142)
13.1 Insights of Industry Experts
13.2 Discussion Guide
13.3 Knowledge Store: Marketsandmarkets’ Subscription Portal
13.4 Available Customizations
13.5 Related Reports
13.6 Author Details
List of Tables (71 Tables)
Table 1 Bag Filter Market Snapshot
Table 2 Recent Air Pollution Monitoring Regulations: 2012–2017
Table 3 Bag Filter Market Size, By Type, 2016–2023 (USD Million)
Table 4 Pulse Jet: Bag Filter Market Size, By Region, 2016–2023 (USD Million)
Table 5 Reverse Air: Bag Filter Market Size, By Region, 2016–2023 (USD Million)
Table 6 Shaker: Bag Filter Market Size, By Region, 2016–2023 (USD Million)
Table 7 Bag Filter Market Size, By Media, 2016–2023 (USD Million)
Table 8 Nonwoven: Bag Filter Market Size, By Region, 2016–2023 (USD Million)
Table 9 Woven: Bag Filter Market Size, By Region, 2016–2023 (USD Million)
Table 10 Others: Bag Filter Market Size, By Region, 2016–2023 (USD Million)
Table 11 Bag Filter Market Size, By Fluid, 2016–2023 (USD Million)
Table 12 Air: Bag Filter Market Size, By Region, 2016–2023 (USD Million)
Table 13 Liquid: Bag Filter Market Size, By Region, 2016–2023 (USD Million)
Table 14 Bag Filter Market Size, By Application, 2016–2023 (USD Million)
Table 15 Power Generation: Bag Filter Market Size, By Region, 2016–2023 (USD Million)
Table 16 Cement: Bag Filter Market Size, By Region, 2016–2023 (USD Million)
Table 17 Mining: Bag Filter Market Size, By Region, 2016–2023 (USD Million)
Table 18 Chemical: Bag Filter Market Size, By Region, 2016–2023 (USD Million)
Table 19 Pulp & Paper: Bag Filter Market Size, By Region, 2016–2023 (USD Million)
Table 20 Annual Regional Waste Generation:
Table 21 Municipal Waste: Bag Filter Market Size, By Region, 2016–2023 (USD Million)
Table 22 Others: Bag Filter Market Size, By Region, 2016–2023 (USD Million)
Table 23 Bag Filter Market Size, By Region, 2016–2023 (USD Million)
Table 24 Asia Pacific: Bag Filter Market Size, By Country, 2016–2023 (USD Million)
Table 25 Asia Pacific: Bag Filter Market Size, By Application, 2016–2023 (USD Million)
Table 26 Asia Pacific: Bag Filter Market Size, By Type, 2016–2023 (USD Million)
Table 27 Asia Pacific: Bag Filter Market Size, By Media, 2016–2023 (USD Million)
Table 28 Asia Pacific: Bag Filter Market Size, By Fluid Type, 2016–2023 (USD Million)
Table 29 China: Bag Filter Market Size, By Application, 2016–2023 (USD Million)
Table 30 India: Bag Filter Market Size, By Application, 2016–2023 (USD Million)
Table 31 Japan: Bag Filter Market Size, By Application, 2016–2023 (USD Million)
Table 32 Australia: Bag Filter Market Size, By Application, 2016–2023 (USD Million)
Table 33 Rest of Asia Pacific: Bag Filter Market Size, By Application, 2016–2023 (USD Million)
Table 34 North America: Bag Filter Market Size, By Country, 2016–2023 (USD Million)
Table 35 North America: Bag Filter Market Size, By Application, 2016–2023 (USD Million)
Table 36 North America: Bag Filter Market Size, By Type, 2016–2023 (USD Million)
Table 37 North America: Bag Filter Market Size, By Media, 2016–2023 (USD Million)
Table 38 North America: Bag Filter Market Size, By Fluid Type, 2016–2023 (USD Million)
Table 39 US: Bag Filter Market Size, By Application, 2016–2023 (USD Million)
Table 40 Canada: Bag Filter Market Size, By Application, 2016–2023 (USD Million)
Table 41 Mexico: Bag Filter Market Size, By Application, 2016–2023 (USD Million)
Table 42 Europe: Bag Filter Market Size, By Country, 2016–2023 (USD Million)
Table 43 Europe: Bag Filter Market Size, By Application, 2016–2023 (USD Million)
Table 44 Europe: Bag Filter Market Size, By Type, 2016–2023 (USD Million)
Table 45 Europe: Bag Filter Market Size, By Media, 2016–2023 (USD Million)
Table 46 Europe: Bag Filter Market Size, By Fluid Type, 2016–2023 (USD Million)
Table 47 Germany: Bag Filter Market Size, By Application, 2016–2023 (USD Million)
Table 48 UK: Bag Filter Market Size, By Application, 2016–2023 (USD Million)
Table 49 Italy: Bag Filter Market Size, By Application, 2016–2023 (USD Million)
Table 50 France: Bag Filter Market Size, By Application, 2016–2023 (USD Million)
Table 51 Russia: Bag Filter Market Size, By Application, 2016–2023 (USD Million)
Table 52 Rest of Europe: Bag Filter Market Size, By Application, 2016–2023 (USD Million)
Table 53 South America: Bag Filter Market Size, By Country, 2016–2023 (USD Million)
Table 54 South America: Bag Filter Market Size, By Application, 2016–2023 (USD Million)
Table 55 South America: Bag Filter Market Size, By Type, 2016–2023 (USD Million)
Table 56 South America: Bag Filter Market Size, By Media, 2016–2023 (USD Million)
Table 57 Brazil: Bag Filter Market Size, By Application, 2016–2023(USD Million)
Table 58 Argentina: Bag Filter Market Size, By Application, 2016–2023(USD Million)
Table 59 Venezuela: Bag Filter Market Size, By Application, 2016–2023(USD Million)
Table 60 Rest of South America: Bag Filter Market Size, By Application, 2016–2023(USD Million)
Table 61 Middle East & Africa: Bag Filter Market Size, By Country, 2016–2023 (USD Million)
Table 62 Middle East & Africa: Bag Filter Market Size, By Application, 2016–2023(USD Million)
Table 63 Middle East & Africa: Bag Filter Market Size, By Type, 2016–2023(USD Million)
Table 64 Middle East & Africa: Bag Filter Market Size, By Media, 2016–2023(USD Million)
Table 65 Middle East & Africa: Bag Filter Market Size, By Fluid Type, 2016–2023(USD Million)
Table 66 South Africa: Bag Filter Market Size, By Application, 2016–2023(USD Million)
Table 67 Saudi Arabia: Bag Filter Market Size, By Application, 2016–2023(USD Million)
Table 68 UAE: Bag Filter Market Size, By Application, 2016–2023(USD Million)
Table 69 Nigeria: Bag Filter Market Size, By Application, 2016–2023 (USD Million)
Table 70 Rest of Middle East & Africa: Bag Filter Market Size, By Application, 2016–2023 (USD Million)
Table 71 Babcock & Wilcox and Donaldson Were the Most Active Players in the Market Between 2015 and 2018
List of Figures (37 Figures)
Figure 1 Research Design
Figure 2 Bottom-Up Approach
Figure 3 Top-Down Approach
Figure 4 North America is Estimated to Dominate the Bag Filter Market in 2018
Figure 5 Pulse Jet Segment is Expected to Grow at the Highest CAGR During the Forecast Period
Figure 6 Nonwoven Segment is Expected to Lead the Bag Filter Market During the Forecast Period
Figure 7 Air Segment is Expected to Grow at the Highest CAGR During the Forecast Period
Figure 8 Cement Segment is Expected to Grow at the Highest CAGR During the Forecast Period
Figure 9 Environment & Safety Regulations of Different Governments to Reduce Air Pollution are Driving the Bag Filter Market From 2018–2023
Figure 10 Pulse Jet Segment and China Dominated the Bag Filter Market in Asia Pacific
Figure 11 Cement Industry Segment is Expected to Dominate the Bag Filter Market During the Forecast Period
Figure 12 Nonwoven Segment Dominated the Bag Filter Market, By Media Type, in 2017
Figure 13 Air Segment is Expected to Grow at the Highest CAGR During the Forecast Period
Figure 14 Bag Filter Market: Drivers, Restraints, Opportunities, & Challenges
Figure 15 US Pm10 Concentration in Air Quality, 2012–2016 (µg/M3)
Figure 16 Global Cement Production, 2017 (In Mtpa)
Figure 17 India Gross Value Added From Mining and Quarrying, 2012–2017 (In USD Billion)
Figure 18 Annual GDP Growth of Major Countries 2012–2017, (In %)
Figure 19 Global Renewable Energy Based Generation, 2012–2017, (In TWH)
Figure 20 Bag Filter Market, By Type, 2018–2023 (USD Million)
Figure 21 Bag Filter Market, By Media, 2018–2023 (USD Million)
Figure 22 Bag Filter Market, By Fluid, 2018–2023 (USD Million)
Figure 23 Bag Filter Market, By Application, 2018–2023 (USD Million)
Figure 24 Regional Snapshot: the Asia Pacific Market is Expected to Grow at the Highest CAGR During the Forecast Period
Figure 25 Bag Filter Market Share (Value), By Region, 2023
Figure 26 Asia Pacific: Regional Snapshot
Figure 27 Europe: Regional Snapshot
Figure 28 Key Developments in the Bag Filter Market, 2015–2018
Figure 29 Babcock & Wilcox LED the Bag Filter Market in 2017
Figure 30 Babcock & Wilcox: Company Snapshot
Figure 31 Danaher: Company Snapshot
Figure 32 Thermax: Company Snapshot
Figure 33 Eaton Corporation: Company Snapshot
Figure 34 Donaldson: Company Snapshot
Figure 35 General Electric: Company Snapshot
Figure 36 Parker Hannifin: Company Snapshot
Figure 37 Camfil Farr: Company Snapshot


Growth opportunities and latent adjacency in Bag Filter Market