Automated Container Terminal Market by Degree of Automation (Semi-Automated and Fully Automated), Project Type (Brownfield and Greenfield), Offering (Equipment, Software, and Services), and Geography - Global Forecast to 2023


[141 Pages Report] The automated container terminal market was valued at USD 8.84 Billion in 2017 and is expected to reach USD 10.89 Billion by 2023, at a CAGR of 3.7% during the forecast period. The base year used for this study is 2017, and the forecast period considered is between 2018 and 2023.
The objectives of the study are as follows:
- To define, describe, and forecast the automated container terminal market, in terms of value, segmented on the basis of the degree of automation, offering, project type, and geography
- To forecast the automated container terminal market, in terms of volume, on the basis of equipment
- To define, describe, segment, and forecast the market for tracking solutions used in the ports and terminals
- To provide detailed information regarding the major factors influencing the growth of the automated container terminal market (drivers, restraints, opportunities, and industry-specific challenges)
- To strategically analyze the micromarkets with respect to individual growth trends, prospects, and contribution to the total market
- To analyze opportunities in the market for various stakeholders by identifying the high-growth segments of the market
- To analyze the market with respect to 4 main regions: North America, Europe, Asia Pacific (APAC), and Rest of the World (RoW)
- To analyze various growth strategies, such as contracts, collaborations, partnerships, acquisitions, product launches and developments, and expansions, adopted by the key players in the market
- To strategically profile the key players and comprehensively analyze their market ranking and core competencies, and provide a detailed competitive landscape for the market leaders
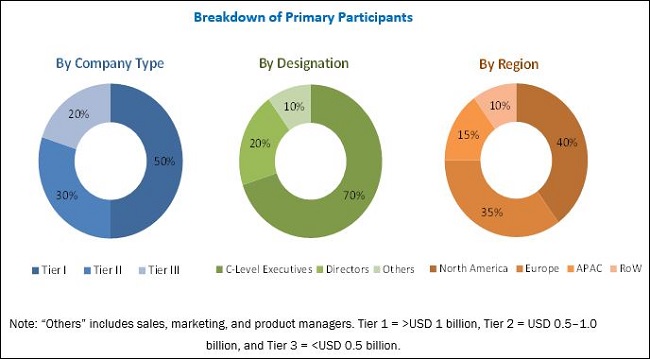
The research methodology used to estimate and forecast the automated container terminal market begins with obtaining data on key vendor revenues through secondary research. Some secondary sources used in this research include journals and databases such as IEEE journals, Port Technology International (PTI) journal and magazines, Factiva, Hoovers, and OneSource. Moreover, vendor offerings have been taken into consideration to determine the market segmentation. The bottom-up procedure has been employed to arrive at the overall size of the market from the revenue of the key players in the market. After arriving at the overall market size, the total market has been split into several segments and subsegments, which have been verified through primary research by conducting extensive interviews with the officials holding key positions in the industry, such as CEOs, VPs, directors, and executives. The market breakdown and data triangulation procedures have been employed to complete the overall market engineering process and arrive at the exact statistics for all segments and subsegments. The breakdown of profiles of primaries has been depicted in the following figure:
To know about the assumptions considered for the study, download the pdf brochure
The automated container terminal ecosystem comprises companies such as Cargotec (Finland) , Konecranes (Finland), ZPMC (China), Liebherr (Switzerland), ABB (Switzerland), K�nz (Austria), CyberLogitec (South Korea), IDENTEC SOLUTIONS (Austria), Camco Technologies (Belgium), and ORBCOMM (US).
Target Audience:
- Manufacturing associations and industrial bodies
- Component suppliers and distributors
- End users of automated container terminal equipment and solutions
- Government bodies such as regulatory authorities and policymakers
- Industrial automation equipment providers
- Market research and consulting firms
- Original equipment manufacturers (OEMs)
�The study answers several questions for the target audience, primarily which market segments to focus on in the next 2 to 5 years for prioritizing their efforts and investments.�
Report Scope:
In this report, the automated container terminal market has been segmented into the following categories:
Automated Container Terminal Market, by Degree of Automation
- Semi-Automated Terminals
- Fully Automated Terminals
Automated Container Terminal Market, by Project Type
- Brownfield Projects
- Greenfield Projects
Automated Container Terminal Market, by Offering
- Equipment
- Software
- Services
Geographic Analysis
- North America (US, Canada, and Mexico)
- Europe (Germany, Spain, UK, Italy, and Rest of Europe)
- Asia Pacific (China, Japan, Australia, South Korea, and Rest of APAC)
- Rest of the World (South America, Middle East, and Africa)
Available Customizations:
With the given market data, MarketsandMarkets offers customizations according to the specific requirements of the company. The following customization options are available for the report:
Company Information
Detailed analysis and profiling of additional market players (up to 5)
The overall automated container terminal market is estimated to grow from USD 9.09 Billion in 2018 to USD 10.89 Billion by 2023, at a CAGR of 3.7% between 2018 and 2023. The growth of this market is being driven by the growing demand for large container ships, increasing labor cost in developed nations, and growing competition among container terminals.
The report covers the automated container terminal market segmented on the basis of the degree of automation, project type, offering, and geography. The �services� segment is expected to hold the largest size of the market, based on offering, by 2023. Services are important for the proper functioning of equipment. In automated terminals, even a minor defect in any equipment can cause a serious loss of productivity. Therefore, the service contracts are increasing in number, thereby driving the growth of the market for the same.
�Semi-automated terminals� held a larger size of the overall automated container terminal market based on the degree of automation. The adoption of semi-automated terminals is increasing rapidly compared to the fully-automated terminals as the investment required for building a semi-automated terminal is lower than that for the fully automated terminals. In the developing regions such as APAC, South America, and Africa, the significant increase in the investments for the development of semi-automated terminals is fueling the growth of the market for these terminals.
The automated container terminal market for the brownfield projects is expected to grow at a higher CAGR during the forecast period. Increasingly stringent environmental regulations by the governments affect the implementation of greenfield projects in the developed countries. Companies are working on various projects to automate the existing terminals partially or wholly to help with cost saving and maximum utilization of resources. The automation of existing terminals is advantageous due to access to low-cost resources and existing infrastructure.
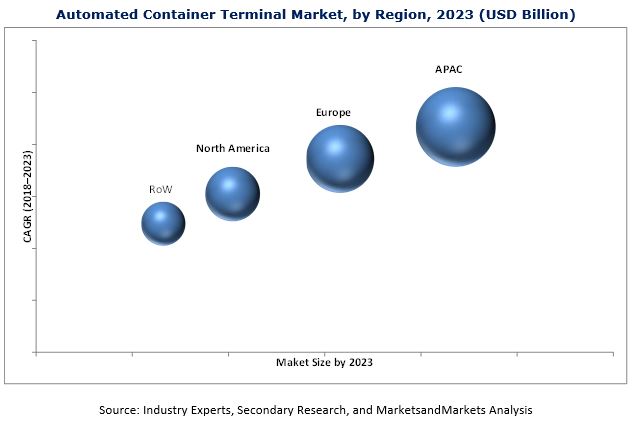
APAC held the largest size of the automated container terminal market in 2017. Rapid industrialization, increasing maritime trade, and growing investment in ports and terminals to achieve operational efficiency are the factors fueling the growth of the market in APAC. The automated container terminal market in APAC is expected to grow the highest CAGR during the forecast period. Europe is the second-largest market for automated container terminals. The region is an early adopter of automation in ports and terminals. Further, favorable government policies and initiatives in countries such as Germany, Spain, and Italy have encouraged the growth of the market in this region. In addition, some of the leading automated container terminal manufacturers such as Cargotec, Konecranes, Liebherr, and ABB are present in the region.
In recent years, though automation at ports and terminals has emerged as a potential technology that increases productivity and enhances the operational efficiency of the terminals, it also encompasses a few drawbacks that hamper its market growth. The major hindrance to the growth of the automated container terminal is the requirement of high initial investment cost for the implementation of automated container terminals. A huge amount of investment is required for building a new terminal, and even more money is required for the modernization of the existing one. Further, the replacement and upgrading of existing equipment and software systems also require a huge amount of investment.
Cargotec (Finland), Konecranes (Finland), ZPMC (China), Liebherr (Switzerland), ABB (Switzerland), K�nz (Austria), CyberLogitec (South Korea), IDENTEC SOLUTIONS (Austria), Camco Technologies (Belgium), and ORBCOMM (US) are some major companies operating in the automated container terminal market.
To speak to our analyst for a discussion on the above findings, click Speak to Analyst
Table of Contents
1 Introduction (Page No. - 16)
1.1 Objectives of Study
1.2 Definition
1.3 Scope of Study
1.3.1 Markets Covered
1.3.2 Geographic Scope
1.3.3 Years Considered for Study
1.4 Currency
1.5 Limitations
1.6 Stakeholders
2 Research Methodology (Page No. - 19)
2.1 Research Data
2.2 Secondary and Primary Research
2.2.1 Secondary Data
2.2.1.1 Secondary Sources
2.2.2 Primary Data
2.2.2.1 Key Data From Primary Sources
2.2.2.2 Key Industry Insights
2.2.2.3 Breakdown of Primaries
2.2.2.4 Primary Interviews With Experts
2.3 Market Size Estimation
2.3.1 Bottom-Up Approach
2.3.1.1 Approach for Capturing Market Share By Bottom-Up Analysis (Demand Side)
2.3.2 Top-Down Approach
2.3.2.1 Approach for Capturing Market Share By Top-Down Analysis (Supply Side)
2.4 Market Breakdown and Data Triangulation
2.5 Research Assumptions
3 Executive Summary (Page No. - 28)
4 Premium Insights (Page No. - 32)
4.1 Attractive Growth Opportunities in Automated Container Terminal Market
4.2 Market for Equipment, By Type
4.3 Market, By Project Type
4.4 Market, By Offering and Country
4.5 Market, By Geography
5 Market Overview (Page No. - 35)
5.1 Introduction
5.2 Market Dynamics
5.2.1 Drivers
5.2.1.1 Growing Demand for Large Container Ships
5.2.1.2 Increasing Labor Cost in Developed Countries
5.2.1.3 Growing Competition Among Container Terminals
5.2.2 Restraints
5.2.2.1 The Requirement of High Initial Cost for the Implementation of Automated Container Terminals
5.2.3 Opportunities
5.2.3.1 Integration of IoT in Terminal Automation
5.2.4 Challenges
5.2.4.1 The Complexity Involved in Terminal Automation
5.2.4.2 Lack of Support From Trade Unions
5.3 Value Chain Analysis
6 Tracking Solutions Market for Ports and Terminals (Page No. - 40)
6.1 Introduction
6.2 Radio Frequency Identification (RFID)
6.2.1 Decreasing Cost of RFID Tags Encourages Adoption of RFID
6.3 Optical Character Recognition (OCR)
6.3.1 Low Cost of OCR Technology Encourages Its Adoption at Ports and Terminals
7 Market, By Degree of Automation (Page No. - 44)
7.1 Introduction
7.2 Semi-Automated Container Terminal
7.2.1 Advantages of Semi-Automated Container Terminals
7.2.2 Challenges to Adoption of Semi-Automated Container Terminals
7.2.3 Case Study: Virginia International Gateway (Vig)
7.3 Fully Automated Container Terminal
7.3.1 Advantages of Fully Automated Container Terminals
7.3.2 Challenges to Adoption of Fully Automated Container Terminals
7.3.3 Case Study: Shanghai Yangshan Deep Water Port
8 Market, By Project Type (Page No. - 56)
8.1 Introduction
8.2 Brownfield Projects
8.2.1 Rising Demand for Automation of Existing Terminals By Developed Countries
8.3 Greenfield Projects
8.3.1 Increasing Investment in Greenfield Projects By Developing Nations
9 Market, By Offering (Page No. - 62)
9.1 Introduction
9.2 Equipment
9.2.1 Ship-To-Shore (STS) Cranes
9.2.1.1 Increasing Container Size Leads to the Need for Advanced STS Cranes
9.2.2 Automated Stacking Cranes (ASCS)
9.2.2.1 The Increasing Need for Productivity in Port Operations is Likely to Drive the Adoption of ASCS
9.2.3 Rubber-Tired Gantry (RTG) Cranes
9.2.3.1 The Adoption of RTG Cranes is Expected to Decline in Future Due to Various Limitations
9.2.4 Automated Guided Vehicles (AGVS)
9.2.4.1 Intensified Global Trade and Competition Created the Need for Advanced Port Technologies
9.2.5 Straddle Carriers
9.2.6 Shuttle Carriers
9.3 Software
9.3.1 Growing Challenges Around the Terminal Operations Business Encourage the Adoption of Advanced Information Technology Systems
9.4 Services
9.4.1 Increasing Service Contracts By the Key Market Players
10 Geographic Analysis (Page No. - 75)
10.1 Introduction
10.2 North America
10.2.1 US
10.2.2 Canada
10.2.3 Mexico
10.3 Europe
10.3.1 Germany
10.3.2 Spain
10.3.3 UK
10.3.4 Italy
10.3.5 Rest of Europe
10.4 APAC
10.4.1 China
10.4.2 Japan
10.4.3 Australia
10.4.4 South Korea
10.4.5 Rest of APAC
10.5 Rest of the World (RoW)
10.5.1 South America
10.5.2 Middle East
10.5.3 Africa
11 Competitive Landscape (Page No. - 101)
11.1 Overview
11.2 Market Ranking Analysis, 2016
11.3 Competitive Situation and Trends
11.3.1 Product Launches
11.3.2 Expansions
11.3.3 Contracts, Collaborations, Partnerships, and Agreements
11.3.4 Acquisitions
12 Company Profiles (Page No. - 106)
(Business Overview, Products Offered, Recent Developments, SWOT Analysis, and MnM View)*
12.1 Key Players
12.1.1 Cargotec
12.1.2 Konecranes
12.1.3 ZPMC
12.1.4 Liebherr
12.1.5 ABB
12.1.6 K�nz
12.1.7 Cyberlogitec
12.1.8 Camco Technologies
12.1.9 Identec Solutions
12.1.10 Orbcomm
12.2 Other Companies
12.2.1 Orbita Ports&Terminals
12.2.2 Paceco
12.2.3 Total Soft Bank (TSB)
12.2.4 Inform Software
12.2.5 Logstar
12.2.6 Infyz Solutions
12.2.7 Tidework Technology
12.2.8 Loginno
12.2.9 World Crane Services
12.2.10 Starcomm Systems
*Details on Business Overview, Products Offered, Recent Developments, SWOT Analysis, and MnM View Might Not Be Captured in Case of Unlisted Companies.
13 Appendix (Page No. - 133)
13.1 Insights of Industry Experts
13.2 Discussion Guide
13.3 Knowledge Store: Marketsandmarkets� Subscription Portal
13.4 Introducing RT: Real-Time Market Intelligence
13.5 Available Customizations
13.6 Related Reports
13.7 Author Details
List of Tables (67 Tables)
Table 1 Major Secondary Sources
Table 2 Tracking Solutions Market for Ports and Terminals, 2015�2023 (USD Million)
Table 3 Automated Container Terminal Market, By Degree of Automation, 2015�2023 (USD Billion)
Table 4 Market for Semi-Automated Terminals, By Offering, 2015�2023 (USD Million)
Table 5 Market for Semi-Automated Terminal, By Region, 2015�2023 (USD Million)
Table 6 Market for Semi-Automated Terminals, By Project Type, 2015�2023 (USD Million)
Table 7 Market for Semi-Automated Terminals in North America, By Country, 2015�2023 (USD Million)
Table 8 Market for Semi-Automated Terminals in Europe, By Country, 2015�2023 (USD Million)
Table 9 Market for Semi-Automated Terminals in APAC, By Country, 2015�2023 (USD Million)
Table 10 Market for Semi-Automated Terminals in RoW, By Region, 2015�2023 (USD Million)
Table 11 Market for Fully Automated Terminals, By Offering, 2015�2023 (USD Million)
Table 12 Market for Fully Automated Terminals, By Region, 2015�2023 (USD Million)
Table 13 Market for Fully Automated Terminals, By Project Type, 2015�2023 (USD Billion)
Table 14 Market for Fully Automated Terminals in North America, By Country, 2015�2023 (USD Million)
Table 15 Market for Fully Automated Terminals in Europe, By Country, 2015�2023 (USD Million)
Table 16 Market for Fully Automated Terminals in APAC, By Country, 2015�2023 (USD Million)
Table 17 Market for Fully Automated Terminals in RoW, By Region, 2015�2023 (USD Million)
Table 18 Market, By Project Type, 2015�2023 (USD Billion)
Table 19 Market for Brownfield Projects, By Offering, 2015�2023 (USD Million)
Table 20 Market for Brownfield Projects, By Degree of Automation, 2015�2023 (USD Billion)
Table 21 Market for Greenfield Projects, By Offering, 2015�2023 (USD Million)
Table 22 Market for Greenfield Projects, By Degree of Automation, 2015�2023 (USD Billion)
Table 23 Market, By Offering, 2015�2023 (USD Billion)
Table 24 Automated Controller Market for STS Cranes in Terms of Value and Volume, 2015�2023
Table 25 Automated Controller Market for ASCS in Terms of Value and Volume, 2015�2023
Table 26 Automated Controller Market for RTG Cranes in Terms of Value and Volume, 2015�2023
Table 27 Market for Equipment, By Type, 2015�2023 (USD Million)
Table 28 Market for Equipment, By Degree of Automation, 2015�2023 (USD Billion)
Table 29 Market for Equipment, By Project Type, 2015�2023 (USD Billion)
Table 30 Market for Equipment, By Region, 2015�2023 (USD Million)
Table 31 Market for Software, By Degree of Automation, 2015�2023 (USD Billion)
Table 32 Market for Software, By Project Type, 2015�2023 (USD Million)
Table 33 Market for Software, By Region, 2015�2023 (USD Million)
Table 34 Market for Services, By Type, 2015�2023 (USD Million)
Table 35 Market for Services, By Degree of Automation, 2015�2023 (USD Billion)
Table 36 Market for Services, By Project Type, 2015�2023 (USD Billion)
Table 37 Market for Services, By Region, 2015�2023 (USD Million)
Table 38 Market, By Region, 2015�2023 (USD Billion)
Table 39 Market in North America, By Country, 2015�2023 (USD Million)
Table 40 Market in North America, By Degree of Automation, 2015�2023 (USD Million)
Table 41 Market in North America, By Offering, 2015�2023 (USD Million)
Table 42 Market in US, By Degree of Automation, 2015�2023 (USD Million)
Table 43 Market in Canada, By Degree of Automation, 2015�2023 (USD Million)
Table 44 Market in Mexico, By Degree of Automation, 2015�2023 (USD Million)
Table 45 Market in Europe, By Country, 2015�2023 (USD Million)
Table 46 Market in Europe, By Degree of Automation, 2015�2023 (USD Million)
Table 47 Market in Europe, By Offering, 2015�2023 (USD Million)
Table 48 Market in Germany, By Degree of Automation, 2015�2023 (USD Million)
Table 49 Market in Spain, By Degree of Automation, 2015�2023 (USD Million)
Table 50 Market in UK, By Degree of Automation, 2015�2023 (USD Million)
Table 51 Market in Italy, By Degree of Automation, 2015�2023 (USD Million)
Table 52 Market in Rest of Europe, By Degree of Automation, 2015�2023 (USD Million)
Table 53 Market in APAC, By Country, 2015�2023 (USD Million)
Table 54 Market in APAC, By Degree of Automation, 2015�2023 (USD Billion)
Table 55 Market in APAC, By Offering, 2015�2023 (USD Million)
Table 56 Market in China, By Degree of Automation, 2015�2023 (USD Million)
Table 57 Market in Japan, By Degree of Automation, 2015�2023 (USD Million)
Table 58 Market in Australia, By Degree of Automation, 2015�2023 (USD Million)
Table 59 Market in South Korea, By Degree of Automation, 2015�2023 (USD Million)
Table 60 Market in Rest of APAC, By Degree of Automation, 2015�2023 (USD Million)
Table 61 Market in RoW, By Region, 2015�2023 (USD Million)
Table 62 Market in RoW, By Degree of Automation, 2015�2023 (USD Million)
Table 63 Market in RoW, By Offering, 2015�2023 (USD Million)
Table 64 Market in South America, By Degree of Automation, 2015�2023 (USD Million)
Table 65 Market in Middle East, By Degree of Automation, 2015�2023 (USD Million)
Table 66 Market in Africa, By Degree of Automation, 2015�2023 (USD Million)
Table 67 Ranking of Top 5 Players in Market, 2017
List of Figures (54 Figures)
Figure 1 Automated Container Terminal Market: Research Design
Figure 2 Bottom-Up Approach to Arrive at the Market Size
Figure 3 Top-Down Approach to Arrive at the Market Size
Figure 4 Data Triangulation
Figure 5 Market for Semi-Automated Terminals to Grow at Higher CAGR During Forecast Period
Figure 6 Market for Software to Grow at Highest CAGR Between 2018 and 2023
Figure 7 Market for Brownfield Projects to Grow at Higher CAGR Between 2018 and 2023
Figure 8 Market for AGVS to Grow at Highest CAGR Between 2018 and 2023
Figure 9 Market in APAC to Grow at Highest CAGR During Forecast Period
Figure 10 Increasing Need to Improve Productivity of Ports and Terminals Drives Growth of the market Between 2018 and 2023
Figure 11 Market for AGVS to Grow at Highest CAGR During Forecast Period
Figure 12 Automate Container Terminal Market for Brownfield Projects to Grow at Higher CAGR Between 2018 and 2023
Figure 13 Services to Hold Largest Share of the market in North America By 2018
Figure 14 US to Account for Largest Share of the market By 2018
Figure 15 Growing Demand for Large Container Ships Drives Growth of the market
Figure 16 Growth in Container-Carrying Capacity of Ships Between 2002 and 2018
Figure 17 Value Chain Analysis: Maximum Value is Added During Manufacturing and System Integration Stages
Figure 18 Tracking Solutions for Ports and Terminals
Figure 19 Tracking Solutions Market for OCR to Grow at Higher CAGR During Forecast Period
Figure 20 Market, By Degree of Automation
Figure 21 Services to Dominate Semi-Automated Terminal Market During Forecast Period
Figure 22 Semi-Automated Terminal Market for Brownfield Projects to Grow at Higher CAGR During Forecast Period
Figure 23 China to Dominate Market for Semi-Automated Container Terminals During Forecast Period
Figure 24 Services to Dominate Market for Fully Automated Terminals During Forecast Period
Figure 25 Brownfield Projects to Dominate Market for Fully Automated Terminals During Forecast Period
Figure 26 Market for Fully Automated Terminals in China to Grow at Highest CAGR During Forecast Period
Figure 27 Market, By Project Type
Figure 28 Market for Services to Grow at Highest CAGR During Forecast Period
Figure 29 Services to Dominate Market for Greenfield Projects During Forecast Period
Figure 30 Market, By Offering
Figure 31 Market for Equipment, By Type
Figure 32 Semi-Automated Terminals to Dominate the market for Equipment During Forecast Period
Figure 33 Automated Container Terminal Software Market for Fully Automated Terminals to Grow at Higher CAGR Between 2018 and 2023
Figure 34 Spare Parts to Dominate the market for Services During Forecast Period
Figure 35 Geographic Snapshot: Global Market
Figure 36 Market in Mexico to Grow at Highest CAGR During Forecast Period
Figure 37 Snapshot: Market in North America
Figure 38 Semi-Automated Terminals to Dominate Market in Canada During Forecast Period
Figure 39 Market in Europe for Software to Grow at Highest CAGR Between 2018 and 2023
Figure 40 Snapshot: Market in Europe
Figure 41 Semi-Automated Terminals to Lead the market in Spain During Forecast Period
Figure 42 Market in Italy for Semi-Automated Terminals to Grow at Highest CAGR During Forecast Period
Figure 43 China to Lead the market in APAC During Forecast Period
Figure 44 Snapshot: Market in APAC
Figure 45 Market in Japan for Semi-Automated Terminals to Grow at Highest CAGR During Forecast Period
Figure 46 South America to Dominate the market During Forecast Period
Figure 47 Market in South America for Semi-Automated Terminals to Grow at Highest CAGR During Forecast Period
Figure 48 Market Players Adopted Contracts as Key Growth Strategy Between 2015 and 2017
Figure 49 Cargotec: Company Snapshot
Figure 50 Konecranes: Company Snapshot
Figure 51 ZPMC: Company Snapshot
Figure 52 Liebherr: Company Snapshot
Figure 53 ABB: Company Snapshot
Figure 54 Orbcomm: Company Snapshot


Growth opportunities and latent adjacency in Automated Container Terminal Market