Ceramic Adhesives Market by Chemistry Type (Cement-based, Epoxy, Acrylic, Silicone, Cyanoacrylate), Application (Building & Construction, Dental), Region (APAC, Europe, North America, MEA, Central & South America) - Global Forecast to 2022


[151 Pages Report] ceramic adhesives market was valued at USD 5.82 Billion in 2016 and is projected to reach USD 7.84 Billion by 2022, at a CAGR of 5.1% from 2017 to 2022. In this study on the ceramic adhesives market, 2016 has been considered as the base year while the forecast period has been considered from 2017 to 2022.
This report aims to estimate the size and future growth of the ceramic adhesives market and its different segments based on chemistry type, application, and region. It analyzes the opportunities for the stakeholders in the ceramic adhesives market and presents a competitive landscape for market leaders. It also provides information on factors such as drivers, restraints, opportunities, and industry-specific challenges influencing the growth of the ceramic adhesives market.
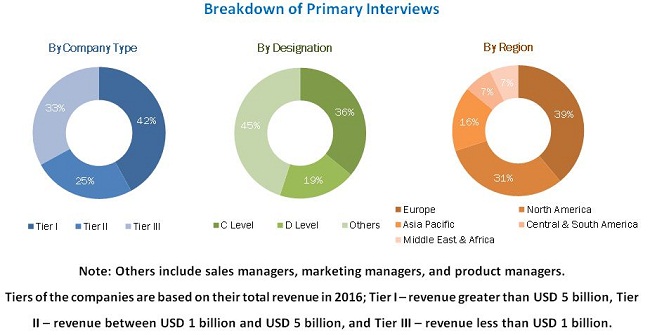
Both, top-down and bottom-up approaches have been used to estimate and validate the size of the ceramic adhesives market as well as its various other dependent submarkets. The research study that has been carried out involved the extensive use of secondary sources, directories, and databases such as Hoovers, Bloomberg, Chemical Weekly, Factiva, related associations/institutes, and other government associations. Private and company websites have also been used to identify and collect information useful for this technical, market-oriented, and commercial study of the ceramic adhesives market. After arriving at the total market size, the overall market has been split into several segments and subsegments. The figure that has been given below provides a breakdown of primaries conducted during the research study based on company type, designation, and region.
To know about the assumptions considered for the study, download the pdf brochure
Key manufacturers of ceramic adhesives across the globe are 3M (US), Bostik (France), Sika (Switzerland), Henkel (Germany), H.B. Fuller Construction Products (US), BASF (Germany), MAPEI (Italy), Ardex (Germany), Laticrete International (US), Terraco (Sweden), Saint-Gobain Weber (France), and Fosroc (UK).
Key Target Audience:
- Manufacturers of Ceramic Adhesives and Their Raw Materials
- Raw Material Suppliers
- Manufacturers of Ceramic Adhesives Used in Various Application Industries
- Traders, Distributors, and Suppliers of Ceramic Adhesives
- Regional Ceramic Adhesives Manufacturers Associations and General Ceramic Adhesives Associations
- Non-Governmental Organizations, Governments, Investment Banks, Venture Capitalists, and Private Equity Firms
Scope of the Report:
This research report categorizes the ceramic adhesives market based on chemistry type, application, and region.
Ceramic Adhesives Market, by Chemistry Type:
- Cement-based
- Epoxy
- Acrylic
- Silicone
- Cyanoacrylate
- Others ( Polyvinyl Acetate, Polyurethane, and Other Reaction Resins)
Ceramic Adhesives Market, by Application:
- Building & Construction
- Dental
- Others (Airports, Automotive, Swimming Pools, Decorations, Electronics & Electrical, and Railway Platforms)
Ceramic Adhesives Market, by Region:
- Asia Pacific
- Europe
- North America
- Middle East & Africa
- Central & South America
Available Customizations:
Along with the given market data, MarketsandMarkets offers customizations according to the specific requirements of companies. The following customization options are available for the report:
Regional Analysis:
- Country-level analysis of the ceramic adhesives market based on application
Company Information:
- Detailed analysis and profiles of additional market players
The ceramic adhesives market is projected to grow from USD 6.12 Billion in 2017 to USD 7.84 Billion by 2022, at a CAGR of 5.1% from 2017 to 2022. The growth of the ceramic adhesives market can be attributed to the growing number of building & construction activities in emerging economies such as India, China, Indonesia, and Brazil, which has led to increased demand for ceramic adhesives from the building & construction industry.
Among applications, the building & construction segment is expected to lead the ceramic adhesives market in 2017, in terms of volume. The rising demand for new and innovative ceramic adhesives, which are eco-friendly and have a low content of Volatile Organic Compounds (VOCs), and increasing number of R&D activities for their development have led companies to adopt various organic and inorganic growth strategies to increase their shares in the ceramic adhesives market.
Based on chemistry type, the cement-based segment is expected to lead the ceramic adhesives market, in terms of both volume and value, during the forecast period. The epoxy segment of the ceramic adhesives market is also expected to grow at a significant rate, in terms of value, during the forecast period. Epoxy ceramic adhesives are widely used in a number of end-use industries, especially in niche applications, wherein excellent bonding strength is required. Moreover, these adhesives also offer excellent strength and versatility. Epoxy ceramic adhesives are also used in several applications such as consumer Do-It-Yourself (DIY), owing to their versatility. However, consumption of these adhesives is limited to a few specific applications due to their high prices.
The Asia Pacific ceramic adhesives market is projected to grow at the highest rate during the forecast, in terms of both, value as well as volume. Manufacturers of ceramic adhesives are targeting the Asia Pacific region as it has the largest construction industry in the world, which accounts for a share of 40% of the global construction spending.
The China ceramic adhesives market is projected to witness significant growth during the forecast period due to the continuous shift of the ceramic adhesives production facilities of various companies to the country. Countries such as India, Thailand, and Indonesia are witnessing increased investments in their building & construction industry, which is likely to influence the growth of the ceramic adhesives market in these countries.
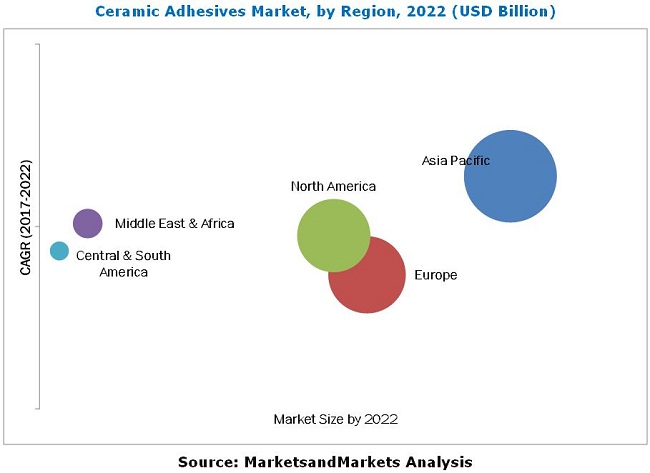
The growth of the ceramic adhesives market may be restrained due to the stringent implementation of various environmental regulations in the North American and European region on using or manufacturing ceramic adhesives. Global manufacturers of ceramic adhesives are focusing on ensuring safety and avoiding health issues associated with emissions of Volatile Organic Compounds (VOC) from chemical products used in the manufacturing of ceramic adhesives. This is also affecting the production capacities of manufacturers of ceramic adhesives in the European and North American regions.
3M (US), Bostik (France), Sika (Switzerland), Henkel (Germany), H.B. Fuller Construction Products (US), BASF (Germany), MAPEI (Italy), Ardex (Germany), Laticrete International (US), Terraco (Sweden), Saint-Gobain Weber (France), and Fosroc (UK) are the key players operating in the ceramic adhesives market. Diverse product portfolios, strategically positioned R&D centers, adoption of inorganic and organic growth strategies, and technological advancements are some of the factors that have helped these companies strengthen their position in the ceramic adhesives market.
To speak to our analyst for a discussion on the above findings, click Speak to Analyst
Table of Contents
1 Introduction (Page No. - 16)
1.1 Objectives of THE Study
1.2 Market Definition
1.3 Market Scope
1.3.1 Years Considered for THE Study
1.4 Currency
1.5 Unit Considered
1.6 Stakeholders
2 Research Methodology (Page No. - 19)
2.1 Research Data
2.1.1 Secondary Data
2.1.1.1 Key Data From Secondary Sources
2.1.2 Primary Data
2.1.2.1 Key Data From Primary Sources
2.1.2.2 Key Industry Insights
2.1.2.3 Breakdown of Primary Interviews
2.2 Market Size Estimation
2.2.1 Bottom-Up Approach
2.2.2 Top-Down Approach
2.3 Data Triangulation
2.4 Assumptions
2.5 Limitations
3 Executive Summary (Page No. - 27)
4 Premium Insights (Page No. - 31)
4.1 Attractive Growth Opportunities for Players in Ceramic Adhesives Market
4.2 Ceramic Adhesives Market Size, By Chemistry Type
4.3 Ceramic Adhesives Market Size, Developed vs. Developing Countries
4.4 Ceramic Adhesives Market, By Application and Key Country
4.5 APAC: Ceramic Adhesives Market
4.6 Ceramic Adhesives Market Attractiveness
5 Market Overview (Page No. - 35)
5.1 Introduction
5.1.1 Basic Functions of Ceramic Adhesives
5.1.2 Importance of Ceramic Adhesives
5.1.3 Advantages of Ceramic Adhesives
5.1.4 Disadvantages of Ceramic Adhesives
5.1.5 Comparison of Different Tile Adhesive Chemistries
5.2 Market Dynamics
5.2.1 Drivers
5.2.1.1 Increased Demand for Ceramic Adhesives in Residential Housing
5.2.1.2 Rising Demand From Developing Countries
5.2.2 Restraints
5.2.2.1 Stringent Environmental Regulations in North America and Europe
5.2.3 Opportunities
5.2.3.1 Growing Demand for Low Voc, Green, and Sustainable Ceramic Adhesives
5.2.3.2 Economic Growth and Rising Government Expenditure on Infrastructure Development in Emerging Countries
5.2.4 Challenges
5.2.4.1 Established Infrastructure in Developed Countries
5.2.4.2 Change in Regulations and Standards
5.2.4.3 Volatility in Raw Material Prices
5.3 Porter�s Five Forces Analysis
5.3.1 Threat of Substitutes
5.3.2 Bargaining Power of Buyers
5.3.3 Threat of New Entrants
5.3.4 Bargaining Power of Suppliers
5.3.5 Intensity of Competitive Rivalry
5.4 Macroeconomic Indicators
5.4.1 Trends and Forecast of Gdp
5.4.2 Trends and Forecast of Construction Industry
5.4.2.1 North America
5.4.2.2 Europe
5.4.2.3 APAC
5.4.2.4 Middle East & Africa
5.4.2.5 Central & South America
6 Ceramic Adhesives Market, By Chemistry Type (Page No. - 47)
6.1 Introduction
6.2 Cement-Based
6.3 Epoxy
6.4 Acrylic
6.5 Silicone
6.5.1 One-Component
6.5.2 Two-Component
6.6 Cyanoacrylate
6.7 Others
7 Ceramic Adhesives Market, By Application (Page No. - 58)
7.1 Introduction
7.2 Building & Construction
7.2.1 Residential
7.2.2 Commercial
7.2.3 Institutional
7.3 Dental
7.4 Others
8 Ceramic Adhesives Market, By Region (Page No. - 66)
8.1 Introduction
8.2 APAC
8.2.1 China
8.2.2 Japan
8.2.3 India
8.2.4 Indonesia
8.2.5 South Korea
8.2.6 Malaysia
8.2.7 Thailand
8.2.8 Rest of APAC
8.3 Europe
8.3.1 Germany
8.3.2 UK
8.3.3 France
8.3.4 Italy
8.3.5 Russia
8.3.6 Spain
8.3.7 Turkey
8.3.8 Rest of Europe
8.4 North America
8.4.1 US
8.4.2 Canada
8.4.3 Mexico
8.5 Middle East & Africa
8.5.1 Saudi Arabia
8.5.2 UAE
8.5.3 South Africa
8.5.4 Rest of Middle East & Africa
8.6 Central & South America
8.6.1 Brazil
8.6.2 Argentina
8.6.3 Colombia
8.6.4 Rest of Central & South America
9 Competitive Landscape (Page No. - 116)
9.1 Introduction
9.2 Market Ranking of Key Players
9.3 Competitive Scenario
9.3.1 Acquisitions
9.3.2 Investments & Expansions
9.3.3 New Product Launches
10 Company Profiles (Page No. - 120)
10.1 3M
10.2 Bostik
10.3 Sika
10.4 Henkel
10.5 H.B. Fuller Construction Products
10.6 BASF SE
10.7 MAPEI S.P.A
10.8 Ardex
10.9 Laticrete International
10.10 Terraco
10.11 Saint-Gobain Weber
10.12 Fosroc
10.13 Other Players
10.13.1 Custom Building Products
10.13.2 Construction Chemicals Pty
10.13.3 Dap Products
10.13.4 Flextile
10.13.5 Norcros Adhesives
10.13.6 Dural Industries
11 Appendix (Page No. - 144)
11.1 Insights From Industry Experts
11.2 Discussion Guide
11.3 Knowledge Store: Marketsandmarkets Subscription Portal
11.4 Introducing RT: Real-Time Market Intelligence
11.5 Available Customizations
11.6 Related Reports
11.7 Author Details
List of Tables (122 Tables)
Table 1 Ceramic Adhesives Market Snapshot (2017 vs. 2022)
Table 2 Comparison of Cement, Dispersion, and Resin-Based Tile Adhesives
Table 3 Types of Ceramic Adhesives: Uses and Advantages
Table 4 Trends and Forecast of Gdp, Annual Percentage Change
Table 5 Trends and Forecast of Gdp, 2015�2022 (USD Billion)
Table 6 Contribution of Construction Industry to Gdp of North America, 2014�2021 (USD Billion)
Table 7 Contribution of Construction Industry to Gdp of Europe, 2014�2021 (USD Billion)
Table 8 Contribution of Construction Industry to Gdp of APAC, 2014�2021 (USD Billion)
Table 9 Contribution of Construction Industry to Gdp of Middle East & Africa, 2014�2021 (USD Billion)
Table 10 Contribution of Construction Industry to Gdp of Central & South America, 2014�2021 (USD Billion)
Table 11 Market Size, By Chemistry Type, 2015�2022 (Kiloton)
Table 12 Market Size, By Chemistry Type, 2015�2022 (USD Million)
Table 13 Cement-Based Market Size, By Region, 2015�2022 (Kiloton)
Table 14 Cement-Based Market Size, By Region, 2015�2022 (USD Million)
Table 15 Epoxy Market Size, By Region, 2015�2022 (Kiloton)
Table 16 Epoxy Market Size, By Region, 2015�2022 (USD Million)
Table 17 Acrylic Market Size, By Region, 2015�2022 (Kiloton)
Table 18 Acrylic Market Size, By Region, 2015�2022 (USD Million)
Table 19 Silicone Market Size, By Region, 2015�2022 (Kiloton)
Table 20 Silicone Market Size, By Region, 2015�2022 (USD Million)
Table 21 Cyanoacrylate Market Size, By Region, 2015�2022 (Kiloton)
Table 22 Cyanoacrylate Market Size, By Region, 2015�2022 (USD Million)
Table 23 Other Market Size, By Region, 2015�2022 (Kiloton)
Table 24 Other Market Size, By Region, 2015�2022 (USD Million)
Table 25 Market Size, By Application, 2015�2022 (Kiloton)
Table 26 Market Size, By Application, 2015�2022 (USD Million)
Table 27 Market Size in Building & Construction, By Region, 2015-2022 (Kiloton)
Table 28 Market Size in Building & Construction, By Region, 2015-2022 (USD Million)
Table 29 Market Size in Dental, By Region, 2015-2022 (Kiloton)
Table 30 Market Size in Dental, By Region, 2015-2022 (USD Million)
Table 31 Market Size in Other Applications, By Region, 2015�2022 (Kiloton)
Table 32 Market Size in Other Applications, By Region, 2015�2022 (USD Million)
Table 33 Market Size, By Region, 2015�2022 (Kiloton)
Table 34 Market Size, By Region, 2015�2022 (USD Million)
Table 35 APAC: Market Size, By Country, 2015�2022 (Kiloton)
Table 36 APAC: Market Size, By Country, 2015�2022 (USD Million)
Table 37 APAC: Market Size, By Chemistry Type, 2015�2022 (Kiloton)
Table 38 APAC: Market Size, By Chemistry Type, 2015�2022 (USD Million)
Table 39 APAC: Market Size, By Application, 2015�2022 (Kiloton)
Table 40 APAC: Market Size, By Application, 2015�2022 (USD Million)
Table 41 China: Market Size, By Application, 2015�2022 (Kiloton)
Table 42 China: Market Size, By Application, 2015�2022 (USD Million)
Table 43 Japan: Market Size, By Application, 2015�2022 (Kiloton)
Table 44 Japan: Market Size, By Application, 2015�2022 (USD Million)
Table 45 India: Market Size, By Application, 2015�2022 (Kiloton)
Table 46 India: Market Size, By Application, 2015�2022 (USD Million)
Table 47 Indonesia: Market Size, By Application, 2015�2022 (Kiloton)
Table 48 Indonesia: Market Size, By Application, 2015�2022 (USD Million)
Table 49 South Korea: Market Size, By Application, 2015�2022 (Kiloton)
Table 50 South Korea: Market Size, By Application, 2015�2022 (USD Million)
Table 51 Malaysia: Market Size, By Application, 2015�2022 (Kiloton)
Table 52 Malaysia: Market Size, By Application, 2015�2022 (USD Million)
Table 53 Thailand: Market Size, By Application, 2015�2022 (Kiloton)
Table 54 Thailand: Market Size, By Application, 2015�2022 (USD Million)
Table 55 Rest of APAC: Market Size, By Application, 2015�2022 (Kiloton)
Table 56 Rest of APAC: Market Size, By Application, 2015�2022 (USD Million)
Table 57 Europe: Market Size, By Country, 2015�2022 (Kiloton)
Table 58 Europe: Market Size, By Country, 2015�2022 (USD Million)
Table 59 Europe: Market Size, By Chemistry Type, 2015�2022 (Kiloton)
Table 60 Europe: Market Size, By Chemistry Type, 2015�2022 (USD Million)
Table 61 Europe: Market Size, By Application, 2015�2022 (Kiloton)
Table 62 Europe: Market Size, By Application, 2015�2022 (USD Million)
Table 63 Germany: Market Size, By Application, 2015�2022 (Kiloton)
Table 64 Germany: Market Size, By Application, 2015�2022 (USD Million)
Table 65 UK: Market Size, By Application, 2015�2022 (Kiloton)
Table 66 UK: Market Size, By Application, 2015�2022 (USD Million)
Table 67 France: Market Size, By Application, 2015�2022 (Kiloton)
Table 68 France: Market Size, By Application, 2015�2022 (USD Million)
Table 69 Italy: Market Size, By Application, 2015�2022 (Kiloton)
Table 70 Italy: Market Size, By Application, 2015�2022 (USD Million)
Table 71 Russia: Market Size, By Application, 2015�2022 (Kiloton)
Table 72 Russia: Market Size, By Application, 2015�2022 (USD Million)
Table 73 Spain: Market Size, By Application, 2015�2022 (Kiloton)
Table 74 Spain: Market Size, By Application, 2015�2022 (USD Million)
Table 75 Turkey: Market Size, By Application, 2015�2022 (Kiloton)
Table 76 Turkey: Market Size, By Application, 2015�2022 (USD Million)
Table 77 Rest of Europe: Market Size, By Application, 2015�2022 (Kiloton)
Table 78 Rest of Europe: Market Size, By Application, 2015�2022 (USD Million)
Table 79 North America: Market Size, By Country, 2015�2022 (Kiloton)
Table 80 North America: Market Size, By Country, 2015�2022 (USD Million)
Table 81 North America: Market Size, By Chemistry Type, 2015�2022 (Kiloton)
Table 82 North America: Market Size, By Chemistry Type, 2015�2022 (USD Million)
Table 83 North America: Market Size, By Application, 2015�2022 (Kiloton)
Table 84 North America: Market Size, By Application, 2015�2022 (USD Million)
Table 85 US: Market Size, By Application, 2015�2022 (Kiloton)
Table 86 US: Market Size, By Application, 2015�2022 (USD Million)
Table 87 Canada: Market Size, By Application, 2015�2022 (Kiloton)
Table 88 Canada: Market Size, By Application, 2015�2022 (USD Million)
Table 89 Mexico: Market Size, By Application, 2015�2022 (Kiloton)
Table 90 Mexico: Market Size, By Application, 2015�2022 (USD Million)
Table 91 Middle East & Africa: Market Size, By Country, 2015�2022 (Kiloton)
Table 92 Middle East & Africa: Market Size, By Country, 2015�2022 (USD Million)
Table 93 Middle East & Africa: Market Size, By Chemistry Type, 2015�2022 (Kiloton)
Table 94 Middle East & Africa: Market Size, By Chemistry Type, 2015�2022 (USD Million)
Table 95 Middle East & Africa: Market Size, By Application, 2015�2022 (Kiloton)
Table 96 Middle East & Africa: Market Size, By Application, 2015�2022 (USD Million)
Table 97 Saudi Arabia: Market Size, By Application, 2015�2022 (Kiloton)
Table 98 Saudi Arabia: Market Size, By Application, 2015�2022 (USD Million)
Table 99 UAE: Market Size, By Application, 2015�2022 (Kiloton)
Table 100 UAE: Market Size, By Application, 2015�2022 (USD Million)
Table 101 South Africa: Market Size, By Application, 2015�2022 (Kiloton)
Table 102 South Africa: Market Size, By Application, 2015�2022 (USD Million)
Table 103 Rest of Middle East & Africa: Market Size, By Application, 2015�2022 (Kiloton)
Table 104 Rest of Middle East & Africa: Market Size, By Application, 2015�2022 (USD Million)
Table 105 Central & South America: Market Size, By Country, 2015�2022 (Kiloton)
Table 106 Central & South America: Market Size, By Country, 2015�2022 (USD Million)
Table 107 Central & South America: Market Size, By Chemistry Type, 2015�2022 (Kiloton)
Table 108 Central & South America: Market Size, By Chemistry Type, 2015�2022 (USD Million)
Table 109 Central & South America: Market Size, By Application, 2015�2022 (Kiloton)
Table 110 Central & South America: Market Size, By Application, 2015�2022 (USD Million)
Table 111 Brazil: Market Size, By Application, 2015�2022 (Kiloton)
Table 112 Brazil: Market Size, By Application, 2015�2022 (USD Million)
Table 113 Argentina: Market Size, By Application, 2015�2022 (Kiloton)
Table 114 Argentina: Market Size, By Application, 2015�2022 (USD Million)
Table 115 Colombia: Market Size, By Application, 2015�2022 (Kiloton)
Table 116 Colombia: Market Size, By Application, 2015�2022 (USD Million)
Table 117 Rest of Central & South America: Market Size, By Application, 2015�2022 (Kiloton)
Table 118 Rest of Central & South America: Market Size, By Application, 2015�2022 (USD Million)
Table 119 Market Ranking of Key Players (2016)
Table 120 Acquisitions, 2013 and 2017
Table 121 Investments & Expansions, 2013 and 2017
Table 122 New Product Launches, 2013 and 2017
List of Figures (38 Figures)
Figure 1 Ceramic Adhesives Market Segmentation
Figure 2 Ceramic Adhesives Market: Research Design
Figure 3 Market Size Estimation: Bottom-Up Approach
Figure 4 Market Size Estimation: Top-Down Approach
Figure 5 Ceramic Adhesives: Data Triangulation
Figure 6 Cement-Based Ceramic Adhesives to Be THE Largest Chemistry Type
Figure 7 Building & Construction to Be THE Fastest-Growing Application
Figure 8 APAC to Be THE Largest and Fastest-Growing Market for Ceramic Adhesives
Figure 9 Emerging Economies to Offer Lucrative Growth Opportunities for Market Players Between 2017 and 2022
Figure 10 Cement-Based Ceramic Adhesives to Register THE Highest Cagr
Figure 11 The Ceramic Adhesives Market to Register A Higher Cagr in Developing Countries
Figure 12 Building & Construction to Account for THE Largest Share in 2017
Figure 13 Southeast Asian Countries to Register High Growth
Figure 14 India to Register THE Highest Cagr in 2017
Figure 15 Drivers, Restraints, Opportunities, and Challenges of THE Ceramic Adhesives Market
Figure 16 Cement-Based Chemistry to Lead THE Ceramic Adhesives Market Between 2017 and 2022
Figure 17 APAC to Account for THE Largest Share of THE Cement-Based Ceramic Adhesives Market in 2017
Figure 18 Building & Construction Accounted for A Major Share of THE Ceramic Adhesives Market in 2016
Figure 19 Building & Construction Segment to Account for THE Largest Share of THE Ceramic Adhesives Market
Figure 20 India: an Emerging Market for Ceramic Adhesives
Figure 21 APAC Emerging as High-Growth Potential Markets for Cement-Based and Epoxy Ceramic Adhesives
Figure 22 APAC to Lead THE Ceramic Adhesives Market in All THE Major Applications
Figure 23 APAC: Ceramic Adhesives Market Snapshot
Figure 24 Building & Construction to Drive THE Ceramic Adhesives MarketIn Europe
Figure 25 Turkey to Be THE Fastest-Growing European Ceramic Adhesives Market
Figure 26 North America: Ceramic Adhesives Market Snapshot
Figure 27 Middle East & Africa: Ceramic Adhesives Market Snapshot
Figure 28 Building & Construction Application to Drive THE Ceramic Adhesives Market in Central & South America
Figure 29 Companies Adopted Acquisitions as THE Key Growth Strategy Between 2013 and 2017
Figure 30 3M: Company Snapshot
Figure 31 Sika: Company Snapshot
Figure 32 Sika: Swot Analysis
Figure 33 Henkel: Company Snapshot
Figure 34 Henkel: Swot Analysis
Figure 35 H.B. Fuller Construction Products Inc.: Swot Analysis
Figure 36 BASF SE: Company Snapshot
Figure 37 MAPEI Spa: Company Snapshot
Figure 38 Saint-Gobain Weber: Company Snapshot


Growth opportunities and latent adjacency in Ceramic Adhesives Market