Proactive Services Market by Service, Application (Network Management, Data Center Management, Cloud Management, Application Management, Device/Endpoint Management), Technology Type, Organization Size, Vertical, and Region - Global Forecast to 2022


[175 Pages Report] MarketsandMarkets expects the proactive services market to grow from $1.47 Billion in 2016 to $4.35 Billion by 2022 at a Compound Annual Growth Rate (CAGR) of 21.6% during the forecast period. The forecast period has been considered from 2017 to 2022, while 2016 is considered as the base year for estimating the market study.
Objectives of the Study:
The main objective of this report is to define, describe, and forecast the proactive services market on the basis of segments including application, technology type, service, organization size, vertical, and region. The report provides detailed information regarding major factors (drivers, restraints, opportunities, and industry-specific challenges) influencing the growth of the market. The report forecasts the market size with respect to 5 main geographic regions, namely, North America, Europe, Asia Pacific (APAC), Middle East and Africa (MEA), and Latin America. The report profiles key players and comprehensively analyzes their core competencies. This report also tracks and analyzes competitive developments, such as mergers and acquisitions, new product developments, and Research and Development (R&D) activities in the market.
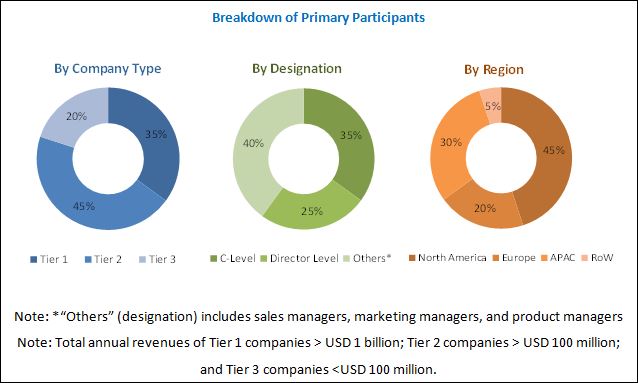
The research methodology used to estimate and forecast the proactive services market begins with the collection and analysis of data on key vendor product offerings and business strategies from secondary sources, such as OneSource Business Browser, D&B Hoovers, 10K Wizard, Bloomberg, Thomson StreetEvents, Factiva, IT service providers, technology providers, press releases and investor presentations of companies, white papers, technology journals, certified publications, articles from recognized authors, directories, and databases. The vendor offerings have also been taken into consideration to determine the market segmentation. The bottom-up procedure was employed to arrive at the total market size of the proactive services market from the revenue of the key market software tool providers and service providers. After arriving at the overall market size, the total market was split into several segments and subsegments, which were then verified through primary research by conducting extensive interviews with key people, such as Chief Executive Officers (CEOs), Vice Presidents (VPs), directors, and executives.
To know about the assumptions considered for the study, download the pdf brochure
Industry Ecosystem
The proactive services ecosystem comprises vendors, such as Cisco (US), Hewlett Packard Enterprise (US), Microsoft (US), IBM (US), Ericsson (Sweden), Juniper Networks (US), Huawei (China), Nokia Networks (Finland), Avaya (US), Fortinet (US), Symantec (US), DXC Technology (US), and McAfee (US).
Key Target Audience for Proactive Services Market
- Proactive services providers
- Managed service players
- Support service providers
- Value-added resellers
Get online access to the report on the World's First Market Intelligence Cloud
Request Sample Scope of the Report

The research report categorizes the proactive services market to forecast the revenues and analyze the trends in each of the following submarkets:
Market By Service
- Managed Services
- Technical Support
- Design and Consulting
Market By Application
- Network Management
- Customer Experience Management
- Data Center Management
- Cloud Management
- Application Management
- Device / Endpoint Management
Proactive Services Market By Technology Type
- Big Data Analytics
- Business Intelligence
- Machine Intelligence
Market By Organization Size
- Small and Medium-sized Enterprises (SMEs)
- Large enterprises
Proactive Services Market By Vertical
- Banking, Financial Services, and Insurance (BFSI)
- Telecommunication
- Retail
- Healthcare
- Government and Defense
- Media and Entertainment
- Others (Education and Transportation & Logistics))
Market By Region
- North America
- Europe
- MEA
- APAC
- Latin America
Available Customizations
With the given market data, MarketsandMarkets offers customizations as per the company�s specific needs. The following customization options are available for the report:
Product Analysis
- Product matrix that gives a detailed comparison of the product portfolio of each company
Geographic Analysis
- Further breakdown of the North American proactive services market into countries
- Further breakdown of the European market into countries
- Further breakdown of the APAC market into countries
- Further breakdown of the MEA market into countries
- Further breakdown of the Latin American market into countries
Company Information
- Detailed analysis and profiling of additional market players
The global proactive services market is expected to grow from USD 1.63 Billion in 2017 to USD 4.35 Billion by 2022, at a Compound Annual Growth Rate (CAGR) of 21.6% during the forecast period. Several factors such as the growing need to reduce unplanned outage and to enhance customer value proposition, and growing instances of cyber-attacks are spurring the demand for proactive services. Moreover, an increased adoption of proactive services by several industry verticals, such as telecommunications, retail, BFSI, and healthcare, is expected to boost the market growth.
In today�s changing business requirements, customers are looking for innovative solutions and services to manage their IT infrastructure and prevent it from downtime and any unplanned outages. Any unplanned outages in a large IT infrastructure of an organization will lead to a significant loss. Industry participants make use of Artificial Intelligence (AI) and analytics solutions to offer proactive support to assist organizations in identifying and resolving issues before they occur.
For most organizations, IT is a significant pillar that requires cost-effective implementation of security service dynamics. However, at the same time, IT is the backbone of a modern organization�s processes and the data flowing within it is highly important, further making it difficult to ignore the IT infrastructure. Maintaining an IT infrastructure, which is secured from physical as well as virtual threat, is highly expensive. Cybersecurity vendors are offering services to identify and proactively prevent cyber-attacks.
The proactive services market research report outlines the key trends, and market sizing and forecasting for various emerging subsegments of the market. The report also emphasizes on key global adoption trends, future growth potential submarkets, key drivers, competitive outlook, restraints, and opportunities of the proactive service market ecosystem. It also provides insights into the current and future revenues of market from 2017 to 2022 and is aimed to provide the reader with an understanding of market drivers, current and upcoming players, and the competitive landscape.
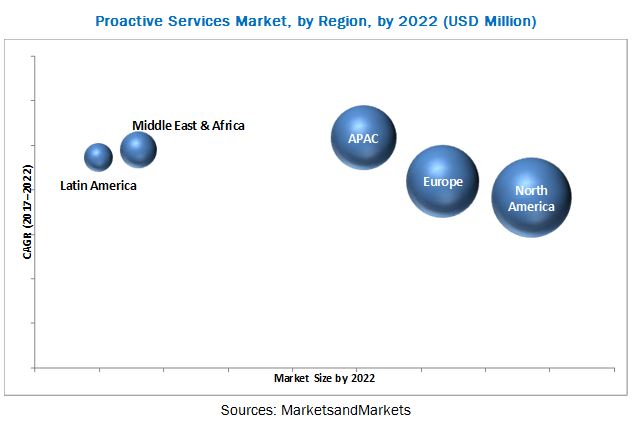
The global proactive services market has been segmented by 5 major geographic regions: North America, Europe, Asia Pacific (APAC), Middle East and Africa (MEA), and Latin America to provide region-specific analyses in the report. North America is estimated to have the largest market share and is projected to continue to dominate the market during the forecast period. The adoption of proactive services is increasing in APAC and MEA, due to the rising IT spending and increasing digitalization.
Growing use of mobile devices and the popularity of the Bring-Your-Own-Device (BYOD) concept in various companies are the main factors responsible for cyber-attacks and security concerns. Proactive services provide many benefits, however organizations feel that deploying proactive services would result in the loss of control over their own IT infrastructure and hamper their privacy.
Major vendors of proactive services across the globe are Cisco (US), Hewlett Packard Enterprise (US), Microsoft (US), IBM (US), Ericsson (Sweden), Juniper Networks (US), Huawei (China), Nokia Networks (Finland), Avaya (US), Fortinet (US), Symantec (US), DXC Technology (US), and McAfee (US). These vendors have adopted various organic and inorganic growth strategies, such as new product launches, partnerships and collaborations, and mergers and acquisitions, to further strengthen their position in the proactive services market.
To speak to our analyst for a discussion on the above findings, click Speak to Analyst
Table of Contents
1 Introduction (Page No. - 18)
1.1 Objectives of the Study
1.2 Market Definition
1.3 Market Scope
1.4 Years Considered for the Study
1.5 Currency
1.6 Stakeholders
2 Research Methodology (Page No. - 22)
2.1 Research Data
2.1.1 Secondary Data
2.1.2 Primary Data
2.1.2.1 Breakdown of Primaries
2.1.2.2 Key Industry Insights
2.2 Proactive Services Market Size Estimation
2.3 Research Assumptions and Limitations
2.3.1 Research Assumptions
2.3.2 Limitations
3 Executive Summary (Page No. - 29)
4 Premium Insights (Page No. - 33)
4.1 Attractive Market Opportunities in the Proactive Services Market
4.2 Market, By Vertical and Region
4.3 Market, By Organization Size
4.4 Market, By Service
4.5 Market, By Application
4.6 Market, By Technology Type
4.7 Market Potential
4.8 Life Cycle Analysis, By Region, 2017
4.9 Use Cases
5 Proactive Services Market Overview and Industry Trends (Page No. - 42)
5.1 Introduction
5.2 Innovation Spotlight
5.3 Market Dynamics
5.3.1 Drivers
5.3.1.1 High Costs Incurred By Unplanned Outages
5.3.1.2 The Increasing Focus on Delivering Enhanced Customer Experience
5.3.1.3 The Growing Number of Cyber Threats
5.3.2 Restraints
5.3.2.1 Concerns Over Privacy and Security
5.3.3 Opportunities
5.3.3.1 Ai-Based Proactive Services
5.3.3.2 Partnerships and Affective Ecosystems
5.3.4 Challenges
5.3.4.1 Managing Security With Multiple Customer Touchpoints
5.3.4.2 Implementation Efforts/Costs
5.3.4.3 Lack of Qualified Talent
6 Market, By Application (Page No. - 47)
6.1 Introduction
6.2 Network Management
6.3 Data Center Management
6.4 Cloud Management
6.5 Application Management
6.6 Device/Endpoint Management
6.7 Customer Experience Management
7 Market, By Service (Page No. - 54)
7.1 Introduction
7.2 Managed Services
7.3 Technical Support
7.4 Design and Consulting
8 Proactive Services Market, By Technology Type (Page No. - 59)
8.1 Introduction
8.2 Big Data Analytics
8.3 Business Intelligence
8.4 Machine Intelligence
9 Market, By Organization Size (Page No. - 64)
9.1 Introduction
9.2 Large Enterprises
9.3 Small and Medium-Sized Enterprises
10 Proactive Services Market, By Vertical (Page No. - 69)
10.1 Introduction
10.2 Banking, Financial Services, and Insurance
10.3 Government and Defense
10.4 Healthcare
10.5 Telecommunication
10.6 Media and Entertainment
10.7 Retail
10.8 Others
11 Proactive Services Market, By Region (Page No. - 77)
11.1 Introduction
11.2 North America
11.3 Europe
11.4 Asia Pacific
11.5 Middle East and Africa
11.6 Latin America
12 Competitive Landscape (Page No. - 102)
12.1 Overview
12.2 Market Ranking Analysis
12.3 Competitive Scenario
12.3.1 New Product Launches/New Solution Launches/New Service Launches
12.3.2 Business Expansions/Service Expansions/Portfolio Expansions
12.3.3 Mergers, Demergers, and Acquisitions
12.3.4 Agreements/Partnerships
13 Company Profiles (Page No. - 111)
13.1 Cisco
13.1.1 Business Overview
13.1.2 Services Offered
13.1.3 Recent Developments
13.1.4 SWOT Analysis
13.1.5 MnM View
13.1.6 Partner Network
13.2 HPE
13.2.1 Business Overview
13.2.2 Services Offered
13.2.3 Recent Developments
13.2.4 SWOT Analysis
13.2.5 MnM View
13.2.6 Partner Network
13.3 Microsoft
13.3.1 Business Overview
13.3.2 Services Offered
13.3.3 Recent Developments
13.3.4 SWOT Analysis
13.3.5 MnM View
13.3.6 Partner Network
13.4 IBM
13.4.1 Business Overview
13.4.2 Services Offered
13.4.3 Recent Developments
13.4.4 SWOT Analysis
13.4.5 MnM View
13.4.6 Partner Network
13.5 Ericsson
13.5.1 Business Overview
13.5.2 Services Offered
13.5.3 Recent Developments
13.5.4 SWOT Analysis
13.5.5 MnM View
13.5.6 Partner Network
13.6 Juniper
13.6.1 Business Overview
13.6.2 Services Offered
13.6.3 Recent Developments
13.6.4 MnM View
13.6.5 Partner Network
13.7 Huawei
13.7.1 Overview
13.7.2 Services Offered
13.7.3 Recent Developments
13.7.4 MnM View
13.7.5 Partner Network
13.8 Nokia Networks
13.8.1 Business Overview
13.8.2 Services Offered
13.8.3 Recent Developments
13.8.4 MnM View
13.9 Avaya
13.9.1 Overview
13.9.2 Services Offered
13.9.3 Recent Developments
13.9.4 MnM View
13.9.5 Partner Network
13.10 Fortinet
13.10.1 Business Overview
13.10.2 Services Offered
13.10.3 Recent Developments
13.10.4 MnM View
13.10.5 Partner Network
13.11 Symantec
13.11.1 Business Overview
13.11.2 Services Offered
13.11.3 Recent Developments
13.11.4 MnM View
13.11.5 Partner Network
13.12 Mcafee
13.12.1 Overview
13.12.2 Services Offered
13.12.3 Recent Developments
13.12.4 MnM View
13.12.5 Partner Network
13.13 DXC Technology
13.13.1 Overview
13.13.2 Services Offered
13.13.3 Recent Developments
13.13.4 MnM View
13.13.5 Partner Network
13.14 Servion
13.14.1 Overview
13.14.2 Services Offered
13.14.3 Recent Developments
13.14.4 MnM View
13.14.5 Partner Network
14 Appendix (Page No. - 165)
14.1 Key Industry Insights
14.2 Discussion Guide
14.3 Knowledge Store: Marketsandmarkets� Subscription Portal
14.4 Introducing RT: Real Time Market Intelligence
14.5 Available Customizations
14.6 Related Reports
14.7 Author Details
List of Tables (60 Tables)
Table 1 United States Dollar Exchange Rate, 2014�2016
Table 2 Proactive Services Market Size and Growth Rate, 2015�2022 (USD Billion, Y-O-Y %)
Table 3 Market Size, By Application, 2015�2022 (USD Million)
Table 4 Network Management: Market Size, By Region, 2015�2022 (USD Million)
Table 5 Data Center Management: Market Size, By Region, 2015�2022 (USD Million)
Table 6 Cloud Management: Market Size, By Region, 2015�2022 (USD Million)
Table 7 Application Management: Market Size, By Region, 2015�2022 (USD Million)
Table 8 Device/Endpoint Management: Market Size, By Region, 2015�2022 (USD Million)
Table 9 Customer Experience Management: Market Size, By Region, 2015�2022 (USD Million)
Table 10 Services: Proactive Services Market Size, By Type, 2015�2022 (USD Million)
Table 11 Managed Services: Market Size, By Region, 2015�2022 (USD Million)
Table 12 Technical Support: Market Size, By Region, 2015�2022 (USD Million)
Table 13 Design and Consulting: Market Size, By Region, 2015�2022 (USD Million)
Table 14 Market Size, By Technology Type, 2015�2022 (USD Million)
Table 15 Big Data Analytics: Market Size, By Region 2015�2022 (USD Million)
Table 16 Business Intelligence: Market Size, By Region, 2015�2022 (USD Million)
Table 17 Machine Intelligence: Market Size, By Region, 2015�2022 (USD Million)
Table 18 Proactive Services Market Size, By Organization Size, 2015�2022 (USD Million)
Table 19 Large Enterprises: Market Size, By Region, 2015�2022 (USD Million)
Table 20 Small and Medium-Sized Enterprises: Market Size, By Region, 2015�2022 (USD Million)
Table 21 Market Size, By Vertical, 2015�2022 (USD Million)
Table 22 Banking, Financial Services, and Insurance: Market Size, By Region, 2015�2022 (USD Million)
Table 23 Government and Defense: Market Size, By Region, 2015�2022 (USD Million)
Table 24 Healthcare: Proactive Services Market Size, By Region, 2015�2022 (USD Million)
Table 25 Telecommunication: Market Size, By Region, 2015�2022 (USD Million)
Table 26 Media and Entertainment: Market Size, By Region, 2015�2022 (USD Million)
Table 27 Retail: Market Size, By Region, 2015�2022 (USD Million)
Table 28 Others: Market Size, By Region, 2015�2022 (USD Million)
Table 29 Market Size, By Region, 2015�2022 (USD Million)
Table 30 North America: Market Size, By Country, 2015�2022 (USD Million)
Table 31 North America: Market Size, By Application, 2015�2022 (USD Million)
Table 32 North America: Market Size, By Service, 2015�2022 (USD Million)
Table 33 North America: Market Size, By Technology Type, 2015�2022 (USD Million)
Table 34 North America: Market Size, By Organization Size, 2015�2022 (USD Million)
Table 35 North America: Market Size, By Vertical, 2015�2022 (USD Million)
Table 36 Europe: Proactive Services Market Size, By Country, 2015�2022 (USD Million)
Table 37 Europe: Market Size, By Application, 2015�2022 (USD Million)
Table 38 Europe: Market Size, By Service, 2015�2022 (USD Million)
Table 39 Europe: Market Size, By Technology Type, 2015�2022 (USD Million)
Table 40 Europe: Market Size, By Organization Size, 2015�2022 (USD Million)
Table 41 Europe: Market Size, By Vertical, 2015�2022 (USD Million)
Table 42 Asia Pacific: Market Size, By Country, 2015�2022 (USD Million)
Table 43 Asia Pacific: Market Size, By Application, 2015�2022 (USD Million)
Table 44 Asia Pacific: Market Size, By Service, 2015�2022 (USD Million)
Table 45 Asia Pacific: Market Size, By Technology Type, 2015�2022 (USD Million)
Table 46 Asia Pacific: Market Size, By Organization Size, 2015�2022 (USD Million)
Table 47 Asia Pacific: Market Size, By Vertical, 2015�2022 (USD Million)
Table 48 Middle East and Africa: Proactive Services Market Size, By Country, 2015�2022 (USD Million)
Table 49 Middle East and Africa: Market Size, By Application, 2015�2022 (USD Million)
Table 50 Middle East and Africa: Market Size, By Service, 2015�2022 (USD Million)
Table 51 Middle East and Africa: Market Size, By Technology Type, 2015�2022 (USD Million)
Table 52 Middle East and Africa: Market Size, By Organization Size, 2015�2022 (USD Million)
Table 53 Middle East and Africa: Market Size, By Vertical, 2015�2022 (USD Million)
Table 54 Latin America: Market Size, By Country, 2015�2022 (USD Million)
Table 55 Latin America: Market Size, By Application, 2015�2022 (USD Million)
Table 56 Latin America: Market Size, By Service, 2015�2022 (USD Million)
Table 57 Latin America: Market Size, By Technology Type, 2015�2022 (USD Million)
Table 58 Latin America: Market Size, By Organization Size, 2015�2022 (USD Million)
Table 59 Latin America: Market Size, By Vertical, 2015�2022 (USD Million)
Table 60 Market Ranking for the Proactive Services Market
List of Figures (50 Figures)
Figure 1 Proactive Services Market: Market Segmentation
Figure 2 Regional Scope
Figure 3 Market: Research Design
Figure 4 Data Triangulation
Figure 5 Market Size Estimation Methodology: Bottom-Up Approach
Figure 6 Market Size Estimation Methodology: Top-Down Approach
Figure 7 Proactive Services Market: Assumptions
Figure 8 Top 3 Segments for the Market in 2017
Figure 9 North America is Estimated to Have the Largest Market Share in 2017
Figure 10 The Technical Support Segment is Expected to Offer Attractive Opportunities for the Growth of the Proactive Services Market During the Forecast Period
Figure 11 Telecommunication Vertical and North America are Estimated to Have the Largest Market Shares in 2017
Figure 12 Small and Medium-Sized Enterprises Segment is Expected to Grow at A Higher CAGR During the Forecast Period
Figure 13 Managed Services Segment is Expected to Grow at the Highest CAGR During the Forecast Period
Figure 14 Device/Endpoint Management Application is Expected to Grow at the Highest CAGR During the Forecast Period
Figure 15 Machine Intelligence Segment is Expected to Grow at the Highest CAGR During the Forecast Period
Figure 16 Asia Pacific is Expected to Grow at the Highest CAGR During the Forecast Period
Figure 17 Asia Pacific, and Middle East and Africa are Expected to Be the Faster Growing Regions in the Proactive Services Market
Figure 18 Key Use Cases, By Vertical
Figure 19 Use Case 1: Network Optimization in Telecom
Figure 20 Use Case 2: Data Center Management in Retail
Figure 21 Use Case 3: Cybersecurity in Banking, Financial Services, and Insurance
Figure 22 Proactive Services Market: Drivers, Restraints, Opportunities, and Challenges
Figure 23 Device/Endpoint Management Segment is Expected to Grow at A Higher CAGR During the Forecast Period
Figure 24 Managed Services Segment is Expected to Grow at the Highest CAGR During the Forecast Period
Figure 25 Machine Intelligence Segment is Expected to Grow at the Highest CAGR During the Forecast Period
Figure 26 Small and Medium-Sized Enterprises Segment is Expected to Grow at A Higher CAGR During the Forecast Period
Figure 27 Banking, Financial Services, and Insurance Vertical is Expected to Grow at A Higher CAGR During the Forecast Period
Figure 28 Geographical Analysis
Figure 29 Asia Pacific Region is Expected to Grow at the Highest CAGR During the Forecast Period
Figure 30 North America Market Snapshot: United States is Expected to Contribute the Maximum to the Market Share
Figure 31 Asia Pacific Market Snapshot
Figure 32 Key Developments By Leading Players in the Proactive Services Market During 2014�2017
Figure 33 Cisco: Company Snapshot
Figure 34 Cisco: SWOT Analysis
Figure 35 HPE: Company Snapshot
Figure 36 HPE: SWOT Analysis
Figure 37 Microsoft: Company Snapshot
Figure 38 Microsoft: SWOT Analysis
Figure 39 IBM: Company Snapshot
Figure 40 IBM: SWOT Analysis
Figure 41 Ericsson: Company Snapshot
Figure 42 Ericsson: SWOT Analysis
Figure 43 Juniper: Company Snapshot
Figure 44 Huawei: Company Snapshot
Figure 45 Nokia Nteworks: Company Snapshot
Figure 46 Avaya: Company Snapshot
Figure 47 Fortinet: Company Snapshot
Figure 48 Symantec: Company Snapshot
Figure 49 Mcafee: Company Snapshot
Figure 50 DXC Technology: Company Snapshot


Growth opportunities and latent adjacency in Proactive Services Market