
Filling Equipment Market by Industry (Food, Beverage, Pharmaceutical, Cosmetics), Type (Rotary, Volumetric, Aseptic, Net Weight), Process (Manual, Semi-Automatic, Automatic), Product (Solid, Semi-Solid, Liquid) & Geography - Global Trend & Forecast to 2019
Market Segmentation
| Report Metrics | Details |
|
Market size available for years |
null - null |
|
CAGR % |
null |
Top 10 companies in Filling Equipment Market
Filling Equipment Market News


Filling equipment is used extensive applications in food, beverages, pharmaceuticals, and cosmetics industries. The production efficiency of packaging lines for manufacturing companies is determined by the accuracy and precision of the equipment. They are classified as rotary fillers, volumetric fillers, aseptic fillers, and net weight fillers depending on the technology on which they work .They are used in industries such as food, beverage, pharmaceutical, cosmetic and other industrial applications such as filling of chemical, petrochemicals, and fuels. The filling equipment market is driven by the new filling technology development, increasing demand for the food packaging and changing consumer lifestyle.
The report provides detailed analysis of the filling equipment market based on the technology they work on. The global market is further analyzed based on the process types such as manual, semiautomatic, and automatic. The market for filling equipment was segmented as solid, semisolid, and liquid based on the types of products. Market size for filling equipment is also analyzed based on the geographic regions that include as analysis of North America, Europe, Asia-Pacific, Latin America, and Rest of the World (RoW). The market is further segmented on the basis of the key countries in the region.
Filling Equipment Market Size, by Geography, 2013 ($Million)
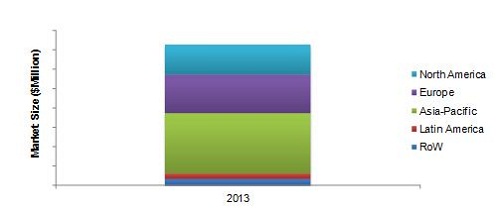
Source: MarketsandMarkets Analysis
Asia-Pacific was the largest market for filling equipment in 2013. The global market is projected to reach above $8 billion by 2019. The key industry players prefer new product launch as a strategy to develop new equipment for their consumers.
The report provides qualitative analysis of the leading players in the market. It also enumerates the development strategies preferred by the leading market players. The market dynamics in terms of market drivers, restraints, opportunities, and challenges are discussed in detail in the report. The key players such as Krones AG (Germany), Robert Bosch GmbH (Germany), Coesia S.p.A. (Italy), and Tetra Laval Group (Switzerland) have been profiled in this report.
Get online access to the report on the World's First Market Intelligence Cloud
Request Sample Scope of the Report

This report focuses on the filling equipment market which is segmented based on type and application.
On the basis of type
- Rotary fillers
- Volumetric fillers
- Aseptic fillers
- Net weight fillers
- Others (piston fillers, vacuum fillers spray fillers)
On the basis of process type
- Manual
- Semi-automatic
- Automatic
On the basis of product type
- Solid
- Semi-solid
- Liquid
On the basis of application
- Food
- Beverage
- Pharmaceutical
- Cosmetic
- Other industrial applications (chemicals, petrochemicals, and fuels)
On the basis of geography
- North America
- Europe
- Asia-Pacific
- Latin America
- RoW
Packaging of a product plays an essential role of preventing a product from environment, extending its shelf-life, and attracting the customers. Filling of any product in the package is also essential part of the packaging industry. This technology has evolved with the growing demand for creative packaging, depending on the types of various products. The filling equipment available in the market includes manual, semi-automatic, and automatic processes. The increasing demand for advanced packaging equipment is driving the filling equipment market.
Filling Equipment Market Size Trend, by Geography, 2012�2019 ($Million)
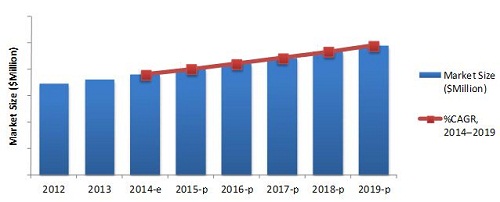
E � Estimated; P - Projected
Source: MarketsandMarkets Analysis
The filling equipment market is segmented as per the industry, type, process, and geography. The report includes the cross segmentation of filling equipment used in each industry and geography. The market is projected to be valued above $8 billion by 2019. The Asia-Pacific region was the largest geographic segment for the market in 2013.
The filling equipment market is a fragmented market with the leading companies driving the market growth with new product launches. The report further provides qualitative analysis of the prominent market players and their preferred development strategies. Key players such as Krones AG (Germany), Robert Bosch GmbH (Germany), and Coesia S.p.A. (Italy) have been profiled in the report. The leading players have adopted new product launches as their key development strategies.
Table of Contents
1 Introduction (Page No. - 20)
1.1 Objectives
1.2 Report Description
1.3 Markets Covered
1.4 Stakeholders
1.5 Research Methodology
1.5.1 Market Size Estimation
1.5.2 Market Breakdown & Data Triangulation
1.5.3 Assumptions Made for the Report
1.5.4 Key Data From Secondary Sources
1.5.4.1 Classification of Years Considered for the Filling Equipment Market
1.5.5 Key Data From Primary Sources
2 Executive Summary (Page No. - 32)
3 Premium Insights (Page No. - 35)
4 Industry Analysis (Page No. - 49)
4.1 Introduction
4.2 Packaging Industry
4.2.1 Packaging Machinery
4.2.1.1 Leading Players Adopt Technological Advancements & Collaboration Strategies
4.2.2 Packaging Services
4.3 Demand Side of Packaging Industry
4.3.1 F & B Industry
4.4 Supply Side of Packaging Industry
4.4.1 Packaging Manufacturers
4.4.1.1 Environment & Health Concerns Drive the Focus on Biodegradable Packaging
5 Market Overview (Page No. - 57)
5.1 Introduction
5.2 History & Evolution
5.3 Core Industry Analysis
5.3.1 Packaging Industry
5.3.2 Filling Equipment
5.4 Supply Chain Analysis
6 Market Analysis (Page No. - 63)
6.1 Introduction
6.2 Burning Issue
6.2.1 High Capital Investment
6.3 Winning Imperatives
6.3.1 New Filling Equipment Technology Development
6.3.2 Collaborative Agreements & Partnerships With Suppliers & Customers
6.4 Market Dynamics
6.4.1 Drivers
6.4.1.1 New Filling Technology Development
6.4.1.2 Smaller Pack Sizes & Changing Consumer Lifestyles
6.4.1.3 Automation and Robotics in Filling Equipment
6.4.2 Restraint
6.4.2.1 Increasing Cost of Power & Energy
6.4.3 Opportunities
6.4.3.1 Filling Equipment Services
6.4.3.2 Government Funds for Smes
6.5 Porter�s Five forces Analysis
6.5.1 Bargaining Power of Suppliers
6.5.2 Bargaining Power of Buyers
6.5.3 Threat From New Entrants
6.5.4 Threat From Substitutes
6.5.5 Degree of Competition
7 Filling Equipment Market, By Industry (Page No. - 75)
7.1 Introduction
7.2 Food & Beverage Industry
7.2.1 Food
7.2.2 Beverage
7.2.3 Food & Beverage Filling Equipment, By Geography 82
7.2.3.1 North America
7.2.3.2 Europe
7.2.3.3 Asia-Pacific
7.2.3.4 Latin America
7.2.3.5 ROW
7.2.4 Food & Beverage Filling Equipment, By Process 89
7.2.5 Food & Beverage Filling Equipment, By Type
7.2.6 Food & Beverage Filling Equipment, By Type & Process 98
7.2.7 Food & Beverage Filling Equipment, By Product 103
7.3 Pharmaceutical Industry
7.3.1 Pharmaceutical Filling Equipment, By Geography 109
7.3.1.1 North America
7.3.1.2 Europe
7.3.1.3 Asia-Pacific
7.3.1.4 Latin America
7.3.1.5 ROW
7.4 Cosmetic Industry
7.4.1 Cosmetic Filling Equipment, By Geography
7.4.1.1 North America
7.4.1.2 Europe
7.4.1.3 Asia-Pacific
7.4.1.4 Latin America
7.4.1.5 ROW
7.5 Other Industries
8 Filling Equipment Market, By Type (Page No. - 124)
8.1 Introduction
8.2 Rotary Fillers
8.3 Volumetric Fillers
8.4 Aseptic Fillers
8.5 Net Weight Fillers
8.6 Other Filling Equipment
9 Filling Equipment Market, By Process (Page No. - 137)
9.1 Introduction
9.2 Manual
9.3 Semi-Automatic
9.4 Automatic
10 Filling Equipment Market, By Product (Page No. - 146)
10.1 Introduction
10.2 Solid
10.3 Semi-Solid
10.4 Liquid
11 Filling Equipment Market, By Geography (Page No. - 453)
11.1 Introduction
11.2 North America
11.2.1 U.S.
11.2.2 Canada
11.2.3 Mexico
11.3 Europe
11.3.1 Germany
11.3.2 Italy
11.3.3 France
11.3.4 U.K.
11.3.5 Spain
11.3.6 Rest of Europe
11.4 Asia-Pacific
11.4.1 China
11.4.2 Japan
11.4.3 India
11.4.4 Australia
11.4.5 Rest of Asia-Pacific
11.5 Latin America
11.5.1 Brazil
11.5.2 Argentina
11.5.3 Rest of Latin America
11.6 Rest of the World (ROW)
11.6.1 the Middle East
11.6.2 Others in ROW
12 Competitive Landscape (Page No. - 185)
12.1 Introduction
12.2 Competitive Filling Equipment Market
12.2.1 Development Strategy, By Filling Equipment Companies
12.3 Annual Development Strategies
12.4 New Technology Launch � Most Preferred Strategic Approach
12.4.1 Annual New Technology Launches
12.4.2 New Technology Launches, By Company
12.5 Market Share Analysis
12.6 List of Recent Developments
13 Company Profiles (Page No. - 198)
(Company At A Glance, Recent Financials, Products & Services, Strategies & Insights, & Recent Developments)*
13.1 Accutek Packaging Equipment Companies, Inc.
13.2 Bosch Packaging Technology
13.3 Coesia Group
13.4 GEA Group Ag
13.5 JBT Corporation
13.6 KHS GMBH
13.7 Krones Group
13.8 Ronchi Mario S.P.A.
13.9 Scholle Packaging
13.10 Tetra Laval
*Details on Company At A Glance, Recent Financials, Products & Services, Strategies & Insights, & Recent Developments Might Not Be Captured in Case of Unlisted Companies.
Appendix (Page No. - 265)
Acquisitions
Agreements & Partnerships
New Technology Launches
Expansions & Investments
List of Tables (124 Tables)
Table 1 Filling Equipment Market Estimation
Table 2 Latest Developments in Automation Technology
Table 3 Filling Equipment Market Size, By Industry, 2012�2019 ($Million)
Table 4 Food Filling Equipment Market Size, By Geography, 2012�2019 ($Million)
Table 5 Beverage Filling Equipment Technology
Table 6 Beverage Filling Equipment Market Size, By Geography, 2012�2019 ($Million)
Table 7 Food & Beverage Filling Equipment Market Size, By Geography, 2012�2019 ($Million)
Table 8 North America: F & B Filling Equipment Market Size, By Geography, 2012�2019 ($Million)
Table 9 Europe: F & B Filling Equipment Market Size, By Geography, 2012�2019 ($Million)
Table 10 Asia-Pacific: F & B Filling Equipment Market Size, By Geography, 2012�2019 ($Million)
Table 11 Latin America: F & B Filling Equipment Market Size, By Geography, 2012�2019 ($Million)
Table 12 ROW: F & B Filling Equipment Market Size, By Geography, 2012�2019 ($Million)
Table 13 F & B Filling Equipment Market Size, By Process, 2012�2019 ($Million)
Table 14 Manual F & B Filling Equipment Market Size, By Geography, 2012�2019 ($Million)
Table 15 Semi-Automatic F & B Filling Equipment Market Size, By Geography, 2012�2019 ($Million)
Table 16 Automatic F & B Filling Equipment Market Size, By Geography, 2012�2019 ($Million)
Table 17 F & B Filling Equipment Market Size, By Type, 2012�2019 ($Million)
Table 18 Rotary F & B Filling Equipment Market Size, By Geography, 2012�2019 ($Million)
Table 19 Volumetric F & B Filling Equipment Market Size, By Geography, 2012�2019 ($Million)
Table 20 Aseptic F & B Filling Equipment Market Size, By Geography, 2012�2019 ($Million)
Table 21 Net Weight F & B Filling Equipment Market Size, By Geography, 2012�2019 ($Million)
Table 22 Other F & B Filling Equipment Market Size, By Geography, 2012�2019 ($Million)
Table 23 Rotary F & B Filling Equipment Market Size, By Process, 2012�2019 ($Million)
Table 24 Volumetric F & B Filling Equipment Market Size, By Process, 2012�2019 ($Million)
Table 25 Aseptic F & B Filling Equipment Market Size, By Process, 2012�2019 ($Million)
Table 26 Net Weight F & B Filling Equipment Market Size, By Process, 2012�2019 ($Million)
Table 27 Other F & B Filling Equipment Market Size, By Process, 2012�2019 ($Million)
Table 28 F & B Filling Equipment Market Size, By Product, 2012�2019 ($Million)
Table 29 F & B Solid Product Filling Equipment Market Size, By Product Type, 2012�2019 ($Million)
Table 30 F & B Semi-Solid Product Filling Equipment Market Size, By Product Type, 2012�2019 ($Million)
Table 31 F & B Liquid Product Filling Equipment Market Size, By Product Type, 2012�2019 ($Million)
Table 32 Pharmaceutical Filling Equipment Market Size, By Geography, 2012�2019 ($Million)
Table 33 Pharmaceutical Filling Equipment Market Size, By Geography, 2012�2019 ($Million)
Table 34 North America: Pharmaceutical Filling Equipment Market Size, By Geography, 2012�2019 ($Million)
Table 35 Europe: Pharmaceutical Filling Equipment Market Size, By Geography, 2012�2019 ($Million)
Table 36 Asia-Pacific: Pharmaceutical Filling Equipment Market Size, By Geography, 2012�2019 ($Million)
Table 37 Latin America: Pharmaceutical Filling Equipment Market Size, By Geography, 2012�2019 ($Million)
Table 38 ROW: Pharmaceutical Filling Equipment Market Size, By Geography, 2012�2019 ($Million)
Table 39 Cosmetic Filling Equipment & Their Application
Table 40 Cosmetic Filling Equipment Market Size, By Geography, 2012�2019 ($Million)
Table 41 Cosmetic Filling Equipment Market Size, By Application, 2012�2019 ($Million)
Table 42 North America: Cosmetic Filling Equipment Market Size, By Geography, 2012�2019 ($Million)
Table 43 Europe: Cosmetic Filling Equipment Market Size, By Geography, 2012�2019 ($Million)
Table 44 Asia-Pacific: Cosmetic Filling Equipment Market Size, By Geography, 2012�2019 ($Million)
Table 45 Latin America: Cosmetic Filling Equipment Market Size, By Geography, 2012�2019 ($Million)
Table 46 ROW: Cosmetic Filling Equipment Market Size, By Geography, 2012�2019 ($Million)
Table 47 Other Industrial Filling Equipment Market Size, By Geography, 2012�2019 ($Million)
Table 48 Filling Equipment Market Size, By Type, 2012�2019 ($Million)
Table 49 Rotary Filling Equipment Market Size, By Geography, 2012�2019 ($Million)
Table 50 Rotary Filling Equipment Market Size, By Process, 2012�2019 ($Million)
Table 51 Volumetric Filling Equipment Market Size, By Geography, 2012�2019 ($Million)
Table 52 Volumetric Filling Equipment Market Size, By Process, 2012�2019 ($Million)
Table 53 Aseptic Filling Equipment Market Size, By Geography, 2012�2019 ($Million)
Table 54 Aseptic Filling Equipment Market Size, By Process, 2012�2019 ($Million)
Table 55 Net Weight Filling Equipment Market Size, By Geography, 2012�2019 ($Million)
Table 56 Net Weight Filling Equipment Market Size, By Process, 2012�2019 ($Million)
Table 57 Other Filling Equipment Market Size, By Geography, 2012�2019 ($Million)
Table 58 Other Filling Equipment Market Size, By Process, 2012�2019 ($Million)
Table 59 Filling Equipment Market Size, By Process, 2012�2019 ($Million)
Table 60 Manual Filling Equipment Market Size, By Geography, 2012�2019 ($Million)
Table 61 Manual Filling Equipment Market Size, By Industry, 2012�2019 ($Million)
Table 62 Semi-Automatic Filling Equipment Market Size, By Geography, 2012�2019 ($Million)
Table 63 Semi-Automatic Filling Equipment Market Size, By Industry, 2012�2019 ($Million)
Table 64 Automatic Filling Equipment Market Size, By Geography, 2012�2019 ($Million)
Table 65 Automatic Filling Equipment Market Size, By Industry, 2012�2019 ($Million)
Table 66 Filling Equipment Market Size, By Product, 2012�2019 ($Million)
Table 67 Solid Product Filling Equipment Market Size, By Industry, 2012�2019 ($Million)
Table 68 Semi-Solid Product Filling Equipment Market Size, By Industry, 2012�2019 ($Million)
Table 69 Liquid Product Filling Equipment Market Size, By Industry, 2012�2019 ($Million)
Table 70 Filling Equipment Market Size, By Geography, 2012�2019 ($Million)
Table 71 North America: Filling Equipment Market Size, By Country, 2012�2019 ($Million)
Table 72 North America: Filling Equipment Market Size, By Industry, 2012�2019 ($Million)
Table 73 U.S.: Filling Equipment Market Size, By Industry, 2012�2019 ($Million)
Table 74 Canada: Filling Equipment Market Size, By Industry, 2012�2019 ($Million)
Table 75 Mexico: Filling Equipment Market Size, By Industry, 2012�2019 ($Million)
Table 76 Europe: Filling Equipment Market Size, By Country, 2012�2019 ($Million)
Table 77 Europe: Filling Equipment Market Size, By Industry, 2012�2019 ($Million)
Table 78 Germany: Filling Equipment Market Size, By Industry, 2012�2019 ($Million)
Table 79 Italy: Filling Equipment Market Size, By Industry, 2012�2019 ($Million)
Table 80 France: Filling Equipment Market Size, By Industry, 2012�2019 ($Million)
Table 81 U.K.: Filling Equipment Market Size, By Industry, 2012�2019 ($Million)
Table 82 Spain: Filling Equipment Market Size, By Industry, 2012�2019 ($Million)
Table 83 Rest of Europe: Filling Equipment Market Size, By Industry, 2012�2019 ($Million)
Table 84 Asia-Pacific: Filling Equipment Market Size, By Country, 2012�2019 ($Million)
Table 85 Asia-Pacific: Filling Equipment Market Size, By Industry, 2012�2019 ($Million)
Table 86 China: Filling Equipment Market Size, By Industry, 2012�2019 ($Million)
Table 87 Japan: Filling Equipment Market Size, By Industry, 2012�2019 ($Million)
Table 88 India: Filling Equipment Market Size, By Industry, 2012�2019 ($Million)
Table 89 Australia: Filling Equipment Market Size, By Industry, 2012�2019 ($Million)
Table 90 Rest of Asia-Pacific: Filling Equipment Market Size, By Industry, 2012�2019 ($Million)
Table 91 Latin America: Filling Equipment Market Size, By Country, 2012�2019 ($Million)
Table 92 Latin America: Filling Equipment Market Size, By Industry, 2012�2019 ($Million)
Table 93 Brazil: Filling Equipment Market Size, By Industry, 2012�2019 ($Million)
Table 94 Argentina: Filling Equipment Market Size, By Industry, 2012�2019 ($Million)
Table 95 Rest of Latin America: Filling Equipment Market Size, By Industry, 2012�2019 ($Million)
Table 96 ROW: Filling Equipment Market Size, By Geography, 2012�2019 ($Million)
Table 97 ROW: Filling Equipment Market Size, By Industry, 2012�2019 ($Million)
Table 98 The Middle East: Filling Equipment Market Size, By Industry, 2012�2019 ($Million)
Table 99 Others In ROW: Filling Equipment Market Size, By Industry, 2012�2019 ($Million)
Table 100 Acquisitions, 2013
Table 101 Agreements & Partnerships, 2013�2014
Table 102 New Technology Launches, 2013�2014
Table 103 Expansions & Investments, 2013
Table 104 Accutek: Products & Their Description
Table 105 Bosch: Products & Their Description
Table 106 Norden: Products & Their Description
Table 107 R.A Jones: Products & Their Description
Table 108 Acmavolpak: Products & Their Description
Table 109 IPI: Product & Its Description
Table 110 Citus Kalix: Products & Their Description
Table 111 Sacmo: Product & Its Description
Table 112 GEA: Products & Their Description
Table 113 GEA Avapac: Products & Their Description
Table 114 JBT: Products & Their Description
Table 115 KHS: Products & Their Description
Table 116 Krones: Products & Their Description
Table 117 Ronchi: Products & Their Description
Table 118 Scholle: Products & Their Description
Table 119 Tetra Pak: Products & Their Description
Table 120 Sidel: Products & Their Description
Table 121 Acquisitions, 2009�2012
Table 122 Agreements & Partnerships, 2011�2012
Table 123 New Technology Launches, 2011�2013
Table 124 Expansions & Investments, 2010�2012
List of Figures (42 Figures)
Figure 1 Research Methodology
Figure 2 Filling Equipment Market Size Estimation Methodology
Figure 3 Filling Equipment Market Size, By Geography, 2014 ($Million)
Figure 4 Filling Equipment Market Share (Value), By Industry, 2014
Figure 5 Filling Equipment Market Segmentation
Figure 6 Filling Equipment Market Size, By Geography, 2013 Vs. 2019 ($Million)
Figure 7 Filling Equipment Market Share (Value), By Geography & Market Size, By Country, 2013 ($Million)
Figure 8 Filling Equipment Market Size, By Geography, 2013 Vs. 2019 ($Million)
Figure 9 Filling Equipment Market Size, By Industry & Geography, 2013 ($Million)
Figure 10 Filling Equipment Market Size, By Industry, 2014 Vs. 2019 ($Million)
Figure 11 Filling Equipment Market Size, By Industry & Geography, 2013 ($Million)
Figure 12 F & B Filling Equipment Market Share (Value), By Type, 2013
Figure 13 Cosmetic Filling Equipment Market Share (Value), By Application, 2013
Figure 14 Life Cycle of Filling Equipment Market, By Application, 2005-2020
Figure 15 Filling Equipment Market Share (Value), By Process, 2013
Figure 16 Filling Equipment Market Insights
Figure 17 Drivers & Restraint of Filling Equipment Market
Figure 18 Filling Equipment Market: Development Strategy Analysis, 2011-2013
Figure 19 Packaging Industry Segment
Figure 20 Packaging Industry Share (Value), By Segment, 2013
Figure 21 Packaging Machinery Market Share (Value), By Application, 2013
Figure 22 Packaging Machinery Market Share (Value), By Type, 2013
Figure 23 Types of Filling Equipment
Figure 24 Common Filling Technology
Figure 25 Different Types of Filling Equipment
Figure 26 Filling Market Supply Chain Analysis
Figure 27 Filling Equipment Market Share (Value), 2012
Figure 28 Impact Analysis of Filling Equipment Market
Figure 29 Filling Equipment Market Share (Value), By Industry, 2012
Figure 30 Aseptic Filling Process
Figure 31 Filling Equipment Market Share (Value), By Process, 2013
Figure 32 Filling Equipment Market Share (Value), By Product, & Market Size, By Industry, 2013 ($Million)
Figure 33 Liquid Filling Process
Figure 34 Filling Equipment Market Segmentation, By Geography & Industry, 2013
Figure 35 Filling Equipment Market Development & Product Portfolio, By Company, 2009�2014
Figure 36 Filling Equipment Market Development Share, By Company, 2009�2014
Figure 37 Filling Equipment Market: Annual Developments Trend, By Growth Strategy, 2009�2014
Figure 38 Filling Equipment Market: Annual Developments Trend, By Company, 2009�2014
Figure 39 Filling Equipment Market: Development Share, By Growth Strategy, 2009�2014
Figure 40 Filling Equipment Market: New Technology Launches, 2009�2014
Figure 41 New Technology Launches, By Company
Figure 42 Filling Equipment Market Share (Value) Analysis, By Company, 2013


Growth opportunities and latent adjacency in Filling Equipment Market