Agricultural Surfactants Market

Agricultural Surfactants Market by Type (Non-Ionic, Anionic, Cationic, Amphoteric), Application (Herbicides, Fungicides), Substrate Type, Crop Type (Cereals & Grains, Pulses & Oilseeds, Fruits & Vegetables) and Region - Global Forecast to 2028

Report Code: AGI 4045 Aug, 2023, by marketsandmarkets.com

Agricultural Surfactants Market Analysis

From 2023 to 2028, the global agricultural surfactants market is expected to rise at a remarkable compound annual growth rate (CAGR) of 6.2%. This rising trend is expected to boost market value from $1.7 billion in 2023 to $2.3 billion by the end of 2028.

The robust growth of the global market is intricately linked to the steady expansion of global crop production, as highlighted by the Food and Agriculture Organization of the United Nations (FAO). The increase in global crop production by 1.3% to reach 9.5 billion tonnes in 2021 underscores the intensifying need for optimizing agricultural inputs for enhanced yields. Agricultural surfactants play a pivotal role in this context, as they improve agrochemical efficiency, leading to more effective pest and weed control. This, in turn, contributes to increased crop yields and quality. Additionally, the escalating global population's demands for food necessitate higher productivity from existing agricultural land, further driving the adoption of surfactants to maximize the impact of agrochemical applications. As precision agriculture techniques become more prevalent and sustainable practices gain traction, the use of surfactants is poised to continue its upward trajectory, serving as a linchpin in meeting the world's growing food production requirements.
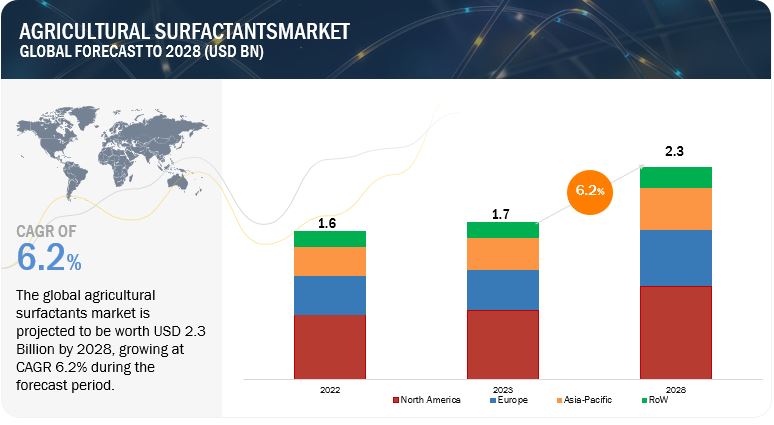
Agricultural Surfactants Market Overview

To know about the assumptions considered for the study, Request for Free Sample Report
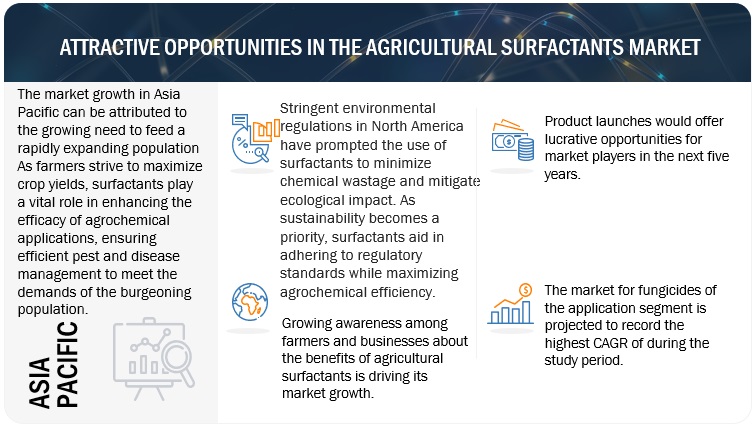
Agricultural Surfactants Market Opportunities

To know about the assumptions considered for the study, download the pdf brochure

Agricultural Surfactants Market Growth Insights

Drivers: Rise in demand for green solutions

The surge in demand for environmentally sustainable solutions is propelling substantial growth in the agricultural surfactants market. As concerns over ecological impact escalate, farmers and agribusinesses are seeking greener alternatives to conventional chemical inputs. Agricultural surfactants, with their ability to enhance the efficiency of agrochemicals and reduce chemical wastage, align perfectly with this shift towards eco-friendly practices. These surfactants enable precise and targeted application of pesticides and fertilizers, minimizing runoff and environmental contamination. The push for green solutions is driving research and development efforts toward the formulation of biodegradable and low-toxicity surfactants, further bolstering their appeal. As sustainability becomes a cornerstone of modern agriculture, the market is experiencing substantial growth due to its pivotal role in fostering environmentally responsible practices.

Restraint: Use of genetically modified seeds

The utilization of genetically modified (GM) seeds is imposing a degree of constraint on the expansion of the market. Genetically modified crops often possess intrinsic traits that provide them with enhanced resistance to pests and diseases, reducing the need for external chemical applications, including those aided by surfactants. This shift towards GM crops has led to a partial displacement of conventional crop varieties that necessitate more intensive chemical management.

As GM crops gain prominence, the demand for agrochemicals, including surfactants, may experience a relative decrease in specific markets. Moreover, the introduction of traits directly into the seed may negate the necessity for certain agrochemical applications altogether, limiting the potential applications of surfactants.

While the agricultural surfactants market remains robust due to their relevance in many contexts, the growing prevalence of GM crops alters the landscape by redefining pest and disease management practices. As a result, the market's expansion trajectory may encounter some constraints in regions or sectors where genetically modified seeds are more prevalent.

Opportunity: Production of bio-based surfactant products

The production and adoption of biobased surfactants present a significant opportunity within the agricultural surfactants market, driving its growth in a sustainable direction. Biobased surfactants, derived from renewable sources such as plant oils and microbes, align seamlessly with the increasing demand for eco-friendly solutions in agriculture. These surfactants offer distinct advantages, including higher biodegradability, lower environmental impact, and reduced toxicity compared to their synthetic counterparts.

As environmental consciousness rises, consumers, regulators, and industries alike are prioritizing sustainable practices. Biobased surfactants address this demand by providing effective agrochemical delivery while minimizing harm to ecosystems. This shift towards greener alternatives complements evolving farming practices, where precision and minimal ecological disruption are paramount.

With consumers increasingly favoring products with lower environmental footprints, the growth of biobased surfactants is driving market expansion by meeting both performance and sustainability criteria in the agricultural sector.

Challenge: Growth of environmental concerns against the usage of agrochemicals

The growth of environmental concerns is placing a significant restraint on the agricultural surfactants market. As awareness of ecological impacts intensifies, there's mounting pressure on agricultural practices to align with sustainability goals. Traditional agrochemical applications, including surfactant usage, are under scrutiny due to their potential contributions to soil and water pollution, affecting ecosystems and human health.

Regulatory bodies worldwide are imposing stricter guidelines and restrictions on agrochemical usage to mitigate environmental degradation. This has led to a shift towards more eco-friendly alternatives, challenging the conventional use of surfactants in some cases. Additionally, the perception of chemical-intensive agriculture as detrimental to ecosystems and biodiversity is influencing consumer preferences and shaping market dynamics.

As sustainable farming gains traction, the market must navigate this shift by adapting formulations, production methods, and marketing strategies to align with environmental expectations. Balancing the need for effective pest and disease management with reduced ecological impact presents a complex challenge that necessitates innovation and collaboration across the industry to address the growing concerns and ensure a sustainable future for agriculture.

Agricultural Surfactants Market Ecosystem
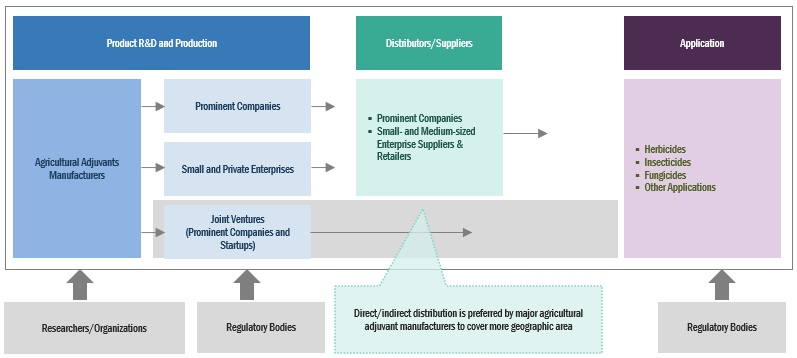
Agricultural Surfactants Market Ecosystem

Agricultural Surfactants Market by Crop Type Insights

Based on crop type, the cereals & grains segment is estimated to hold the largest market share during the forecast period of the market.

Cereals and grains hold the largest share of the agricultural surfactant market due to their widespread cultivation and economic significance. These staple crops encompass a vast portion of global agricultural production, serving as a fundamental source of food, feed, and industrial raw materials. According to the Food and Agriculture Organization of the United Nations (FAO), the total cereals and grains production in 2021 was 2,819 million tonnes. This is an increase of 1.6% from the total production recorded in 2020. Given their extensive leaf surfaces and expansive cultivation areas, effective pesticide coverage is essential for managing pests, diseases, and weeds. Agricultural surfactants play a pivotal role in optimizing pesticide efficiency by improving adhesion, spreading, and absorption on cereal and grain surfaces.

Furthermore, the demand for higher crop yields to feed the growing global population accentuates the importance of precision agrochemical application. Surfactants enhance the efficacy of pesticides, leading to increased yields and quality of cereals and grains. As modern farming practices evolve, the need for agrochemical optimization becomes increasingly critical, positioning cereals and grains as key beneficiaries of surfactant technology and driving their dominance in the agricultural surfactant market. The abundant availability of sugarcane bagasse, especially in regions with significant sugar production, provides a cost-effective and renewable resource for agricultural surfactants production. Additionally, utilizing bagasse can help address waste management challenges associated with its disposal, contributing to a more circular and environmentally responsible approach. By tapping into the potential of sugarcane bagasse, the agricultural surfactants market can benefit from increased feedstock availability, improved cost-efficiency, and a stronger sustainability profile, ultimately driving its growth and market adoption.

Agricultural Surfactants Market by Application Insights

Based on application, the fungicides segment is anticipated to witness the highest growth in the market.

Fungicides in the agricultural surfactants application sector are witnessing the fastest growth due to several pivotal factors. Fungal diseases pose substantial threats to crop yields and quality, necessitating effective management strategies. Agricultural surfactants significantly enhance the performance of fungicides by improving their coverage, adhesion, and penetration on plant surfaces, ensuring comprehensive protection against fungal pathogens. With shifting weather patterns and increased global trade, the risk of fungal outbreaks has surged, intensifying the demand for reliable disease management tools.

Furthermore, the environmental and regulatory push for reduced chemical usage aligns with the role of surfactants in optimizing fungicide efficiency. Their ability to aid targeted and efficient applications aligns with sustainable farming practices. As the agricultural sector prioritizes precision and eco-conscious approaches, fungicide-associated surfactants stand out as essential tools for combating fungal diseases, contributing to their rapid growth in the global market.

Agricultural Surfactants Market by Substrate Type Insights

Based on substrate type, the bio-based segment is projected to experience the highest growth during the forecast period of the market.

Biobased surfactants are poised to experience the highest growth in the market due to their alignment with two pivotal trends: sustainability and performance. As environmental concerns and regulations intensify, the demand for eco-friendly solutions in agriculture rises significantly. Biobased surfactants, derived from renewable sources, exhibit reduced environmental impact, enhanced biodegradability, and lower toxicity compared to traditional synthetic counterparts.

Moreover, the performance of biobased surfactants has been advancing, bridging the gap with synthetic alternatives. Researchers are continuously innovating to optimize their properties, ensuring compatibility with various agrochemical formulations and target crops. As modern farming practices evolve towards precision agriculture and sustainable approaches, biobased surfactants offer a strategic solution for effective pesticide delivery, reduced chemical wastage, and improved overall agrochemical performance. This dual synergy of environmental responsibility and performance enhancement positions biobased surfactants for rapid growth, making them a focal point in driving the evolution of the agricultural surfactants market.

Agricultural Surfactants Market by Regional Insights

The North America market is projected to contribute the largest share of the agricultural surfactants market.

North America's dominance in the market can be attributed to a convergence of key factors. The region's advanced agricultural practices, coupled with a strong emphasis on maximizing crop yields, have driven substantial demand for surfactants that enhance the efficiency of agrochemical applications. North American farmers and agribusinesses are at the forefront of adopting cutting-edge precision agriculture techniques, necessitating precise and effective chemical application that surfactants facilitate.

Furthermore, the presence of prominent agrochemical and biotechnology companies within North America fuels research and development efforts, leading to the continuous innovation of surfactant formulations tailored to the region's diverse crop and pest profiles. Stringent environmental regulations in the region have also accelerated the adoption of surfactants to reduce chemical wastage and environmental impact.

The North American market's robust growth is further bolstered by the region's economic strength, technological advancements, and the focus on sustainable agricultural practices. The alignment of these factors positions North America as a leader in agricultural surfactant adoption, enabling it to maintain the largest market share within the global agricultural surfactants industry.
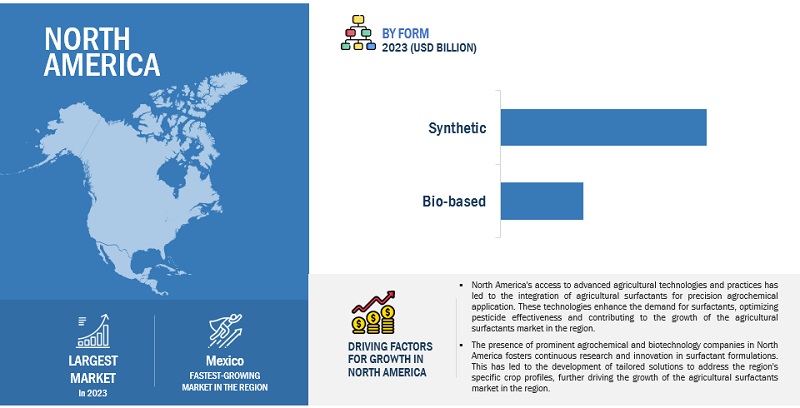
North America Agricultural Surfactants Market

Top Companies in Agricultural Surfactants Industry

CHS Inc. (US), BASF SE (Germany), Solvay (Belgium), Corteva Agriscience (US), Evonik (Germany), Croda International Plc (UK), Nufarm (Australia), CLARIANT (Switzerland), and Stepan Company (US)are among the key players in the global market. To increase their company's revenues and market shares, companies are focusing on launching new products, developing partnerships, and expanding their production facilities. The key strategies used by companies in the agricultural surfactants market include strategic acquisitions to gain a foothold over the extensive supply chain and new product launches as a result of extensive research and development (R&D) initiatives.

Agricultural Surfactants Market Report Scope

Report Metric

Details

Agricultural Surfactants Market Estimated Size (2023)

US $1.7 Billion

Projected Market Valuation (2028)

US $2.3 Billion

Value-based CAGR (2023-2028)

6.2%

Forecast period considered

2023–2028

Units considered

Value (USD)

Segments Covered

By Type, By Substrate Type, By Application, By Crop Type, and By Region

Regions covered

North America, Europe, Asia Pacific, South America, and RoW

Companies studied

  • Corteva Agriscience (US)
  • Helena Agri-Enterprises, LLC (US)
  • BASF SE (Germany)
  • Evonik (Germany)
  • Solvay (Belgium)
  • CLARIANT (Switzerland)
  • CHS Inc. (US)
  • Nufarm (Australia)
  • Croda International Plc (UK)
  • Stepan Company (US)
  • INNVICTIS (US)

Agricultural Surfactants Market Segmentation:

Market By Type
  • Non-ionic
  • Anionic
  • Cationic
  • Amphoteric
Market By Substrate Type
  • Synthetic
  • Bio-based
Market By Application
  • Herbicides
  • Fungicides
  • Insecticides
  • Other Applications
Market By Crop Type
  • Cereals & Grains
  • Pulses & Oilseeds
  • Fruits & Vegetables
  • Other Crop Types
Market By Region:
  • North America
  • Europe
  • Asia Pacific
  • South America
  • Rest of the World (RoW)

Note 1 Other applications include fertilizers, biostimulants, plant regulators, and nematicides.
Note 2: Other crop types include sugarcane, plantation crops, and turf & ornamentals.

Agricultural Surfactants Market News

  • In February 2022, CLARIANT (Switzerland) launched Vita, its latest innovation featuring 100% bio-based surfactants and polyethylene glycols. Tailored for natural formulations with an emphasis on achieving a robust Renewable Carbon Index (RCI), Vita enabled manufacturers to optimize bio-based carbon content in crop formulations.
  • In August 2021, CHS  Inc. (US) introduced Last-Chance Pro to increase herbicide uptake, translocation, and efficacy.

Frequently Asked Questions (FAQ):

To speak to our analyst for a discussion on the above findings, click Speak to Analyst

TABLE OF CONTENTS
 
1 INTRODUCTION OF AGRICULTURAL SURFACTANTS MARKET (Page No. - 52)
    1.1 STUDY OBJECTIVES 
    1.2 MARKET DEFINITION 
    1.3 STUDY SCOPE 
           1.3.1 MARKET SEGMENTATION
           1.3.2 REGIONS COVERED
           1.3.3 INCLUSIONS & EXCLUSIONS
    1.4 YEARS CONSIDERED 
    1.5 CURRENCY CONSIDERED 
           TABLE 1 USD EXCHANGE RATES, 2019–2022
    1.6 UNIT CONSIDERED 
    1.7 STAKEHOLDERS 
    1.8 SUMMARY OF CHANGES 
 
2 RESEARCH METHODOLOGY (Page No. - 58)
    2.1 RESEARCH DATA 
           FIGURE 1 RESEARCH DESIGN
           2.1.1 SECONDARY DATA
                    2.1.1.1 Key data from secondary sources
           2.1.2 PRIMARY DATA
                    2.1.2.1 Key participants and opinion leaders
                    2.1.2.2 Key insights from industry experts
                    2.1.2.3 Breakdown of primary interviews
                               FIGURE 2 BREAKDOWN OF PRIMARY INTERVIEWS: BY COMPANY TYPE, DESIGNATION, AND REGION
                    2.1.2.4 Key data from primary sources
    2.2 MARKET SIZE ESTIMATION 
           2.2.1 APPROACH ONE: BOTTOM-UP APPROACH (BASED ON MARKET, BY REGION)
           2.2.2 APPROACH TWO: TOP-DOWN APPROACH (BASED ON GLOBAL MARKET)
    2.3 DATA TRIANGULATION 
           FIGURE 3 DATA TRIANGULATION METHODOLOGY
    2.4 RESEARCH ASSUMPTIONS 
    2.5 LIMITATIONS AND RISK ASSESSMENT 
           2.5.1 MAJOR RECESSION INDICATORS
                    FIGURE 4 MAJOR RECESSION INDICATORS
                    FIGURE 5 GLOBAL INFLATION RATE, 2011–2021
                    FIGURE 6 GLOBAL GROSS DOMESTIC PRODUCT, 2011–2021 (USD TRILLION)
                    FIGURE 7 RECESSION INDICATORS AND THEIR IMPACT ON MARKET
                    FIGURE 8 GLOBAL MARKET: CURRENT FORECAST VS. RECESSION FORECAST
 
3 EXECUTIVE SUMMARY (Page No. - 70)
    TABLE 2 MARKET SNAPSHOT, 2023 VS. 2028 
    FIGURE 9 MARKET, BY TYPE, 2023 VS. 2028 (USD MILLION) 
    FIGURE 10 AGRICULTURAL SURFACTANTS MARKET, BY APPLICATION, 2023 VS. 2028 (USD MILLION) 
    FIGURE 11 MARKET, BY SUBSTRATE TYPE, 2023 VS. 2028 (USD MILLION) 
    FIGURE 12 MARKET, BY CROP TYPE, 2023 VS. 2028 (USD MILLION) 
    FIGURE 13 MARKET: REGIONAL SNAPSHOT 
 
4 PREMIUM INSIGHTS (Page No. - 76)
    4.1 ATTRACTIVE OPPORTUNITIES FOR PLAYERS IN MARKET 
           FIGURE 14 NEED FOR ADOPTING HIGH-QUALITY PESTICIDES IN AGRICULTURE SECTOR TO DRIVE MARKET
    4.2 NORTH AMERICA: MARKET, BY APPLICATION AND COUNTRY 
           FIGURE 15 NON-IONIC SEGMENT AND US TO ACCOUNT FOR SIGNIFICANT SHARE IN 2023
    4.3 MARKET: REGIONAL SUBMARKETS 
           FIGURE 16 US TO ACCOUNT FOR LARGEST SHARE IN 2023
    4.4 MARKET, BY TYPE 
           FIGURE 17 NON-IONIC SEGMENT TO ACCOUNT FOR LARGEST SHARE IN 2023
    4.5 MARKET, BY SUBSTRATE TYPE 
           FIGURE 18 SYNTHETIC SEGMENT TO DOMINATE MARKET IN 2023
    4.6 MARKET, BY APPLICATION 
           FIGURE 19 HERBICIDES SEGMENT TO ACCOUNT FOR LARGEST SHARE IN 2023
    4.7 MARKET, BY CROP TYPE 
           FIGURE 20 CEREALS & GRAINS SEGMENT TO LEAD MARKET IN 2023
    4.8 AGRICULTURAL SURFACTANTS MARKET, BY APPLICATION AND REGION 
           FIGURE 21 HERBICIDES SEGMENT TO DOMINATE NORTH AMERICAN MARKET BY 2028
 
5 MARKET OVERVIEW (Page No. - 82)
    5.1 INTRODUCTION 
    5.2 MACROECONOMIC INDICATORS 
           5.2.1 POPULATION GROWTH AND DECREASE IN ARABLE LAND
                    FIGURE 22 POPULATION GROWTH, 1950–2025 (BILLION)
                    FIGURE 23 PER CAPITA ARABLE LAND, 1960–2025 (HA PER CAPITA)
           5.2.2 INCREASE IN FARM EXPENDITURE
                    FIGURE 24 SHARE OF TOTAL ON-FARM PRODUCTION EXPENDITURE
    5.3 MARKET DYNAMICS 
           FIGURE 25 MARKET: DRIVERS, RESTRAINTS, OPPORTUNITIES, AND CHALLENGES
           5.3.1 DRIVERS
                    5.3.1.1 Adoption of precision farming and protected agriculture
                    5.3.1.2 Increase in demand for green solutions
           5.3.2 RESTRAINTS
                    5.3.2.1 Strict regulations regarding use of synthetic surfactants
                    5.3.2.2 Rising use of genetically modified seeds
                               TABLE 3 GM CROPS & BIOPESTICIDES: SUBSTITUTION POTENTIAL OF SYNTHETIC PESTICIDES FOR VARIOUS CROPS
           5.3.3 OPPORTUNITIES
                    5.3.3.1 Production of sustainable bio-based surfactant products
                    5.3.3.2 Development of cost-effective production techniques
           5.3.4 CHALLENGES
                    5.3.4.1 Rising environmental concerns
 
6 INDUSTRY TRENDS (Page No. - 90)
    6.1 INTRODUCTION 
    6.2 VALUE CHAIN ANALYSIS 
           FIGURE 26 VALUE CHAIN ANALYSIS
           6.2.1 RESEARCH AND PRODUCT DEVELOPMENT
           6.2.2 RAW MATERIAL SOURCING
           6.2.3 PRODUCTION AND PROCESSING
           6.2.4 PACKAGING
           6.2.5 DISTRIBUTION
           6.2.6 MARKETING AND SALES
    6.3 TRENDS AND DISRUPTIONS IMPACTING CUSTOMERS’ BUSINESSES 
           FIGURE 27 REVENUE SHIFT FOR AGRICULTURAL SURFACTANTS MARKET
    6.4 TARIFF AND REGULATORY LANDSCAPE 
           TABLE 4 NORTH AMERICA: LIST OF REGULATORY BODIES, GOVERNMENT AGENCIES, AND OTHER ORGANIZATIONS
           TABLE 5 EUROPE: LIST OF REGULATORY BODIES, GOVERNMENT AGENCIES, AND OTHER ORGANIZATIONS
           TABLE 6 ASIA PACIFIC: LIST OF REGULATORY BODIES, GOVERNMENT AGENCIES, AND OTHER ORGANIZATIONS
           TABLE 7 SOUTH AMERICA: LIST OF REGULATORY BODIES, GOVERNMENT AGENCIES, AND OTHER ORGANIZATIONS
           TABLE 8 MIDDLE EAST: LIST OF REGULATORY BODIES, GOVERNMENT AGENCIES, AND OTHER ORGANIZATIONS
           6.4.1 NORTH AMERICA
                    6.4.1.1 US
                    6.4.1.2 Canada
           6.4.2 EUROPE
                    6.4.2.1 UK
                    6.4.2.2 Germany
           6.4.3 ASIA PACIFIC
                    6.4.3.1 Australia
           6.4.4 REST OF THE WORLD
                    6.4.4.1 South Africa
    6.5 PATENT ANALYSIS 
           FIGURE 28 TOTAL PATENTS GRANTED, 2013–2022
           FIGURE 29 TOTAL PATENTS GRANTED, BY KEY REGION
           TABLE 9 LIST OF MAJOR PATENTS PERTAINING TO MARKET, 2016–2023
    6.6 TRADE ANALYSIS 
           TABLE 10 IMPORT VALUE OF AGRICULTURAL SURFACTANTS, BY KEY COUNTRY, 2022 (USD THOUSAND)
           TABLE 11 EXPORT VALUE OF AGRICULTURAL SURFACTANTS, BY KEY COUNTRY, 2022 (USD THOUSAND)
    6.7 PRICING ANALYSIS 
           6.7.1 AVERAGE SELLING PRICE TRENDS
                    TABLE 12 GLOBAL MARKET, BY REGION, 2020–2022 (USD MILLION PER KT)
                    TABLE 13 GLOBAL MARKET, BY TYPE, 2020–2022 (USD MILLION PER KT)
                    TABLE 14 OATS: GLOBAL MARKET, BY REGION, 2020–2022 (USD MILLION PER KT)
    6.8 ECOSYSTEM ANALYSIS 
           6.8.1 DEMAND SIDE
           6.8.2 SUPPLY SIDE
                    FIGURE 30 ECOSYSTEM MAP
                    TABLE 15 ROLE OF PLAYERS IN MARKET ECOSYSTEM
    6.9 TECHNOLOGY ANALYSIS 
           6.9.1 MICROBIAL BIOSURFACTANTS
           6.9.2 BIOSURFACTANT MICROEMULSION SYSTEMS
    6.10 CASE STUDIES 
           6.10.1 EVONIK DEVELOPED SUSTAINABLE SURFACTANTS TO ENCOURAGE ENVIRONMENTALLY FRIENDLY CROP PROTECTION
           6.10.2 WILBUR-ELLIS DEVELOPED NON-IONIC SURFACTANTS TO IMPROVE DEPOSITION QUALITY OF ORGANIC PRODUCTS
    6.11 PORTER’S FIVE FORCES ANALYSIS 
                    TABLE 16 IMPACT OF PORTER’S FIVE FORCES ON AGRICULTURAL SURFACTANTS MARKET
           6.11.1 INTENSITY OF COMPETITIVE RIVALRY
           6.11.2 BARGAINING POWER OF SUPPLIERS
           6.11.3 BARGAINING POWER OF BUYERS
           6.11.4 THREAT OF SUBSTITUTES
           6.11.5 THREAT OF NEW ENTRANTS
    6.12 KEY STAKEHOLDERS AND BUYING CRITERIA 
           6.12.1 KEY STAKEHOLDERS IN BUYING PROCESS
                    FIGURE 31 INFLUENCE OF STAKEHOLDERS ON BUYING PROCESS FOR KEY SUBSTRATE TYPES
                    TABLE 17 INFLUENCE OF STAKEHOLDERS ON BUYING PROCESS FOR KEY SUBSTRATE TYPES
           6.12.2 BUYING CRITERIA
                    FIGURE 32 KEY BUYING CRITERIA FOR KEY SUBSTRATE TYPES
                    TABLE 18 KEY BUYING CRITERIA FOR SUBSTRATE TYPES
    6.13 KEY CONFERENCES & EVENTS 
                    TABLE 19 KEY CONFERENCES & EVENTS, 2023–2024
 
7 MARKET, BY TYPE (Page No. - 115)
    7.1 INTRODUCTION 
           FIGURE 33 NON-IONIC SEGMENT TO LEAD MARKET DURING FORECAST PERIOD
           TABLE 20 MARKET, BY TYPE, 2019–2022 (USD MILLION)
           TABLE 21 MARKET, BY TYPE, 2023–2028 (USD MILLION)
           TABLE 22 MARKET, BY TYPE, 2019–2022 (KT)
           TABLE 23 MARKET, BY TYPE, 2023–2028 (KT)
    7.2 NON-IONIC 
           7.2.1 RISING DEMAND FOR EXPERTLY FORMULATED ADJUVANT FORMULATIONS TO DRIVE GROWTH
                    TABLE 24 NON-ICONIC: MARKET, BY REGION, 2019–2022 (USD MILLION)
                    TABLE 25 NON-ICONIC: MARKET, BY REGION, 2023–2028 (USD MILLION)
                    TABLE 26 NON-ICONIC: MARKET, BY REGION, 2019–2022 (KT)
                    TABLE 27 NON-ICONIC: MARKET, BY REGION, 2023–2028 (KT)
    7.3 ANIONIC 
           7.3.1 RISING ADOPTION OF ANIONIC AGRICULTURAL SURFACTANTS TO IMPROVE ADHESION IN PESTICIDE FORMULATIONS TO BOOST GROWTH
                    TABLE 28 ANIONIC: MARKET, BY REGION, 2019–2022 (USD MILLION)
                    TABLE 29 ANIONIC: MARKET, BY REGION, 2023–2028 (USD MILLION)
                    TABLE 30 ANIONIC: MARKET, BY REGION, 2019–2022 (KT)
                    TABLE 31 ANIONIC: MARKET, BY REGION, 2023–2028 (KT)
    7.4 AMPHOTERIC 
           7.4.1 RISING NEED TO IMPROVE EFFICACY OF PESTICIDES, HERBICIDES, AND FERTILIZERS TO PROPEL MARKET EXPANSION
                    TABLE 32 AMPHOTERIC: MARKET, BY REGION, 2019–2022 (USD MILLION)
                    TABLE 33 AMPHOTERIC: MARKET, BY REGION, 2023–2028 (USD MILLION)
                    TABLE 34 AMPHOTERIC: MARKET, BY REGION, 2019–2022 (KT)
                    TABLE 35 AMPHOTERIC: MARKET, BY REGION, 2023–2028 (KT)
    7.5 CATIONIC 
           7.5.1 POPULARITY OF CATIONIC SURFACTANTS DUE TO THEIR PH-SENSITIVE NATURE TO FACILITATE MARKET GROWTH
                    TABLE 36 CATIONIC: AGRICULTURAL SURFACTANTS MARKET, BY REGION, 2019–2022 (USD MILLION)
                    TABLE 37 CATIONIC: MARKET, BY REGION, 2023–2028 (USD MILLION)
                    TABLE 38 CATIONIC: MARKET, BY REGION, 2019–2022 (KT)
                    TABLE 39 CATIONIC: MARKET, BY REGION, 2023–2028 (KT)
 
8 MARKET, BY APPLICATION (Page No. - 127)
    8.1 INTRODUCTION 
           FIGURE 34 HERBICIDES SEGMENT TO DOMINATE MARKET DURING FORECAST PERIOD
           TABLE 40 MARKET, BY APPLICATION, 2019–2022 (USD MILLION)
           TABLE 41 MARKET, BY APPLICATION, 2023–2028 (USD MILLION)
           TABLE 42 MARKET, BY APPLICATION, 2019–2022 (KT)
           TABLE 43 MARKET, BY APPLICATION, 2023–2028 (KT)
    8.2 HERBICIDES 
           8.2.1 DEMAND FOR INCREASED EFFICIENCY OF LEAF CUTICLES TO DRIVE USE OF SURFACTANTS IN HERBICIDES
                    TABLE 44 HERBICIDES: MARKET, BY REGION, 2019–2022 (USD MILLION)
                    TABLE 45 HERBICIDES: MARKET, BY REGION, 2023–2028 (USD MILLION)
                    TABLE 46 HERBICIDES: MARKET, BY REGION, 2019–2022 (KT)
                    TABLE 47 HERBICIDES: MARKET, BY REGION, 2023–2028 (KT)
    8.3 FUNGICIDES 
           8.3.1 FOCUS ON STRENGTHENING PERFORMANCE OF FUNGICIDES TO DRIVE MARKET
                    TABLE 48 FUNGICIDES: MARKET, BY REGION, 2019–2022 (USD MILLION)
                    TABLE 49 FUNGICIDES: MARKET, BY REGION, 2023–2028 (USD MILLION)
                    TABLE 50 FUNGICIDES: MARKET, BY REGION, 2019–2022 (KT)
                    TABLE 51 FUNGICIDES: MARKET, BY REGION, 2023–2028 (KT)
    8.4 INSECTICIDES 
           8.4.1 RISING DEMAND FOR LIMITING USE OF CHEMICALS IN INSECTICIDES TO ENCOURAGE ADOPTION OF SURFACTANTS
                    TABLE 52 INSECTICIDES: MARKET, BY REGION, 2019–2022 (USD MILLION)
                    TABLE 53 INSECTICIDES: MARKET, BY REGION, 2023–2028 (USD MILLION)
                    TABLE 54 INSECTICIDES: MARKET, BY REGION, 2019–2022 (KT)
                    TABLE 55 INSECTICIDES: MARKET, BY REGION, 2023–2028 (KT)
    8.5 OTHER APPLICATIONS 
           TABLE 56 OTHER APPLICATIONS: MARKET, BY REGION, 2019–2022 (USD MILLION)
           TABLE 57 OTHER APPLICATIONS: MARKET, BY REGION, 2023–2028 (USD MILLION)
           TABLE 58 OTHER APPLICATIONS: MARKET, BY REGION, 2019–2022 (KT)
           TABLE 59 OTHER APPLICATIONS: MARKET, BY REGION, 2023–2028 (KT)
 
9 AGRICULTURAL SURFACTANTS MARKET, BY CROP TYPE (Page No. - 138)
    9.1 INTRODUCTION 
           FIGURE 35 CEREALS & GRAINS SEGMENT TO LEAD MARKET DURING FORECAST PERIOD
           TABLE 60 MARKET, BY CROP TYPE, 2019–2022 (USD MILLION)
           TABLE 61 MARKET, BY CROP TYPE, 2023–2028 (USD MILLION)
           TABLE 62 MARKET, BY CROP TYPE, 2019–2022 (KT)
           TABLE 63 MARKET, BY CROP TYPE, 2023–2028 (KT)
    9.2 CEREALS & GRAINS 
           9.2.1 GROWING EMPHASIS ON CROP PROTECTION AND ENHANCEMENT TO DRIVE USE OF SURFACTANTS IN CEREALS AND GRAINS
                    TABLE 64 CEREALS & GRAINS: MARKET, BY REGION, 2019–2022 (USD MILLION)
                    TABLE 65 CEREALS & GRAINS: MARKET, BY REGION, 2023–2028 (USD MILLION)
                    TABLE 66 CEREALS & GRAINS: MARKET, BY REGION, 2019–2022 (KT)
                    TABLE 67 CEREALS & GRAINS: MARKET, BY REGION, 2023–2028 (KT)
           9.2.2 CORN
           9.2.3 WHEAT
           9.2.4 OTHER CEREALS & GRAINS
    9.3 OILSEEDS & PULSES 
           9.3.1 RISING DEMAND FOR EDIBLE OILS AND PROTEIN-RICH PULSES TO BOOST MARKET
                    TABLE 68 OILSEEDS & PULSES: MARKET, BY REGION, 2019–2022 (USD MILLION)
                    TABLE 69 OILSEEDS & PULSES: MARKET, BY REGION, 2023–2028 (USD MILLION)
                    TABLE 70 OILSEEDS & PULSES: MARKET, BY REGION, 2019–2022 (KT)
                    TABLE 71 OILSEEDS & PULSES: MARKET, BY REGION, 2023–2028 (KT)
    9.4 FRUITS & VEGETABLES 
           9.4.1 INCREASING GLOBAL CONSUMPTION OF FRUITS AND VEGETABLES TO ENCOURAGE MARKET GROWTH
                    TABLE 72 FRUITS & VEGETABLES: MARKET, BY REGION, 2019–2022 (USD MILLION)
                    TABLE 73 FRUITS & VEGETABLES: MARKET, BY REGION, 2023–2028 (USD MILLION)
                    TABLE 74 FRUITS & VEGETABLES: MARKET, BY REGION, 2019–2022 (KT)
                    TABLE 75 FRUITS & VEGETABLES: MARKET, BY REGION, 2023–2028 (KT)
    9.5 OTHER CROP TYPES 
           TABLE 76 OTHER CROP TYPES: MARKET, BY REGION, 2019–2022 (USD MILLION)
           TABLE 77 OTHER CROP TYPES: MARKET, BY REGION, 2023–2028 (USD MILLION)
           TABLE 78 OTHER CROP TYPES: MARKET, BY REGION, 2019–2022 (KT)
           TABLE 79 OTHER CROP TYPES: MARKET, BY REGION, 2023–2028 (KT)
 
10 AGRICULTURAL SURFACTANTS MARKET, BY SUBSTRATE TYPE (Page No. - 150)
     10.1 INTRODUCTION 
               FIGURE 36 SYNTHETIC SEGMENT TO LEAD MARKET DURING FORECAST PERIOD
               TABLE 80 MARKET, BY SUBSTRATE TYPE, 2019–2022 (USD MILLION)
               TABLE 81 MARKET, BY SUBSTRATE TYPE, 2023–2028 (USD MILLION)
               TABLE 82 MARKET, BY SUBSTRATE TYPE, 2019–2022 (KT)
               TABLE 83 MARKET, BY SUBSTRATE TYPE, 2023–2028 (KT)
     10.2 SYNTHETIC 
             10.2.1 INCREASING ADOPTION OF SYNTHETIC SURFACTANTS AS EMULSIFYING AGENTS IN PESTICIDES TO BOOST MARKET
                       TABLE 84 SYNTHETIC: MARKET, BY REGION, 2019–2022 (USD MILLION)
                       TABLE 85 SYNTHETIC: MARKET, BY REGION, 2023–2028 (USD MILLION)
                       TABLE 86 SYNTHETIC: MARKET, BY REGION, 2019–2022 (KT)
                       TABLE 87 SYNTHETIC: MARKET, BY REGION, 2023–2028 (KT)
     10.3 BIO-BASED 
             10.3.1 DEMAND FOR RENEWABLE BIOLOGICAL SUBSTRATES DUE TO RISING HEALTH CONCERNS TO PROPEL MARKET
                       TABLE 88 BIO-BASED: MARKET, BY REGION, 2019–2022 (USD MILLION)
                       TABLE 89 BIO-BASED: MARKET, BY REGION, 2023–2028 (USD MILLION)
                       TABLE 90 BIO-BASED: MARKET, BY REGION, 2019–2022 (KT)
                       TABLE 91 BIO-BASED: MARKET, BY REGION, 2023–2028 (KT)
 
11 MARKET, BY REGION (Page No. - 158)
     11.1 INTRODUCTION 
               FIGURE 37 REGIONS EMERGING AS NEW HOTSPOTS IN MARKET
               TABLE 92 AGRICULTURAL SURFACTANTS MARKET, BY REGION, 2019–2022 (USD MILLION)
               TABLE 93 MARKET, BY REGION, 2023–2028 (USD MILLION)
               TABLE 94 MARKET, BY REGION, 2019–2022 (KT)
               TABLE 95 MARKET, BY REGION, 2023–2028 (KT)
     11.2 NORTH AMERICA 
               FIGURE 38 NORTH AMERICA: MARKET SNAPSHOT
               TABLE 96 NORTH AMERICA: MARKET, BY COUNTRY, 2019–2022 (USD MILLION)
               TABLE 97 NORTH AMERICA: MARKET, BY COUNTRY, 2023–2028 (USD MILLION)
               TABLE 98 NORTH AMERICA: MARKET, BY COUNTRY, 2019–2022 (KT)
               TABLE 99 NORTH AMERICA: MARKET, BY COUNTRY, 2023–2028 (KT)
               TABLE 100 NORTH AMERICA: MARKET, BY TYPE, 2019–2022 (USD MILLION)
               TABLE 101 NORTH AMERICA: MARKET, BY TYPE, 2023–2028 (USD MILLION)
               TABLE 102 NORTH AMERICA: MARKET, BY TYPE, 2019–2022 (KT)
               TABLE 103 NORTH AMERICA: MARKET, BY TYPE, 2023–2028 (KT)
               TABLE 104 NORTH AMERICA: MARKET, BY CROP TYPE, 2019–2022 (USD MILLION)
               TABLE 105 NORTH AMERICA: MARKET, BY CROP TYPE, 2023–2028 (USD MILLION)
               TABLE 106 NORTH AMERICA: MARKET, BY CROP TYPE, 2019–2022 (KT)
               TABLE 107 NORTH AMERICA: MARKET, BY CROP TYPE, 2023–2028 (KT)
               TABLE 108 NORTH AMERICA: MARKET, BY APPLICATION, 2019–2022 (USD MILLION)
               TABLE 109 NORTH AMERICA: MARKET, BY APPLICATION, 2023–2028 (USD MILLION)
               TABLE 110 NORTH AMERICA: MARKET, BY APPLICATION, 2019–2022 (KT)
               TABLE 111 NORTH AMERICA: MARKET, BY APPLICATION, 2023–2028 (KT)
               TABLE 112 NORTH AMERICA: MARKET, BY SUBSTRATE TYPE, 2019–2022 (USD MILLION)
               TABLE 113 NORTH AMERICA: MARKET, BY SUBSTRATE TYPE, 2023–2028 (USD MILLION)
               TABLE 114 NORTH AMERICA: MARKET, BY SUBSTRATE TYPE, 2019–2022 (KT)
               TABLE 115 NORTH AMERICA: MARKET, BY SUBSTRATE TYPE, 2023–2028 (KT)
             11.2.1 US
                       11.2.1.1 Adoption of precision farming techniques to boost demand for agricultural surfactants
                                   TABLE 116 US: AGRICULTURAL SURFACTANTS MARKET, BY TYPE, 2019–2022 (USD MILLION)
                                   TABLE 117 US: MARKET, BY TYPE, 2023–2028 (USD MILLION)
                                   TABLE 118 US: MARKET, BY TYPE, 2019–2022 (KT)
                                   TABLE 119 US: MARKET, BY TYPE, 2023–2028 (KT)
                                   TABLE 120 US: MARKET, BY APPLICATION, 2019–2022 (USD MILLION)
                                   TABLE 121 US: MARKET, BY APPLICATION, 2023–2028 (USD MILLION)
                                   TABLE 122 US: MARKET, BY APPLICATION, 2019–2022 (KT)
                                   TABLE 123 US: MARKET, BY APPLICATION, 2023–2028 (KT)
                                   TABLE 124 US: MARKET, BY SUBSTRATE TYPE, 2019–2022 (USD MILLION)
                                   TABLE 125 US: MARKET, BY SUBSTRATE TYPE, 2023–2028 (USD MILLION)
                                   TABLE 126 US: MARKET, BY SUBSTRATE TYPE, 2019–2022 (KT)
                                   TABLE 127 US: MARKET, BY SUBSTRATE TYPE, 2023–2028 (KT)
             11.2.2 CANADA
                       11.2.2.1 Focus on organic farming to spur adoption of agricultural surfactants
                                   TABLE 128 CANADA: MARKET, BY TYPE, 2019–2022 (USD MILLION)
                                   TABLE 129 CANADA: MARKET, BY TYPE, 2023–2028 (USD MILLION)
                                   TABLE 130 CANADA: MARKET, BY TYPE, 2019–2022 (KT)
                                   TABLE 131 CANADA: MARKET, BY TYPE, 2023–2028 (KT)
                                   TABLE 132 CANADA: MARKET, BY APPLICATION, 2019–2022 (USD MILLION)
                                   TABLE 133 CANADA: MARKET, BY APPLICATION, 2023–2028 (USD MILLION)
                                   TABLE 134 CANADA: MARKET, BY APPLICATION, 2019–2022 (KT)
                                   TABLE 135 CANADA: MARKET, BY APPLICATION, 2023–2028 (KT)
                                   TABLE 136 CANADA: MARKET, BY SUBSTRATE TYPE, 2019–2022 (USD MILLION)
                                   TABLE 137 CANADA: MARKET, BY SUBSTRATE TYPE, 2023–2028 (USD MILLION)
                                   TABLE 138 CANADA: MARKET, BY SUBSTRATE TYPE, 2019–2022 (KT)
                                   TABLE 139 CANADA: MARKET, BY SUBSTRATE TYPE, 2023–2028 (KT)
             11.2.3 MEXICO
                       11.2.3.1 Demand for sustainable farming solutions to drive market
                                   TABLE 140 MEXICO: MARKET, BY TYPE, 2019–2022 (USD MILLION)
                                   TABLE 141 MEXICO: MARKET, BY TYPE, 2023–2028 (USD MILLION)
                                   TABLE 142 MEXICO: AGRICULTURAL SURFACTANTS MARKET, BY TYPE, 2019–2022 (KT)
                                   TABLE 143 MEXICO: MARKET, BY TYPE, 2023–2028 (KT)
                                   TABLE 144 MEXICO: MARKET, BY APPLICATION, 2019–2022 (USD MILLION)
                                   TABLE 145 MEXICO: MARKET, BY APPLICATION, 2023–2028 (USD MILLION)
                                   TABLE 146 MEXICO: MARKET, BY APPLICATION, 2019–2022 (KT)
                                   TABLE 147 MEXICO: MARKET, BY APPLICATION, 2023–2028 (KT)
                                   TABLE 148 MEXICO: MARKET, BY SUBSTRATE TYPE, 2019–2022 (USD MILLION)
                                   TABLE 149 MEXICO: MARKET, BY SUBSTRATE TYPE, 2023–2028 (USD MILLION)
                                   TABLE 150 MEXICO: MARKET, BY SUBSTRATE TYPE, 2019–2022 (KT)
                                   TABLE 151 MEXICO: MARKET, BY SUBSTRATE TYPE, 2023–2028 (KT)
     11.3 EUROPE 
               TABLE 152 EUROPE: MARKET, BY COUNTRY, 2019–2022 (USD MILLION)
               TABLE 153 EUROPE: MARKET, BY COUNTRY, 2023–2028 (USD MILLION)
               TABLE 154 EUROPE: MARKET, BY COUNTRY, 2019–2022 (KT)
               TABLE 155 EUROPE: MARKET, BY COUNTRY, 2023–2028 (KT)
               TABLE 156 EUROPE: MARKET, BY TYPE, 2019–2022 (USD MILLION)
               TABLE 157 EUROPE: MARKET, BY TYPE, 2023–2028 (USD MILLION)
               TABLE 158 EUROPE: MARKET, BY TYPE, 2019–2022 (KT)
               TABLE 159 EUROPE: MARKET, BY TYPE, 2023–2028 (KT)
               TABLE 160 EUROPE: MARKET, BY CROP TYPE, 2019–2022 (USD MILLION)
               TABLE 161 EUROPE: MARKET, BY CROP TYPE, 2023–2028 (USD MILLION)
               TABLE 162 EUROPE: MARKET, BY CROP TYPE, 2019–2022 (KT)
               TABLE 163 EUROPE: MARKET, BY CROP TYPE, 2023–2028 (KT)
               TABLE 164 EUROPE: MARKET, BY APPLICATION, 2019–2022 (USD MILLION)
               TABLE 165 EUROPE: MARKET, BY APPLICATION, 2023–2028 (USD MILLION)
               TABLE 166 EUROPE: MARKET, BY APPLICATION, 2019–2022 (KT)
               TABLE 167 EUROPE: MARKET, BY APPLICATION, 2023–2028 (KT)
               TABLE 168 EUROPE: MARKET, BY SUBSTRATE TYPE, 2019–2022 (USD MILLION)
               TABLE 169 EUROPE: MARKET, BY SUBSTRATE TYPE, 2023–2028 (USD MILLION)
               TABLE 170 EUROPE: MARKET, BY SUBSTRATE TYPE, 2019–2022 (KT)
               TABLE 171 EUROPE: MARKET, BY SUBSTRATE TYPE, 2023–2028 (KT)
             11.3.1 GERMANY
                       11.3.1.1 Demand for solutions that amplify pesticide efficacy to drive market
                                   TABLE 172 GERMANY: MARKET, BY TYPE, 2019–2022 (USD MILLION)
                                   TABLE 173 GERMANY: MARKET, BY TYPE, 2023–2028 (USD MILLION)
                                   TABLE 174 GERMANY: MARKET, BY TYPE, 2019–2022 (KT)
                                   TABLE 175 GERMANY: MARKET, BY TYPE, 2023–2028 (KT)
                                   TABLE 176 GERMANY: MARKET, BY APPLICATION, 2019–2022 (USD MILLION)
                                   TABLE 177 GERMANY: MARKET, BY APPLICATION, 2023–2028 (USD MILLION)
                                   TABLE 178 GERMANY: MARKET, BY APPLICATION, 2019–2022 (KT)
                                   TABLE 179 GERMANY: MARKET, BY APPLICATION, 2023–2028 (KT)
                                   TABLE 180 GERMANY: MARKET, BY SUBSTRATE TYPE, 2019–2022 (USD MILLION)
                                   TABLE 181 GERMANY: MARKET, BY SUBSTRATE TYPE, 2023–2028 (USD MILLION)
                                   TABLE 182 GERMANY: MARKET, BY SUBSTRATE TYPE, 2019–2022 (KT)
                                   TABLE 183 GERMANY: MARKET, BY SUBSTRATE TYPE, 2023–2028 (KT)
             11.3.2 FRANCE
                       11.3.2.1 Growing focus on crop protection to boost market
                                   TABLE 184 FRANCE: MARKET, BY TYPE, 2019–2022 (USD MILLION)
                                   TABLE 185 FRANCE: MARKET, BY TYPE, 2023–2028 (USD MILLION)
                                   TABLE 186 FRANCE: AGRICULTURAL SURFACTANTS MARKET, BY TYPE, 2019–2022 (KT)
                                   TABLE 187 FRANCE: MARKET, BY TYPE, 2023–2028 (KT)
                                   TABLE 188 FRANCE: MARKET, BY APPLICATION, 2019–2022 (USD MILLION)
                                   TABLE 189 FRANCE: MARKET, BY APPLICATION, 2023–2028 (USD MILLION)
                                   TABLE 190 FRANCE: MARKET, BY APPLICATION, 2019–2022 (KT)
                                   TABLE 191 FRANCE: MARKET, BY APPLICATION, 2023–2028 (KT)
                                   TABLE 192 FRANCE: MARKET, BY SUBSTRATE TYPE, 2019–2022 (USD MILLION)
                                   TABLE 193 FRANCE: MARKET, BY SUBSTRATE TYPE, 2023–2028 (USD MILLION)
                                   TABLE 194 FRANCE: MARKET, BY SUBSTRATE TYPE, 2019–2022 (KT)
                                   TABLE 195 FRANCE: MARKET, BY SUBSTRATE TYPE, 2023–2028 (KT)
             11.3.3 UK
                       11.3.3.1 Demand for sustainable agricultural solutions to boost popularity of agricultural surfactants
                                   TABLE 196 UK: MARKET, BY TYPE, 2019–2022 (USD MILLION)
                                   TABLE 197 UK: MARKET, BY TYPE, 2023–2028 (USD MILLION)
                                   TABLE 198 UK: MARKET, BY TYPE, 2019–2022 (KT)
                                   TABLE 199 UK: MARKET, BY TYPE, 2023–2028 (KT)
                                   TABLE 200 UK: MARKET, BY APPLICATION, 2019–2022 (USD MILLION)
                                   TABLE 201 UK: MARKET, BY APPLICATION, 2023–2028 (USD MILLION)
                                   TABLE 202 UK: MARKET, BY APPLICATION, 2019–2022 (KT)
                                   TABLE 203 UK: MARKET, BY APPLICATION, 2023–2028 (KT)
                                   TABLE 204 UK: MARKET, BY SUBSTRATE TYPE, 2019–2022 (USD MILLION)
                                   TABLE 205 UK: MARKET, BY SUBSTRATE TYPE, 2023–2028 (USD MILLION)
                                   TABLE 206 UK: MARKET, BY SUBSTRATE TYPE, 2019–2022 (KT)
                                   TABLE 207 UK: MARKET, BY SUBSTRATE TYPE, 2023–2028 (KT)
             11.3.4 ITALY
                       11.3.4.1 Rising adoption of integrated pest management solutions to fuel market
                                   TABLE 208 ITALY: MARKET, BY TYPE, 2019–2022 (USD MILLION)
                                   TABLE 209 ITALY: MARKET, BY TYPE, 2023–2028 (USD MILLION)
                                   TABLE 210 ITALY: MARKET, BY TYPE, 2019–2022 (KT)
                                   TABLE 211 ITALY: MARKET, BY TYPE, 2023–2028 (KT)
                                   TABLE 212 ITALY: MARKET, BY APPLICATION, 2019–2022 (USD MILLION)
                                   TABLE 213 ITALY: MARKET, BY APPLICATION, 2023–2028 (USD MILLION)
                                   TABLE 214 ITALY: MARKET, BY APPLICATION, 2019–2022 (KT)
                                   TABLE 215 ITALY: MARKET, BY APPLICATION, 2023–2028 (KT)
                                   TABLE 216 ITALY: MARKET, BY SUBSTRATE TYPE, 2019–2022 (USD MILLION)
                                   TABLE 217 ITALY: MARKET, BY SUBSTRATE TYPE, 2023–2028 (USD MILLION)
                                   TABLE 218 ITALY: MARKET, BY SUBSTRATE TYPE, 2019–2022 (KT)
                                   TABLE 219 ITALY: MARKET, BY SUBSTRATE TYPE, 2023–2028 (KT)
             11.3.5 SPAIN
                       11.3.5.1 Popularity of sustainable farming practices to amplify demand for agricultural surfactants
                                   TABLE 220 SPAIN: MARKET, BY TYPE, 2019–2022 (USD MILLION)
                                   TABLE 221 SPAIN: MARKET, BY TYPE, 2023–2028 (USD MILLION)
                                   TABLE 222 SPAIN: MARKET, BY TYPE, 2019–2022 (KT)
                                   TABLE 223 SPAIN: MARKET, BY TYPE, 2023–2028 (KT)
                                   TABLE 224 SPAIN: MARKET, BY APPLICATION, 2019–2022 (USD MILLION)
                                   TABLE 225 SPAIN: MARKET, BY APPLICATION, 2023–2028 (USD MILLION)
                                   TABLE 226 SPAIN: AGRICULTURAL SURFACTANTS MARKET, BY APPLICATION, 2019–2022 (KT)
                                   TABLE 227 SPAIN: MARKET, BY APPLICATION, 2023–2028 (KT)
                                   TABLE 228 SPAIN: MARKET, BY SUBSTRATE TYPE, 2019–2022 (USD MILLION)
                                   TABLE 229 SPAIN: MARKET, BY SUBSTRATE TYPE, 2023–2028 (USD MILLION)
                                   TABLE 230 SPAIN: MARKET, BY SUBSTRATE TYPE, 2019–2022 (KT)
                                   TABLE 231 SPAIN: MARKET, BY SUBSTRATE TYPE, 2023–2028 (KT)
             11.3.6 REST OF EUROPE
                       TABLE 232 REST OF EUROPE: MARKET, BY TYPE, 2019–2022 (USD MILLION)
                       TABLE 233 REST OF EUROPE: MARKET, BY TYPE, 2023–2028 (USD MILLION)
                       TABLE 234 REST OF EUROPE: MARKET, BY TYPE, 2019–2022 (KT)
                       TABLE 235 REST OF EUROPE: MARKET, BY TYPE, 2023–2028 (KT)
                       TABLE 236 REST OF EUROPE: MARKET, BY APPLICATION, 2019–2022 (USD MILLION)
                       TABLE 237 REST OF EUROPE: MARKET, BY APPLICATION, 2023–2028 (USD MILLION)
                       TABLE 238 REST OF EUROPE: MARKET, BY APPLICATION, 2019–2022 (KT)
                       TABLE 239 REST OF EUROPE: MARKET, BY APPLICATION, 2023–2028 (KT)
                       TABLE 240 REST OF EUROPE: MARKET, BY SUBSTRATE TYPE, 2019–2022 (USD MILLION)
                       TABLE 241 REST OF EUROPE: MARKET, BY SUBSTRATE TYPE, 2023–2028 (USD MILLION)
                       TABLE 242 REST OF EUROPE: MARKET, BY SUBSTRATE TYPE, 2019–2022 (KT)
                       TABLE 243 REST OF EUROPE: MARKET, BY SUBSTRATE TYPE, 2023–2028 (KT)
     11.4 ASIA PACIFIC 
               TABLE 244 KEY CROPS CULTIVATED, BY COUNTRY
               TABLE 245 ASIA PACIFIC: MARKET, BY COUNTRY, 2019–2022 (USD MILLION)
               TABLE 246 ASIA PACIFIC: MARKET, BY COUNTRY, 2023–2028 (USD MILLION)
               TABLE 247 ASIA PACIFIC: MARKET, BY COUNTRY, 2019–2022 (KT)
               TABLE 248 ASIA PACIFIC: MARKET, BY COUNTRY, 2023–2028 (KT)
               TABLE 249 ASIA PACIFIC: MARKET, BY TYPE, 2019–2022 (USD MILLION)
               TABLE 250 ASIA PACIFIC: MARKET, BY TYPE, 2023–2028 (USD MILLION)
               TABLE 251 ASIA PACIFIC: MARKET, BY TYPE, 2019–2022 (KT)
               TABLE 252 ASIA PACIFIC: MARKET, BY TYPE, 2023–2028 (KT)
               TABLE 253 ASIA PACIFIC: MARKET, BY CROP TYPE, 2019–2022 (USD MILLION)
               TABLE 254 ASIA PACIFIC: MARKET, BY CROP TYPE, 2023–2028 (USD MILLION)
               TABLE 255 ASIA PACIFIC: MARKET, BY CROP TYPE, 2019–2022 (KT)
               TABLE 256 ASIA PACIFIC: MARKET, BY CROP TYPE, 2023–2028 (KT)
               TABLE 257 ASIA PACIFIC: MARKET, BY APPLICATION, 2019–2022 (USD MILLION)
               TABLE 258 ASIA PACIFIC: MARKET, BY APPLICATION, 2023–2028 (USD MILLION)
               TABLE 259 ASIA PACIFIC: MARKET, BY APPLICATION, 2019–2022 (KT)
               TABLE 260 ASIA PACIFIC: MARKET, BY APPLICATION, 2023–2028 (KT)
               TABLE 261 ASIA PACIFIC: MARKET, BY SUBSTRATE TYPE, 2019–2022 (USD MILLION)
               TABLE 262 ASIA PACIFIC: MARKET, BY SUBSTRATE TYPE, 2023–2028 (USD MILLION)
               TABLE 263 ASIA PACIFIC: MARKET, BY SUBSTRATE TYPE, 2019–2022 (KT)
               TABLE 264 ASIA PACIFIC: MARKET, BY SUBSTRATE TYPE, 2023–2028 (KT)
             11.4.1 CHINA
                       11.4.1.1 Rapid modernization of agriculture to drive market expansion
                                   TABLE 265 CHINA: MARKET, BY TYPE, 2019–2022 (USD MILLION)
                                   TABLE 266 CHINA: MARKET, BY TYPE, 2023–2028 (USD MILLION)
                                   TABLE 267 CHINA: MARKET, BY TYPE, 2019–2022 (KT)
                                   TABLE 268 CHINA: MARKET, BY TYPE, 2023–2028 (KT)
                                   TABLE 269 CHINA: MARKET, BY APPLICATION, 2019–2022 (USD MILLION)
                                   TABLE 270 CHINA: MARKET, BY APPLICATION, 2023–2028 (USD MILLION)
                                   TABLE 271 CHINA: AGRICULTURAL SURFACTANTS MARKET, BY APPLICATION, 2019–2022 (KT)
                                   TABLE 272 CHINA: MARKET, BY APPLICATION, 2023–2028 (KT)
                                   TABLE 273 CHINA: MARKET, BY SUBSTRATE TYPE, 2019–2022 (USD MILLION)
                                   TABLE 274 CHINA: MARKET, BY SUBSTRATE TYPE, 2023–2028 (USD MILLION)
                                   TABLE 275 CHINA: MARKET, BY SUBSTRATE TYPE, 2019–2022 (KT)
                                   TABLE 276 CHINA: MARKET, BY SUBSTRATE TYPE, 2023–2028 (KT)
             11.4.2 INDIA
                       11.4.2.1 Focus on large-scale farming practices to boost market growth
                                   TABLE 277 INDIA: MARKET, BY TYPE, 2019–2022 (USD MILLION)
                                   TABLE 278 INDIA: MARKET, BY TYPE, 2023–2028 (USD MILLION)
                                   TABLE 279 INDIA: MARKET, BY TYPE, 2019–2022 (KT)
                                   TABLE 280 INDIA: MARKET, BY TYPE, 2023–2028 (KT)
                                   TABLE 281 INDIA: MARKET, BY APPLICATION, 2019–2022 (USD MILLION)
                                   TABLE 282 INDIA: MARKET, BY APPLICATION, 2023–2028 (USD MILLION)
                                   TABLE 283 INDIA: MARKET, BY APPLICATION, 2019–2022 (KT)
                                   TABLE 284 INDIA: MARKET, BY APPLICATION, 2023–2028 (KT)
                                   TABLE 285 INDIA: MARKET, BY SUBSTRATE TYPE, 2019–2022 (USD MILLION)
                                   TABLE 286 INDIA: MARKET, BY SUBSTRATE TYPE, 2023–2028 (USD MILLION)
                                   TABLE 287 INDIA: MARKET, BY SUBSTRATE TYPE, 2019–2022 (KT)
                                   TABLE 288 INDIA: MARKET, BY SUBSTRATE TYPE, 2023–2028 (KT)
             11.4.3 JAPAN
                       11.4.3.1 Technological innovations in agriculture to fuel adoption of agricultural surfactants
                                   TABLE 289 JAPAN: MARKET, BY TYPE, 2019–2022 (USD MILLION)
                                   TABLE 290 JAPAN: MARKET, BY TYPE, 2023–2028 (USD MILLION)
                                   TABLE 291 JAPAN: MARKET, BY TYPE, 2019–2022 (KT)
                                   TABLE 292 JAPAN: MARKET, BY TYPE, 2023–2028 (KT)
                                   TABLE 293 JAPAN: MARKET, BY APPLICATION, 2019–2022 (USD MILLION)
                                   TABLE 294 JAPAN: MARKET, BY APPLICATION, 2023–2028 (USD MILLION)
                                   TABLE 295 JAPAN: MARKET, BY APPLICATION, 2019–2022 (KT)
                                   TABLE 296 JAPAN: MARKET, BY APPLICATION, 2023–2028 (KT)
                                   TABLE 297 JAPAN: MARKET, BY SUBSTRATE TYPE, 2019–2022 (USD MILLION)
                                   TABLE 298 JAPAN: MARKET, BY SUBSTRATE TYPE, 2023–2028 (USD MILLION)
                                   TABLE 299 JAPAN: MARKET, BY SUBSTRATE TYPE, 2019–2022 (KT)
                                   TABLE 300 JAPAN: MARKET, BY SUBSTRATE TYPE, 2023–2028 (KT)
                                   11.4.4 AUSTRALIA & NEW ZEALAND
                     11.4.4.1 Demand for agrochemical efficacy to encourage market growth
                                   TABLE 301 AUSTRALIA & NEW ZEALAND: MARKET, BY TYPE, 2019–2022 (USD MILLION)
                                   TABLE 302 AUSTRALIA & NEW ZEALAND: MARKET, BY TYPE, 2023–2028 (USD MILLION)
                                   TABLE 303 AUSTRALIA & NEW ZEALAND: MARKET, BY TYPE, 2019–2022 (KT)
                                   TABLE 304 AUSTRALIA & NEW ZEALAND: MARKET, BY TYPE, 2023–2028 (KT)
                                   TABLE 305 AUSTRALIA & NEW ZEALAND: AGRICULTURAL SURFACTANTS MARKET, BY APPLICATION, 2019–2022 (USD MILLION)
                                   TABLE 306 AUSTRALIA & NEW ZEALAND: MARKET, BY APPLICATION, 2023–2028 (USD MILLION)
                                   TABLE 307 AUSTRALIA & NEW ZEALAND: MARKET, BY APPLICATION, 2019–2022 (KT)
                                   TABLE 308 AUSTRALIA & NEW ZEALAND: MARKET, BY APPLICATION, 2023–2028 (KT)
                                   TABLE 309 AUSTRALIA & NEW ZEALAND: MARKET, BY SUBSTRATE TYPE, 2019–2022 (USD MILLION)
                                   TABLE 310 AUSTRALIA & NEW ZEALAND: MARKET, BY SUBSTRATE TYPE, 2023–2028 (USD MILLION)
                                   TABLE 311 AUSTRALIA & NEW ZEALAND: MARKET, BY SUBSTRATE TYPE, 2019–2022 (KT)
                                   TABLE 312 AUSTRALIA & NEW ZEALAND: MARKET, BY SUBSTRATE TYPE, 2023–2028 (KT)
                     11.4.5 REST OF ASIA PACIFIC
                                   TABLE 313 REST OF ASIA PACIFIC: MARKET, BY TYPE, 2019–2022 (USD MILLION)
                                   TABLE 314 REST OF ASIA PACIFIC: MARKET, BY TYPE, 2023–2028 (USD MILLION)
                                   TABLE 315 REST OF ASIA PACIFIC: MARKET, BY TYPE, 2019–2022 (KT)
                                   TABLE 316 REST OF ASIA PACIFIC: MARKET, BY TYPE, 2023–2028 (KT)
                                   TABLE 317 REST OF ASIA PACIFIC: MARKET, BY APPLICATION, 2019–2022 (USD MILLION)
                                   TABLE 318 REST OF ASIA PACIFIC: MARKET, BY APPLICATION, 2023–2028 (USD MILLION)
                                   TABLE 319 REST OF ASIA PACIFIC: MARKET, BY APPLICATION, 2019–2022 (KT)
                                   TABLE 320 REST OF ASIA PACIFIC: MARKET, BY APPLICATION, 2023–2028 (KT)
                                   TABLE 321 REST OF ASIA PACIFIC: MARKET, BY SUBSTRATE TYPE, 2019–2022 (USD MILLION)
                                   TABLE 322 REST OF ASIA PACIFIC: MARKET, BY SUBSTRATE TYPE, 2023–2028 (USD MILLION)
                                   TABLE 323 REST OF ASIA PACIFIC: MARKET, BY SUBSTRATE TYPE, 2019–2022 (KT)
                                   TABLE 324 REST OF ASIA PACIFIC: MARKET, BY SUBSTRATE TYPE, 2023–2028 (KT)
     11.5 SOUTH AMERICA 
               TABLE 325 SOUTH AMERICA: MARKET, BY COUNTRY, 2019–2022 (USD MILLION)
               TABLE 326 SOUTH AMERICA: MARKET, BY COUNTRY, 2023–2028 (USD MILLION)
               TABLE 327 SOUTH AMERICA: MARKET, BY COUNTRY, 2019–2022 (KT)
               TABLE 328 SOUTH AMERICA: MARKET, BY COUNTRY, 2023–2028 (KT)
               TABLE 329 SOUTH AMERICA: MARKET, BY TYPE, 2019–2022 (USD MILLION)
               TABLE 330 SOUTH AMERICA: MARKET, BY TYPE, 2023–2028 (USD MILLION)
               TABLE 331 SOUTH AMERICA: MARKET, BY TYPE, 2019–2022 (KT)
               TABLE 332 SOUTH AMERICA: MARKET, BY TYPE, 2023–2028 (KT)
               TABLE 333 SOUTH AMERICA: MARKET, BY CROP TYPE, 2019–2022 (USD MILLION)
               TABLE 334 SOUTH AMERICA: MARKET, BY CROP TYPE, 2023–2028 (USD MILLION)
               TABLE 335 SOUTH AMERICA: MARKET, BY CROP TYPE, 2019–2022 (KT)
               TABLE 336 SOUTH AMERICA: MARKET, BY CROP TYPE, 2023–2028 (KT)
               TABLE 337 SOUTH AMERICA: MARKET, BY APPLICATION, 2019–2022 (USD MILLION)
               TABLE 338 SOUTH AMERICA: MARKET, BY APPLICATION, 2023–2028 (USD MILLION)
               TABLE 339 SOUTH AMERICA: MARKET, BY APPLICATION, 2019–2022 (KT)
               TABLE 340 SOUTH AMERICA: MARKET, BY APPLICATION, 2023–2028 (KT)
               TABLE 341 SOUTH AMERICA: MARKET, BY SUBSTRATE TYPE, 2019–2022 (USD MILLION)
               TABLE 342 SOUTH AMERICA: AGRICULTURAL SURFACTANTS MARKET, BY SUBSTRATE TYPE, 2023–2028 (USD MILLION)
               TABLE 343 SOUTH AMERICA: MARKET, BY SUBSTRATE TYPE, 2019–2022 (KT)
               TABLE 344 SOUTH AMERICA: MARKET, BY SUBSTRATE TYPE, 2023–2028 (KT)
             11.5.1 BRAZIL
                       11.5.1.1 Strong commercial appeal for crop benefits to propel market growth
                                   TABLE 345 BRAZIL: MARKET, BY TYPE, 2019–2022 (USD MILLION)
                                   TABLE 346 BRAZIL: MARKET, BY TYPE, 2023–2028 (USD MILLION)
                                   TABLE 347 BRAZIL: MARKET, BY TYPE, 2019–2022 (KT)
                                   TABLE 348 BRAZIL: MARKET, BY TYPE, 2023–2028 (KT)
                                   TABLE 349 BRAZIL: MARKET, BY APPLICATION, 2019–2022 (USD MILLION)
                                   TABLE 350 BRAZIL: MARKET, BY APPLICATION, 2023–2028 (USD MILLION)
                                   TABLE 351 BRAZIL: MARKET, BY APPLICATION, 2019–2022 (KT)
                                   TABLE 352 BRAZIL: MARKET, BY APPLICATION, 2023–2028 (KT)
                                   TABLE 353 BRAZIL: MARKET, BY SUBSTRATE TYPE, 2019–2022 (USD MILLION)
                                   TABLE 354 BRAZIL: MARKET, BY SUBSTRATE TYPE, 2023–2028 (USD MILLION)
                                   TABLE 355 BRAZIL: MARKET, BY SUBSTRATE TYPE, 2019–2022 (KT)
                                   TABLE 356 BRAZIL: MARKET, BY SUBSTRATE TYPE, 2023–2028 (KT)
             11.5.2 ARGENTINA
                       11.5.2.1 Rising need to optimize pesticide efficacy to boost growth
                                   TABLE 357 ARGENTINA: MARKET, BY TYPE, 2019–2022 (USD MILLION)
                                   TABLE 358 ARGENTINA: MARKET, BY TYPE, 2023–2028 (USD MILLION)
                                   TABLE 359 ARGENTINA: MARKET, BY TYPE, 2019–2022 (KT)
                                   TABLE 360 ARGENTINA: MARKET, BY TYPE, 2023–2028 (KT)
                                   TABLE 361 ARGENTINA: MARKET, BY APPLICATION, 2019–2022 (USD MILLION)
                                   TABLE 362 ARGENTINA: MARKET, BY APPLICATION, 2023–2028 (USD MILLION)
                                   TABLE 363 ARGENTINA: MARKET, BY APPLICATION, 2019–2022 (KT)
                                   TABLE 364 ARGENTINA: MARKET, BY APPLICATION, 2023–2028 (KT)
                                   TABLE 365 ARGENTINA: MARKET, BY SUBSTRATE TYPE, 2019–2022 (USD MILLION)
                                   TABLE 366 ARGENTINA: MARKET, BY SUBSTRATE TYPE, 2023–2028 (USD MILLION)
                                   TABLE 367 ARGENTINA: MARKET, BY SUBSTRATE TYPE, 2019–2022 (KT)
                                   TABLE 368 ARGENTINA: MARKET, BY SUBSTRATE TYPE, 2023–2028 (KT)
             11.5.3 REST OF SOUTH AMERICA
                       TABLE 369 REST OF SOUTH AMERICA: MARKET, BY TYPE, 2019–2022 (USD MILLION)
                       TABLE 370 REST OF SOUTH AMERICA: MARKET, BY TYPE, 2023–2028 (USD MILLION)
                       TABLE 371 REST OF SOUTH AMERICA: MARKET, BY TYPE, 2019–2022 (KT)
                       TABLE 372 REST OF SOUTH AMERICA: MARKET, BY TYPE, 2023–2028 (KT)
                       TABLE 373 REST OF SOUTH AMERICA: MARKET, BY APPLICATION, 2019–2022 (USD MILLION)
                       TABLE 374 REST OF SOUTH AMERICA: AGRICULTURAL SURFACTANTS MARKET, BY APPLICATION, 2023–2028 (USD MILLION)
                       TABLE 375 REST OF SOUTH AMERICA: MARKET, BY APPLICATION, 2019–2022 (KT)
                       TABLE 376 REST OF SOUTH AMERICA: MARKET, BY APPLICATION, 2023–2028 (KT)
                       TABLE 377 REST OF SOUTH AMERICA: MARKET, BY SUBSTRATE TYPE, 2019–2022 (USD MILLION)
                       TABLE 378 REST OF SOUTH AMERICA: MARKET, BY SUBSTRATE TYPE, 2023–2028 (USD MILLION)
                       TABLE 379 REST OF SOUTH AMERICA: MARKET, BY SUBSTRATE TYPE, 2019–2022 (KT)
                       TABLE 380 REST OF SOUTH AMERICA: MARKET, BY SUBSTRATE TYPE, 2023–2028 (KT)
     11.6 REST OF THE WORLD 
               TABLE 381 ROW: MARKET, BY COUNTRY, 2019–2022 (USD MILLION)
               TABLE 382 ROW: MARKET, BY COUNTRY, 2023–2028 (USD MILLION)
               TABLE 383 ROW: MARKET, BY COUNTRY, 2019–2022 (KT)
               TABLE 384 ROW: MARKET, BY COUNTRY, 2023–2028 (KT)
               TABLE 385 ROW: MARKET, BY TYPE, 2019–2022 (USD MILLION)
               TABLE 386 ROW: MARKET, BY TYPE, 2023–2028 (USD MILLION)
               TABLE 387 ROW: MARKET, BY TYPE, 2019–2022 (KT)
               TABLE 388 ROW: MARKET, BY TYPE, 2023–2028 (KT)
               TABLE 389 ROW: MARKET, BY CROP TYPE, 2019–2022 (USD MILLION)
               TABLE 390 ROW: MARKET, BY CROP TYPE, 2023–2028 (USD MILLION)
               TABLE 391 ROW: MARKET, BY CROP TYPE, 2019–2022 (KT)
               TABLE 392 ROW: MARKET, BY CROP TYPE, 2023–2028 (KT)
               TABLE 393 ROW: AGRICULTURAL SURFACTANTS MARKET, BY APPLICATION, 2019–2022 (USD MILLION)
               TABLE 394 ROW: MARKET, BY APPLICATION, 2023–2028 (USD MILLION)
               TABLE 395 ROW: MARKET, BY APPLICATION, 2019–2022 (KT)
               TABLE 396 ROW: MARKET, BY APPLICATION, 2023–2028 (KT)
               TABLE 397 ROW: MARKET, BY SUBSTRATE TYPE, 2019–2022 (USD MILLION)
               TABLE 398 ROW: MARKET, BY SUBSTRATE TYPE, 2023–2028 (USD MILLION)
               TABLE 399 ROW: MARKET, BY SUBSTRATE TYPE, 2019–2022 (KT)
               TABLE 400 ROW: MARKET, BY SUBSTRATE TYPE, 2023–2028 (KT)
             11.6.1 AFRICA
                       11.6.1.1 Focus on food security to accelerate demand for agricultural surfactants
                                   TABLE 401 AFRICA: MARKET, BY TYPE, 2019–2022 (USD MILLION)
                                   TABLE 402 AFRICA: MARKET, BY TYPE, 2023–2028 (USD MILLION)
                                   TABLE 403 AFRICA: MARKET, BY TYPE, 2019–2022 (KT)
                                   TABLE 404 AFRICA: MARKET, BY TYPE, 2023–2028 (KT)
                                   TABLE 405 AFRICA: MARKET, BY APPLICATION, 2019–2022 (USD MILLION)
                                   TABLE 406 AFRICA: MARKET, BY APPLICATION, 2023–2028 (USD MILLION)
                                   TABLE 407 AFRICA: MARKET, BY APPLICATION, 2019–2022 (KT)
                                   TABLE 408 AFRICA: MARKET, BY APPLICATION, 2023–2028 (KT)
                                   TABLE 409 AFRICA: MARKET, BY SUBSTRATE TYPE, 2019–2022 (USD MILLION)
                                   TABLE 410 AFRICA: MARKET, BY SUBSTRATE TYPE, 2023–2028 (USD MILLION)
                                   TABLE 411 AFRICA: MARKET, BY SUBSTRATE TYPE, 2019–2022 (KT)
                                   TABLE 412 AFRICA: MARKET, BY SUBSTRATE TYPE, 2023–2028 (KT)
             11.6.2 MIDDLE EAST
                       11.6.2.1 Growing emphasis on desert agricultural practices to amplify demand for agricultural surfactants
                                   TABLE 413 MIDDLE EAST: MARKET, BY TYPE, 2019–2022 (USD MILLION)
                                   TABLE 414 MIDDLE EAST: MARKET, BY TYPE, 2023–2028 (USD MILLION)
                                   TABLE 415 MIDDLE EAST: MARKET, BY TYPE, 2019–2022 (KT)
                                   TABLE 416 MIDDLE EAST: MARKET, BY TYPE, 2023–2028 (KT)
                                   TABLE 417 MIDDLE EAST: MARKET, BY APPLICATION, 2019–2022 (USD MILLION)
                                   TABLE 418 MIDDLE EAST: MARKET, BY APPLICATION, 2023–2028 (USD MILLION)
                                   TABLE 419 MIDDLE EAST: MARKET, BY APPLICATION, 2019–2022 (KT)
                                   TABLE 420 MIDDLE EAST: MARKET, BY APPLICATION, 2023–2028 (KT)
                                   TABLE 421 MIDDLE EAST: MARKET, BY SUBSTRATE TYPE, 2019–2022 (USD MILLION)
                                   TABLE 422 MIDDLE EAST: MARKET, BY SUBSTRATE TYPE, 2023–2028 (USD MILLION)
                                   TABLE 423 MIDDLE EAST: MARKET, BY SUBSTRATE TYPE, 2019–2022 (KT)
                                   TABLE 424 MIDDLE EAST: AGRICULTURAL SURFACTANTS MARKET, BY SUBSTRATE TYPE, 2023–2028 (KT)
 
12 COMPETITIVE LANDSCAPE (Page No. - 274)
     12.1 OVERVIEW 
     12.2 STRATEGIES ADOPTED BY KEY PLAYERS 
               TABLE 425 STRATEGIES ADOPTED BY KEY PLAYERS
     12.3 HISTORICAL REVENUE ANALYSIS FOR KEY PLAYERS 
               FIGURE 39 HISTORICAL REVENUE ANALYSIS FOR KEY PLAYERS, 2020–2022 (USD BILLION)
     12.4 MARKET SHARE ANALYSIS FOR KEY PLAYERS 
               TABLE 426 MARKET SHARE ANALYSIS FOR KEY PLAYERS, 2022
     12.5 COMPANY EVALUATION MATRIX FOR KEY PLAYERS 
             12.5.1 STARS
             12.5.2 EMERGING LEADERS
             12.5.3 PARTICIPANTS
             12.5.4 PERVASIVE PLAYERS
                       FIGURE 40 COMPANY EVALUATION MATRIX FOR KEY PLAYERS, 2022
             12.5.5 COMPETITIVE BENCHMARKING
                       TABLE 427 COMPANY FOOTPRINT, BY TYPE
                       TABLE 428 COMPANY FOOTPRINT, BY APPLICATION
                       TABLE 429 COMPANY FOOTPRINT, BY REGION
     12.6 COMPANY EVALUATION MATRIX FOR STARTUPS/SMES 
             12.6.1 PROGRESSIVE COMPANIES
             12.6.2 STARTING BLOCKS
             12.6.3 RESPONSIVE COMPANIES
             12.6.4 DYNAMIC COMPANIES
                       FIGURE 41 COMPANY EVALUATION MATRIX FOR STARTUPS/SMES, 2022
             12.6.5 COMPETITIVE BENCHMARKING
                       TABLE 430 LIST OF KEY STARTUPS/SMES
                       TABLE 431 COMPETITIVE BENCHMARKING (BY TYPE, APPLICATION, AND REGION)
     12.7 COMPETITIVE SCENARIO 
             12.7.1 PRODUCT LAUNCHES
                       TABLE 432 AGRICULTURAL SURFACTANTS MARKET: PRODUCT LAUNCHES, 2021–2022
                       TABLE 433 MARKET: DEALS, 2021
 
13 COMPANY PROFILES (Page No. - 285)
(Business overview, Products/Solutions/Services offered, Recent Developments, MNM view)*
     13.1 KEY PLAYERS 
             13.1.1 CORTEVA AGRISCIENCE
                       TABLE 434 CORTEVA AGRISCIENCE: BUSINESS OVERVIEW
                       FIGURE 42 CORTEVA AGRISCIENCE: COMPANY SNAPSHOT
                       TABLE 435 CORTEVA AGRISCIENCE: PRODUCTS/SOLUTIONS/SERVICES OFFERED
             13.1.2 BASF SE
                       TABLE 436 BASF SE: BUSINESS OVERVIEW
                       FIGURE 43 BASF SE: COMPANY SNAPSHOT
                       TABLE 437 BASF SE: PRODUCTS/SOLUTIONS/SERVICES OFFERED
             13.1.3 EVONIK INDUSTRIES
                       TABLE 438 EVONIK INDUSTRIES: BUSINESS OVERVIEW
                       FIGURE 44 EVONIK INDUSTRIES: COMPANY SNAPSHOT
                       TABLE 439 EVONIK INDUSTRIES: PRODUCTS/SOLUTIONS/SERVICES OFFERED
             13.1.4 SOLVAY
                       TABLE 440 SOLVAY: BUSINESS OVERVIEW
                       FIGURE 45 SOLVAY: COMPANY SNAPSHOT
                       TABLE 441 SOLVAY: PRODUCTS/SOLUTIONS/SERVICES OFFERED
                       TABLE 442 SOLVAY: DEALS
             13.1.5 CLARIANT
                       TABLE 443 CLARIANT: BUSINESS OVERVIEW
                       FIGURE 46 CLARIANT: COMPANY SNAPSHOT
                       TABLE 444 CLARIANT: PRODUCTS/SOLUTIONS/SERVICES OFFERED
                       TABLE 445 CLARIANT: PRODUCT LAUNCHES
             13.1.6 CHS INC.
                       TABLE 446 CHS INC.: BUSINESS OVERVIEW
                       FIGURE 47 CHS INC.: COMPANY SNAPSHOT
                       TABLE 447 CHS INC.: PRODUCTS/SOLUTIONS/SERVICES OFFERED
                       TABLE 448 CHS INC.: PRODUCT LAUNCHES
             13.1.7 NUFARM
                       TABLE 449 NUFARM: AGRICULTURAL SURFACTANTS MARKET BUSINESS OVERVIEW
                       FIGURE 48 NUFARM: COMPANY SNAPSHOT
                       TABLE 450 NUFARM: PRODUCTS/SOLUTIONS/SERVICES OFFERED
             13.1.8 CRODA INTERNATIONAL PLC
                       TABLE 451 CRODA INTERNATIONAL PLC: BUSINESS OVERVIEW
                       FIGURE 49 CRODA INTERNATIONAL PLC: COMPANY SNAPSHOT
                       TABLE 452 CRODA INTERNATIONAL PLC: PRODUCTS/SOLUTIONS/SERVICES OFFERED
             13.1.9 STEPAN COMPANY
                       TABLE 453 STEPAN COMPANY: BUSINESS OVERVIEW
                       FIGURE 50 STEPAN COMPANY: COMPANY SNAPSHOT
                       TABLE 454 STEPAN COMPANY: PRODUCTS/SOLUTIONS/SERVICES OFFERED
             13.1.10 HELENA AGRI-ENTERPRISES, LLC
                       TABLE 455 HELENA AGRI-ENTERPRISES, LLC: BUSINESS OVERVIEW
                       TABLE 456 HELENA AGRI-ENTERPRISES, LLC: PRODUCTS/SOLUTIONS/SERVICES OFFERED
             13.1.11 WINFIELD UNITED
                       TABLE 457 WINFIELD UNITED: BUSINESS OVERVIEW
                       TABLE 458 WINFIELD UNITED: PRODUCTS/SOLUTIONS/SERVICES OFFERED
             13.1.12 KALO
                       TABLE 459 KALO: BUSINESS OVERVIEW
                       TABLE 460 KALO: PRODUCTS/SOLUTIONS/SERVICES OFFERED
             13.1.13 WILBUR-ELLIS COMPANY LLC
                       TABLE 461 WILBUR-ELLIS COMPANY: BUSINESS OVERVIEW
                       TABLE 462 WILBUR-ELLIS COMPANY: PRODUCTS/SOLUTIONS/SERVICES OFFERED
                       TABLE 463 WILBUR-ELLIS COMPANY: PRODUCT LAUNCHES
             13.1.14 BRANDT, INC.
                       TABLE 464 BRANDT, INC.: BUSINESS OVERVIEW
                       TABLE 465 BRANDT, INC.: PRODUCTS/SOLUTIONS/SERVICES OFFERED
             13.1.15 NOURYON
                       TABLE 466 NOURYON: BUSINESS OVERVIEW
                       TABLE 467 NOURYON: PRODUCTS/SOLUTIONS/SERVICES OFFERED
     13.2 STARTUPS/SMES 
             13.2.1 PRECISION LABORATORIES, LLC
             13.2.2 GARRCO PRODUCTS, INC.
             13.2.3 INNVICTIS
             13.2.4 LANKEM LTD.
             13.2.5 INDOFIL INDUSTRIES LIMITED
*Details on Business overview, Products/Solutions/Services offered, Recent Developments, MNM view might not be captured in case of unlisted companies.
 
14 ADJACENT AND RELATED MARKETS (Page No. - 330)
     14.1 INTRODUCTION 
               TABLE 468 MARKETS ADJACENT TO AGRICULTURAL SURFACTANTS MARKET
     14.2 LIMITATIONS 
     14.3 AGRICULTURAL ADJUVANTS MARKET 
             14.3.1 MARKET DEFINITION
             14.3.2 MARKET OVERVIEW
                       TABLE 469 AGRICULTURAL ADJUVANTS MARKET, BY ADOPTION STAGE, 2019–2022 (USD MILLION)
                       TABLE 470 AGRICULTURAL ADJUVANTS MARKET, BY ADOPTION STAGE, 2023–2028 (USD MILLION)
     14.4 CROP PROTECTION MARKET 
             14.4.1 MARKET DEFINITION
             14.4.2 MARKET OVERVIEW
                       TABLE 471 CROP PROTECTION CHEMICALS MARKET, BY TYPE, 2016–2019 (USD MILLION)
                       TABLE 472 CROP PROTECTION CHEMICALS MARKET, BY TYPE, 2020–2025 (USD MILLION)
                       TABLE 473 CROP PROTECTION CHEMICALS MARKET, BY TYPE, 2016–2019 (KT)
                       TABLE 474 CROP PROTECTION CHEMICALS MARKET, BY TYPE, 2020–2025 (KT)
 
15 APPENDIX (Page No. - 335)
     15.1 KNOWLEDGESTORE: MARKETSANDMARKETS’ SUBSCRIPTION PORTAL 
     15.2 CUSTOMIZATION OPTIONS 
     15.3 RELATED REPORTS 
     15.4 AUTHOR DETAILS 

This research study involved the extensive use of secondary sources directories and databases such as Bloomberg Businessweek and Factiva—to identify and collect information useful for a technical, market-oriented, and commercial study of the agricultural surfactants market. In-depth interviews were conducted with various primary respondents—such as key industry participants, subject matter experts (SMEs), C-level executives of key market players, and industry consultants—to obtain and verify critical qualitative and quantitative information as well as to assess prospects.

Secondary Research

This research study of agricultural surfactants market involved the extensive use of secondary sources—directories and databases such as Bloomberg Businessweek and Factiva—to identify and collect valuable information for a technical, market-oriented, and commercial study of the agricultural adjuvants market.

In the secondary research process, sources such as annual reports, press releases & investor presentations of companies, white papers, food journals, certified publications, articles from recognized authors, gold & silver standard websites, directories, and databases, were referred to identify and collect information. This research study involved the extensive use of secondary sources—directories and databases such as Bloomberg Businessweek and Factiva—to identify and collect information useful for a technical, market-oriented, and commercial study of the agricultural adjuvants market.

Secondary research was mainly used to obtain key information about the industry’s supply chain, the total pool of key players, and market classification and segmentation as per the industry trends to the bottom-most level, regional markets, and key developments from both market- and technology-oriented perspectives.

Primary Research

Extensive primary research was conducted after obtaining information regarding the agricultural adjuvants market scenario through secondary research. Several primary interviews were conducted with market experts from both the demand and supply sides across major countries of North America, Europe, Asia Pacific, the Middle East & Africa, and South America. Primary data was collected through questionnaires, emails, and telephonic interviews. The primary sources from the supply side included various industry experts, such as Chief X Officers (CXOs), Vice Presidents (VPs), Directors from business development, marketing, research, and development teams, and related key executives from distributors and key opinion leaders. Primary interviews were conducted to gather insights such as market statistics, data on revenue collected from the products and services, market breakdowns, market size estimations, market forecasting, and data triangulation. Primary research also helped understand the formulation, adoption stage, functions, crop types, application, and regional trends. Stakeholders from the demand side, such as dealers, distributors, farmers, and government authorities who are using agricultural adjuvants, were interviewed to understand the buyer’s perspective on the suppliers, products, and their current usage of agricultural adjuvants and future outlook of their business which will affect the overall market.
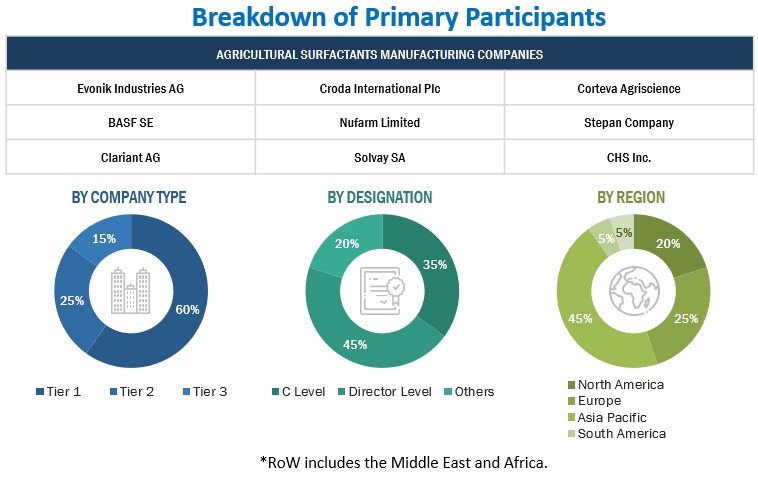
Agricultural Surfactants Market Primary Participants

To know about the assumptions considered for the study, download the pdf brochure

Agricultural Surfactants Market Size Estimation

The following approaches represent the overall market size estimation process employed for the purpose of this study.

Both top-down and bottom-up approaches were used to estimate and validate the total size of the market. These approaches were also used extensively to estimate the size of various dependent submarkets. The research methodology used to estimate the market size includes the following:

Top-down Approach:

  • The key players in the industry and the market were identified through extensive secondary research.
  • The revenues of major agricultural surfactant manufacturers were determined through primary and secondary research, such as paid databases, which were used as the basis for market estimation.
  • Based on the market share analysis of key industry players from all regions, the final market size of the agricultural surfactants market has been arrived at.

Agricultural Surfactants Market Top-Down Approach

To know about the assumptions considered for the study, Request for Free Sample Report

Agricultural Surfactants Market Key Source Information

Bottom-up Approach:

  • Based on the share of agricultural surfactants for each application at regional and country levels, the market sizes were analyzed. Thus, with a bottom-up approach to the application at the country level, the global market for agricultural surfactants was estimated.
  • Based on the demand for applications, offerings of key players, and the region-wise market share of major players, the global market for applications was estimated.
  • Other factors considered include the penetration rate of agricultural surfactants, the demand for sustainable crop protection solutions, consumer awareness, functional trends, the adoption rate, patents registered, and organic & inorganic growth attempts.
  • From this, market sizes for each region were derived.
  • All percentage shares, splits, and breakdowns were determined using secondary sources and verified through primary sources.
  • All macroeconomic and microeconomic factors affecting the growth of the agricultural surfactants market were considered while estimating the market size.
  • All parameters that affect the market covered in this research study were accounted for, viewed in extensive detail, verified through primary research, and analyzed to obtain final quantitative and qualitative data.
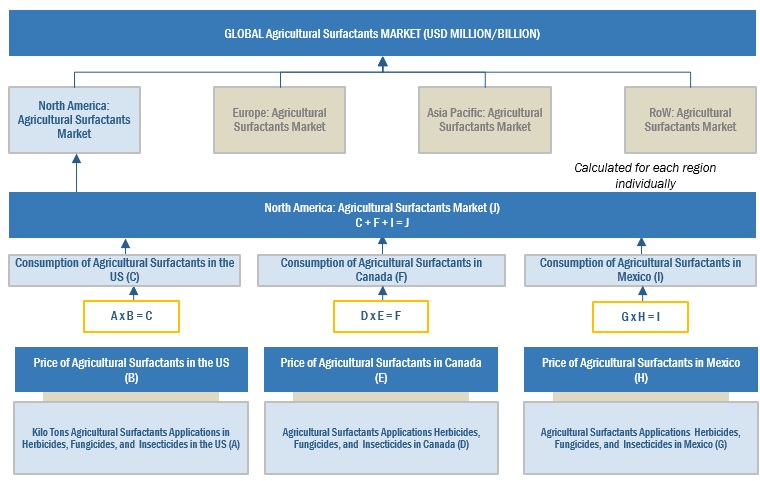
Agricultural Surfactants Market Bottom-Up Approach

The following sections (bottom-up & top-down) (supply-demand) depict the overall market size estimation process employed for this study.

Agricultural Surfactants Market Data Triangulation

After arriving at the global market size from the estimation process explained above, the total market was split into various segments and subsegments. The data triangulation and market breakdown procedures were employed, wherever applicable, to estimate the market and arrive at the exact statistics for all segments and subsegments. The data was triangulated by studying a range of factors and trends from the demand and supply sides. Additionally, the market size was validated using both the top-down and bottom-up approaches.

Agricultural Surfactants Market Definition

According to UPL, agricultural surfactants are activators that improve performance by enhancing surface contact, decreasing runoff, and improving leaf penetration. Non-ionic surfactants, anionic surfactants, and cationic surfactants are the three types of surfactants, with the first two being utilized on crops.  Non-ionic surfactants lower the surface tension of water molecules, allowing droplets to cover a larger surface area of the leaf. Anionic surfactants, on the other hand, interact with water to improve foaming and spreading.

The University of Georgia states that ‘Surfactants are adjuvants that facilitate and accentuate the emulsifying, dispersing, spreading, wetting, or other surface modifying properties of liquids.’ There are different chemistries of agricultural surfactants such as Ethoxylated fatty amines (Cationic), Alkylphenol ethoxylate-based surfactants (non-ionic), Alcohol ethoxylate-based surfactants (non-ionic), and Silicone-Based Surfactants as proposed by USDA.

Stakeholders

  • Manufacturers of pesticides, fertilizers, and other crop inputs
  • Key manufacturers of surfactants
  • Pesticide traders, distributors, and suppliers
  • Raw material and intermediate traders and suppliers in the agricultural adjuvants market
  • Manufacturers and suppliers related to seed treatment and the seeds industry
  • Concerned government authorities, commercial R&D institutions, and other regulatory bodies
  • Regulatory bodies such as
  • US Food and Drug Administration (FDA)
  • European Commission (EC)
  • European Food Safety Authority (EFSA)
  • United States Department of Agriculture (USDA)
  • Food Standards Australia New Zealand (FSANZ)
  • United States Environmental Protection Agency (USEPA)
  • Pest Management Regulatory Agency (PMRA)
  • Government agencies and NGOs
  • Commercial research & development (R&D) institutions and financial institutions
  • Food and Agriculture Organization (FAO)
  • World Health Organization (WHO)
  • Intermediary suppliers such as wholesalers and dealers

Report Objectives

Market Intelligence

  • Determining and projecting the size of the agricultural surfactants market, with respect to type, application, substrate type, crop type, and region, over a five-year period, ranging from 2023 to 2028
  • Identifying the attractive opportunities in the market by determining the largest and fastest-growing segments across regions
  • Providing detailed information about the key factors influencing the growth of the market (drivers, restraints, opportunities, and industry-specific challenges)
  • Providing the regulatory framework for significant countries related to the market
  • Analyzing the micro markets with respect to individual growth trends, prospects, and their contribution to the total market
  • Impact of macro- and microeconomic factors on the market
  • Shift in demand patterns across different subsegments and regions

Competitive Intelligence

  • Identifying and profiling the key players in the global market
  • Providing a comparative analysis of market leaders on the basis of the following:
    • Product offerings
    • Business strategies
    • Strengths and weaknesses
    • Key financials
  • Understanding the competitive landscape and identifying the major growth strategies adopted by players across the key regions
  • Analyzing the value chain and products across the key regions and their impact on the prominent market players
  • Providing insights on key product innovations and investments in the global agricultural surfactants market.

Available Customizations:

With the given market data, MarketsandMarkets offers customizations according to company-specific scientific needs.

The following customization options are available for the report:

Product Analysis

  • Product Matrix, which gives a detailed comparison of the product portfolio of each company

Geographic Analysis

With the given market data, MarketsandMarkets offers customizations according to company-specific scientific needs.

  • Further breakdown of the Rest of Asia Pacific agricultural surfactants market into Singapore, Malaysia, Philippines, Thailand, and South Korea
  • Further breakdown of the Rest of Europe's market into Netherlands, Denmark, Belgium, and Switzerland
  • Further breakdown of the Rest of South America's market into Chile, Peru, and Ecuador

Company Information

  • Detailed analyses and profiling of additional market players (up to five)
Custom Market Research Services

We will customize the research for you, in case the report listed above does not meet with your exact requirements. Our custom research will comprehensively cover the business information you require to help you arrive at strategic and profitable business decisions.

Request Customization
Report Code
AGI 4045
Published ON
Aug, 2023
Choose License Type
BUY NOW
  • SHARE
X
Request Customization
Speak to Analyst
Speak to Analyst
OR FACE-TO-FACE MEETING
PERSONALIZE THIS RESEARCH
  • Triangulate with your Own Data
  • Get Data as per your Format and Definition
  • Gain a Deeper Dive on a Specific Application, Geography, Customer or Competitor
  • Any level of Personalization
REQUEST A FREE CUSTOMIZATION
LET US HELP YOU!
  • What are the Known and Unknown Adjacencies Impacting the Agricultural Surfactants Market
  • What will your New Revenue Sources be?
  • Who will be your Top Customer; what will make them switch?
  • Defend your Market Share or Win Competitors
  • Get a Scorecard for Target Partners
CUSTOMIZED WORKSHOP REQUEST
+1-888-600-6441
  • Call Us
  • +1-888-600-6441 (Corporate office hours)
  • +1-888-600-6441 (US/Can toll free)
  • +44-800-368-9399 (UK office hours)
CONNECT WITH US
ABOUT TRUST ONLINE
©2024 MarketsandMarkets Research Private Ltd. All rights reserved
DMCA.com Protection Status Website Feedback