IoT Sensors Market

IoT Sensors Market by Sensor Type (Pressure, Temperature, Humidity, Image, Inertial, Gyroscope, Touch), Network Technology (Wired and Wireless), Vertical (Commercial IoT and Industrial IoT) and Region - Global Forecast to 2029

Report Code: SE 4506 Feb, 2024, by marketsandmarkets.com

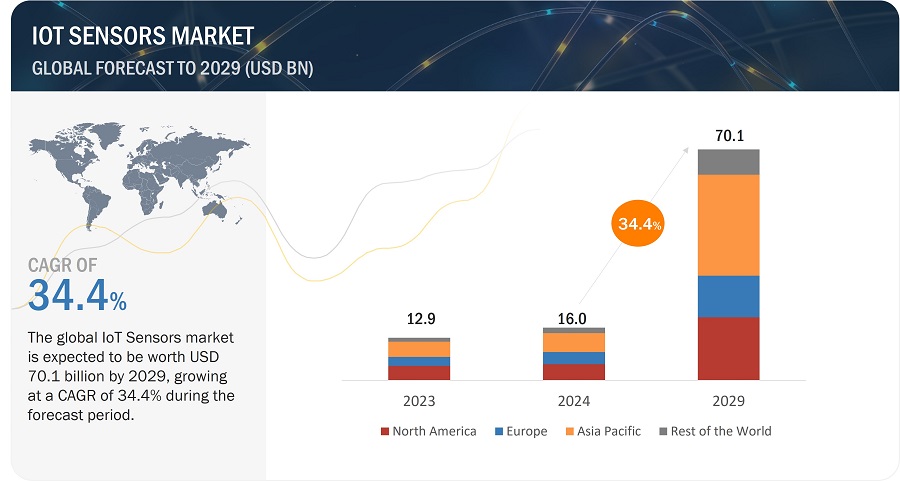
[269 Pages Report] The LoT Sensors Market is expected to grow from USD 16.0 billion in 2024 to USD 70.1 Billion by 2029; it is expected to grow at a CAGR of 34.4% during 2024 to 2029. Rising demand for connected and wearable  devices are the key factors driving the growth of the IoT sensors market. The growing adoption of wearable devices, including fitness bands, smartwatches, smart glasses, EEG monitors, and pain management devices, is primarily driven by the healthcare sector.
IoT Sensors Market

IoT Sensors Market

IoT Sensors Market Forecast to 2029

To know about the assumptions considered for the study, Request for Free Sample Report

IoT Sensors Market Dynamics

Driver: Higher adoption of IPv6

The Internet Protocol (IP), a more flexible, reliable, and scalable protocol than the Network Control Protocol (NCP), was introduced for routing data between networks or hosts. There are two versions of IP: IPv4 and IPv6. IPv6 is the evolutionary development of IP. It uses a 32-bit address scheme, allowing for over 4 billion addresses. With the growing number of Internet users, the number of unused IPv4 addresses is likely to be exhausted because all devices, including computers, smartphones, and gaming consoles, that connect to the internet require an IP address. Hence, IPv6 was introduced to fulfill the need for more internet addresses. IPv6 is designed to allow the internet to grow steadily in terms of the number of hosts connected and the total amount of data traffic transmitted. The adoption of IPv6 has boosted the IoT market as IPv6 utilizes 128-bit Internet addresses. It provides around 2,128 unique addresses, which are more than sufficient to fulfill the requirements of present and future communication devices.

Restraint: Data security concerns

With the emergence of new technologies, data intrusions are also increasing rapidly. IoT platforms are newly developed, and there is a lack of security standards. This is a major hindrance to the growth of the IoT sensors market because enterprise data security is paramount while developing analytics solutions for several vertical-specific applications. Moreover, many data security standards need to be followed to analyze large-scale data. Failing to adhere to these standards could result in data tampering and raise doubts about the authenticity of results generated via the analytics platform being used. In the IoT ecosystem, data is generated from machines and humans; when it comes to personal data such as patient details or financial details, security is a top priority that cannot be compromised.

Opportunity: Cross domain collaboration across businesses

IoT offers an exponential growth opportunity for organizations and businesses to adapt to technological trends and innovations. Cross-domain collaborations and new business models are of utmost importance to realize the full potential of IoT and become successful in the IoT market. For instance, in March 2015, NEXCOM International (Taiwan) developed 6 IoT applications—IoT robotics, Industry 4.0, connected cars, responsive stores, medical informatics, and security—in the industry. Opening 6 different market segments within the IoT ecosystem allowed the company to target a wide range of IoT applications.

Challenge: Lack of common protocol and communication standards

It is necessary to define common protocols or communications standards to enable smart devices to communicate with each other, share data, or form an intelligent network. Interoperability and easy exchange of information between the connected devices is of utmost importance for the further growth of IoT, which would drive the demand for semiconductor chips. The current technical scenario of IoT does not provide any architectural solution or a universal standard to solve the interoperability issue. A universal standard is required in either connectivity type, data formatting, or protocol.

IoT Sensors Market Map:
IoT Sensors Market by Map

Inertial sensors channel to capture the second largest market growth of the IoT sensors market during the forecast period.

An inertial sensor is a combination of the accelerometer and gyroscope functionality. These sensors are used to detect and measure acceleration, tilt, shock, vibration, rotation, and multiple degrees of freedom motions. They are used in the marine, automotive, military, aviation, wearable, consumer, medical, and automotive industries. They are useful in geoengineering, condition monitoring, and navigation.

Ethernet to have largest market size in Wired network technology during the forecast period.

Ethernet, or 802.3, is a network protocol that controls data transmission over the local area network (LAN). For the past two decades, Ethernet has had a major influence on nearly every aspect of communication systems and networking. Initially, it was used in LAN, but now it is used in most WANs too. Ethernet is cost-effective and is popular for emerging applications, such as video transport and storage area networks.

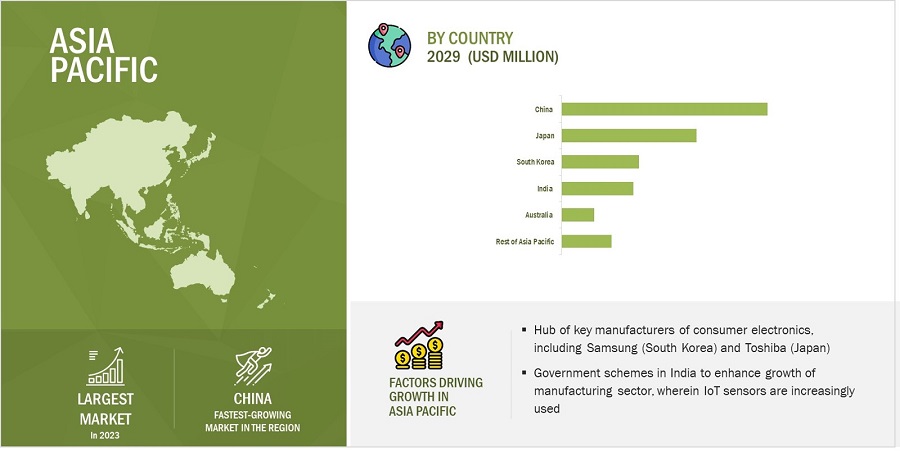
The IoT sensors market in APAC to have largest market szie during the forecast period

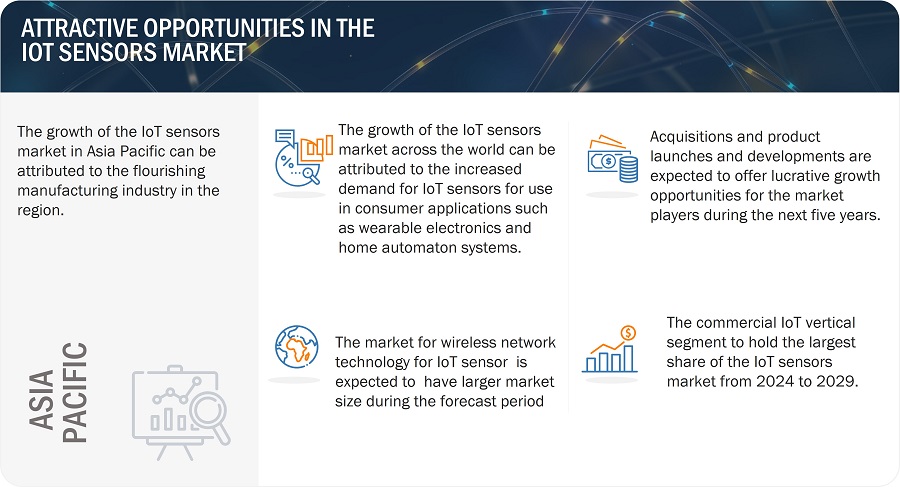
India, China, Japan, South Korea, and Australia are key contributors to the growth and development of the IoT sensors market in Asia Pacific. The growing penetration of the Internet across commercial and residential spaces, along with a broadening consumer base, increasing disposable income of the masses, and improving IT infrastructures are some key determinants supplementing the growth of the IoT sensors market in Asia Pacific. The surging adoption of cloud-based services and the prevailing trend of industrial automation are the key drivers fueling the growth of the IoT sensors market in China, South Korea, Japan, and India.
IoT Sensors Market
 by Region

IoT Sensors Market by Region

To know about the assumptions considered for the study, download the pdf brochure

Key Market Players

The key players in the IoT sensors companies are Texas Instrument (US), TE Connectivity(Switzerland), Broadcom(US), NXP Semiconductors(Netherlands), STMicroelectronics (Switzerland), Bosch Sensortec (Germany), TDK Corporation (Japan), Infineon Technologies AG (Germany), Analog Devices(US), and Omron Corporation (Japan).

IoT Sensors Market Report Scope

Report Metric

Details

Estimated Market Size

USD 16.0 billion in 2024

Projected Market Size

USD 70.1 billion by 2029

Growth Rate

CAGR of 34.4%

Market size available for years

2020–2029

Base year considered

2023

Forecast period

2024–2029

Forecast units

Thousand/Million/Billion

Segments Covered

By Sensors Type, By Network Technology, By Vertical and By Region

Geographies covered

Asia Pacific, Europe, North America, and the Rest of the World

Companies covered

The key players operating in the IoT sensors market are Texas Instruments (US), TE Connectivity (Switzerland), Broadcom (US), NXP Semiconductors (Netherlands), STMicroelectronics NV (Switzerland), Bosch Sensortec (Germany), TDK Corporation (Japan), Infineon Technologies (Germany), Analog Devices (US), Omron Corporation (Japan), Sensirion (Switzerland), Honeywell International (US), Siemens AG (Germany), Knowles Corporation (US), ABB Ltd. (Switzerland), Sensata Technologies (US), Emerson Electric Co. (US), Teledyne Technologies (US), SmartThings Inc. (US), Monnit Corporation (US), Murata Manufacturing Co., (Japan), Figaro Engineering Inc. (Japan), Trafag AG (Switzerland), NIDEC COPAL ELECTRONICS (Japan),  and KITA SENSOR TECH. CO., LTD. (Taiwan).
 

IoT Sensors Market Highlights

This report categorizes the IoT sensors market based on the sensor type, Network Technology, Vertical, and region.

Segment

Subsegment

By Sensor Type

  • Temperature Sensor
  • Pressure Sensor
  • Humidity Sensor
  • Flow Sensor
  • Accelerometer
  • Magnetometer
  • Gyroscope
  • Inertial Sensor
  • Image Sensor
  • Touch Sensor
  • Proximity Sensor
  • Acoustic Sensor
  • Motion Sensor
  • Occupancy Sensor
  • CO2 Sensor
  • Others (Light sensor, and Radar sensor)

By Network Technology

  • Wired
    • KNX
    • LonWorks
    • Ethernet
    • MODBUS
    • DALI
  • Wireless
    • Wi-Fi
      • Bluetooth Smart
      • Wi-Fi Bluetooth Smart
      • Bluetooth Smart / Ant+
      • Bluetooth 5
  • ZIGBEE
  • Z-WAVE
  • NFC
  • RFID
  • ENOCEAN
  • THREAD
  • GLoWPAN
  • WIRELESS-HART
  • Frocess field bus
  • DECT-ULE
  • Others (ANT+, ISA100, GPS, Sub-Gig, and Cellular)

By Vertical

  • Consumer
    • Home automation
    • Smart Cities
    • Wearable Electronics
  • Commercial
    • Retail
    • Aerospace and Defense
    • Logistics and supply chain
    • Entertainment
    • Financial Institutes
    • Corporate Offices
  • Industrial
    • Energy
    • Industrial Automation
    • Transportation
    • Healthcare
    • Smart Agriculture
  • Geographic Analysis
    • North America
    • Europe
    • Asia Pacific
    • RoW

Recent Developments

  • In November 2023, NXP Semiconductor collaborated with Zendar to accelerate and improve high-resolution radar solutions for autonomous driving (AD) and advanced driver assistance systems (ADAS) to complement NXP’s leading scalable radar portfolio.
  • In August 2023, Texas Instruments Incorporated introduced the TMCS1123 Hall-effect current sensor with a simple design and precision for high-voltage applications. It has the industry's most robust reinforced isolation and superior accuracy throughout various temperatures and lifetimes.
  • In February 2023, Bosch Sensortec announced the BMA530 and BMA580, one of the world's smallest MEMS accelerometers. BMA530 tracks activities with its step counter and is especially suitable for wearables, and BMA580 targets with voice activity detection.
  • In February 2023, TE Connectivity collaborated with Preddio Technologies to monitor equipment of all sizes and to increase their efficiency through real-time data analysis. This collaboration allowed them to find solutions combining digital sensors, wireless technology, edge gateway, cloud software, and analytics.

Critical questions answered by this report:

To speak to our analyst for a discussion on the above findings, click Speak to Analyst

TABLE OF CONTENTS
 
1 INTRODUCTION (Page No. - 31)
    1.1 STUDY OBJECTIVES 
    1.2 MARKET DEFINITION 
    1.3 STUDY SCOPE 
           1.3.1 MARKETS COVERED
                    FIGURE 1 MARKET SEGMENTATION
           1.3.2 REGIONAL SCOPE
           1.3.3 YEARS CONSIDERED
    1.4 INCLUSIONS AND EXCLUSIONS 
    1.5 CURRENCY CONSIDERED 34 
    1.6 STAKEHOLDERS 34 
    1.7 SUMMARY OF CHANGES 35 
 
2 RESEARCH METHODOLOGY (Page No. - 36)
    2.1 RESEARCH DATA 
           FIGURE 2 RESEARCH PROCESS FLOW
           FIGURE 3 RESEARCH DESIGN
           2.1.1 SECONDARY AND PRIMARY RESEARCH
                    2.1.1.1 Key industry insights
           2.1.2 SECONDARY DATA
                    2.1.2.1 List of key secondary sources
                    2.1.2.2 Key data from secondary sources
           2.1.3 PRIMARY DATA
                    2.1.3.1 Breakdown of primary interviews
                    2.1.3.2 Key data from primary sources
    2.2 MARKET SIZE ESTIMATION 
           2.2.1 BOTTOM-UP APPROACH
                    2.2.1.1 Approach to arrive at market size using bottom-up analysis (demand side)
                               FIGURE 4 MARKET SIZE ESTIMATION METHODOLOGY: BOTTOM-UP APPROACH
           2.2.2 TOP-DOWN APPROACH
                    2.2.2.1 Approach to arrive at market size using top-down analysis (supply side)
                               FIGURE 5 MARKET SIZE ESTIMATION METHODOLOGY: TOP-DOWN APPROACH
    2.3 DATA TRIANGULATION 
           FIGURE 6 DATA TRIANGULATION
    2.4 RESEARCH ASSUMPTIONS 
    2.5 RESEARCH LIMITATIONS 
    2.6 RISK ASSESSMENT 
    2.7 RECESSION IMPACT ANALYSIS 
           FIGURE 7 IMPACT OF RECESSION ON IOT SENSORS MARKET, 2020–2029 (USD MILLION)
           2.7.1 PARAMETERS TO ANALYZE RECESSION IMPACT
 
3 EXECUTIVE SUMMARY (Page No. - 48)
    FIGURE 8 PRESSURE SENSORS TO LEAD MARKET DURING FORECAST PERIOD
    FIGURE 9 WIRELESS NETWORK TECHNOLOGY TO DOMINATE MARKET DURING FORECAST PERIOD
    FIGURE 10 COMMERCIAL IOT TO HOLD LARGEST MARKET SHARE DURING FORECAST PERIOD
    FIGURE 11 ASIA PACIFIC TO ACCOUNT FOR LARGEST MARKET SHARE DURING FORECAST PERIOD
 
4 PREMIUM INSIGHTS (Page No. - 52)
    4.1 ATTRACTIVE OPPORTUNITIES FOR PLAYERS IN IOT SENSORS MARKET 
           FIGURE 12 INCREASING ADOPTION OF CONSUMER ELECTRONICS TO DRIVE MARKET
    4.2 IOT SENSORS MARKET, BY SENSOR TYPE 
           FIGURE 13 PRESSURE SENSORS TO REGISTER HIGHEST GROWTH DURING FORECAST PERIOD
    4.3 IOT SENSORS MARKET, BY NETWORK TECHNOLOGY 
           FIGURE 14 WIRELESS SEGMENT TO HAVE LARGEST MARKET SHARE DURING FORECAST PERIOD
    4.4 IOT SENSORS MARKET, BY VERTICAL 
           FIGURE 15 COMMERCIAL IOT TO DISPLAY HIGHEST GROWTH DURING FORECAST PERIOD
    4.5 IOT SENSORS MARKET, BY COUNTRY 
           FIGURE 16 CHINA TO GROW AT HIGHEST CAGR DURING FORECAST PERIOD
 
5 MARKET OVERVIEW (Page No. - 55)
    5.1 INTRODUCTION 
    5.2 MARKET DYNAMICS 
           FIGURE 17 IOT SENSORS MARKET: DRIVERS, RESTRAINTS, OPPORTUNITIES, AND CHALLENGES
           5.2.1 DRIVERS
                    FIGURE 18 IOT SENSORS MARKET: DRIVERS AND THEIR IMPACT
                    5.2.1.1 Increasing development of technologically advanced and low-cost sensors
                    5.2.1.2 Introduction of 3GPP Release 13 and 14 specifications
                    5.2.1.3 Growth in internet penetration rate
                               FIGURE 19 REGION-WISE INTERNET USERS TILL JUNE 2022
                    5.2.1.4 Rising demand for connected and wearable devices
                    5.2.1.5 Higher adoption of IPv6
                               FIGURE 20 WORLDWIDE ADOPTION OF IPV6, 2023
                    5.2.1.6 Growing IoT applications in real-time computing
           5.2.2 RESTRAINTS
                    FIGURE 21 IOT SENSORS MARKET: RESTRAINTS AND THEIR IMPACT
                    5.2.2.1 Data security concerns
           5.2.3 OPPORTUNITIES
                    FIGURE 22 IOT SENSORS MARKET: OPPORTUNITIES AND THEIR IMPACT
                    5.2.3.1 Favorable government initiatives and funds for IoT projects
                    5.2.3.2 Implementation of predictive maintenance programs for IoT
                    5.2.3.3 Cross-domain collaborations across businesses
                    5.2.3.4 Inclination of small- and medium-sized businesses toward IoT
           5.2.4 CHALLENGES
                    FIGURE 23 IOT SENSORS MARKET: CHALLENGES AND THEIR IMPACT
                    5.2.4.1 Lack of common protocols and communication standards
                    5.2.4.2 Shortage of technical know-how
                    5.2.4.3 High power consumption by connected devices
                    5.2.4.4 Limited bandwidth and latency issues
    5.3 TRENDS AND DISRUPTIONS IMPACTING CUSTOMER BUSINESS 
           FIGURE 24 REVENUE SHIFT AND NEW REVENUE POCKETS FOR PLAYERS IN IOT SENSORS MARKET
    5.4 PRICING ANALYSIS 
           5.4.1 AVERAGE SELLING PRICE OF IOT SENSORS, BY KEY PLAYERS
                    FIGURE 25 AVERAGE SELLING PRICE OF IOT SENSORS, BY KEY PLAYERS (USD)
           5.4.2 AVERAGE SELLING PRICE, BY SENSOR TYPE
                    FIGURE 26 AVERAGE SELLING PRICE, BY SENSOR TYPE, 2020 VS. 2029 (USD)
    5.5 VALUE CHAIN ANALYSIS 
           FIGURE 27 VALUE CHAIN ANALYSIS
           5.5.1 CHIP DESIGNERS
           5.5.2 COMPONENT MANUFACTURERS
           5.5.3 TECHNOLOGY PROVIDERS
           5.5.4 INTEGRATORS
           5.5.5 END USE APPLICATIONS
    5.6 ECOSYSTEM ANALYSIS 
           FIGURE 28 ECOSYSTEM MAPPING
           TABLE 1 ROLE OF COMPANIES IN ECOSYSTEM
    5.7 TECHNOLOGY ANALYSIS 
           5.7.1 KEY TECHNOLOGIES
                    5.7.1.1 5G
                    5.7.1.2 Low-power wide area networks (LPWAN)
           5.7.2 COMPLEMENTARY TECHNOLOGIES
                    5.7.2.1 Quantum dot CMOS technology
                    5.7.2.2 Multipixel technology (MPT)
           5.7.3 ADJACENT TECHNOLOGIES
                    5.7.3.1 Thermal imaging
                    5.7.3.2 Electronic nose (e-nose)
    5.8 PATENT ANALYSIS 
           FIGURE 29 TOP 10 COMPANIES WITH HIGHEST NUMBER OF PATENT APPLICATIONS IN LAST 10 YEARS
           TABLE 2 TOP 10 PATENT OWNERS IN US, 2013–2023
           FIGURE 30 PATENT PUBLICATION TREND, 2013–2023
           TABLE 3 INNOVATIONS AND PATENT REGISTRATIONS, 2020–2023
    5.9 TRADE DATA ANALYSIS 
           5.9.1 IMPORT SCENARIO OF IMAGE SENSORS
                    FIGURE 31 IMPORT DATA FOR IMAGE SENSORS FOR TOP FIVE COUNTRIES, 2019–2022 (THOUSAND UNITS)
           5.9.2 EXPORT SCENARIO OF IMAGE SENSORS
                    FIGURE 32 EXPORT DATA FOR IMAGE SENSORS FOR TOP FIVE COUNTRIES, 2019–2022 (THOUSAND UNITS)
    5.10 TARIFF AND REGULATORY LANDSCAPE 
           5.10.1 TARIFFS RELATED TO IOT SENSORS MARKET
                    TABLE 4 MFN TARIFFS FOR GAS OR SMOKE ANALYSIS APPARATUS EXPORTED BY US
                    TABLE 5 MFN TARIFFS FOR GAS OR SMOKE ANALYSIS APPARATUS IMPORTS BY CHINA
           5.10.2 REGULATORY BODIES, GOVERNMENT AGENCIES, AND OTHER ORGANIZATIONS
                    TABLE 6 NORTH AMERICA: REGULATORY BODIES, GOVERNMENT AGENCIES, AND OTHER ORGANIZATIONS
                    TABLE 7 EUROPE: REGULATORY BODIES, GOVERNMENT AGENCIES, AND OTHER ORGANIZATIONS
                    TABLE 8 ASIA PACIFIC: REGULATORY BODIES, GOVERNMENT AGENCIES, AND OTHER ORGANIZATIONS
                    TABLE 9 REST OF THE WORLD: REGULATORY BODIES, GOVERNMENT AGENCIES, AND OTHER ORGANIZATIONS
           5.10.3 REGULATORY STANDARDS
                    TABLE 10 NORTH AMERICA: SAFETY STANDARDS FOR IOT SENSORS
                    TABLE 11 EUROPE: SAFETY STANDARDS FOR IOT SENSORS
                    TABLE 12 ASIA PACIFIC: SAFETY STANDARDS FOR IOT SENSORS
                    TABLE 13 REST OF THE WORLD: SAFETY STANDARDS FOR IOT SENSORS
    5.11 PORTER’S FIVE FORCES ANALYSIS 
           FIGURE 33 PORTER’S FIVE FORCES ANALYSIS
           TABLE 14 IMPACT OF PORTER’S FIVE FORCES
           5.11.1 THREAT OF NEW ENTRANTS
           5.11.2 THREAT OF SUBSTITUTES
           5.11.3 BARGAINING POWER OF SUPPLIERS
           5.11.4 BARGAINING POWER OF BUYERS
           5.11.5 INTENSITY OF COMPETITIVE RIVALRY
    5.12 KEY STAKEHOLDERS AND BUYING CRITERIA 
           5.12.1 KEY STAKEHOLDERS IN BUYING PROCESS
                    FIGURE 34 INFLUENCE OF STAKEHOLDERS ON BUYING PROCESS, BY VERTICAL
                    TABLE 15 INFLUENCE OF STAKEHOLDERS ON BUYING PROCESS, BY VERTICAL (%)
           5.12.2 BUYING CRITERIA
                    FIGURE 35 KEY BUYING CRITERIA, BY VERTICAL
                    TABLE 16 KEY BUYING CRITERIA, BY VERTICAL
    5.13 CASE STUDY ANALYSIS 
           5.13.1 REMOTE MONITORING SYSTEMS FOR MANAGING HVAC SETUP
           5.13.2 MAINTAINING WATER QUALITY FOR PISCICULTURE
           5.13.3 WATER QUALITY MONITORING SYSTEM FOR IRRIGATION DAM
           5.13.4 HUMAN CONDITION SAFETY SENSORS TO MINIMIZE JOB SITE RISKS
           5.13.5 SMART CONSTRUCTION USING IOT SENSORS
           5.13.6 TEMPERATURE AND HUMIDITY TRACKING IN DATA CENTERS
    5.14 KEY CONFERENCES AND EVENTS 
           TABLE 17 KEY CONFERENCES AND EVENTS, 2024–2025
 
6 IOT SENSORS MARKET, BY SENSOR TYPE (Page No. - 92)
    6.1 INTRODUCTION 
           FIGURE 36 IOT SENSORS MARKET, BY SENSOR TYPE
           TABLE 18 IOT SENSORS MARKET, BY SENSOR TYPE, 2020–2023 (USD MILLION)
           TABLE 19 IOT SENSORS MARKET, BY SENSOR TYPE, 2024–2029 (USD MILLION)
           TABLE 20 IOT SENSORS MARKET, BY SENSOR TYPE, 2020–2023 (MILLION UNITS)
           TABLE 21 IOT SENSORS MARKET, BY SENSOR TYPE, 2024–2029 (MILLION UNITS)
    6.2 TEMPERATURE SENSORS 
           6.2.1 HIGHER OPERATIONAL LIFESPAN AND ENERGY EFFICIENCY TO DRIVE MARKET
                    TABLE 22 TEMPERATURE SENSORS: IOT SENSORS MARKET, BY VERTICAL, 2020–2023 (USD MILLION)
                    TABLE 23 TEMPERATURE SENSORS: IOT SENSORS MARKET, BY VERTICAL, 2024–2029 (USD MILLION)
                    TABLE 24 TEMPERATURE SENSORS: IOT SENSORS MARKET, BY REGION, 2020–2023 (USD MILLION)
                    TABLE 25 TEMPERATURE SENSORS: IOT SENSORS MARKET, BY REGION, 2024–2029 (USD MILLION)
    6.3 PRESSURE SENSORS 
           6.3.1 UTILIZATION IN INTELLIGENT BUILDINGS TO DRIVE MARKET
                    TABLE 26 PRESSURE SENSORS: IOT SENSORS MARKET, BY VERTICAL, 2020–2023 (USD MILLION)
                    TABLE 27 PRESSURE SENSORS: IOT SENSORS MARKET, BY VERTICAL, 2024–2029 (USD MILLION)
                    TABLE 28 PRESSURE SENSORS: IOT SENSORS MARKET, BY REGION, 2020–2023 (USD MILLION)
                    TABLE 29 PRESSURE SENSORS: IOT SENSORS MARKET, BY REGION, 2024–2029 (USD MILLION)
    6.4 HUMIDITY SENSORS 
           6.4.1 EASY CONNECTIVITY WITH WI-FI-ENABLED DEVICES TO DRIVE MARKET
                    TABLE 30 HUMIDITY SENSORS: IOT SENSORS MARKET, BY VERTICAL, 2020–2023 (USD MILLION)
                    TABLE 31 HUMIDITY SENSORS: IOT SENSORS MARKET, BY VERTICAL, 2024–2029 (USD MILLION)
                    FIGURE 37 HUMIDITY IOT SENSORS MARKET IN ASIA PACIFIC TO GROW AT HIGHEST CAGR FROM 2024 TO 2029
                    TABLE 32 HUMIDITY SENSORS: IOT SENSORS MARKET, BY REGION, 2020–2023 (USD MILLION)
                    TABLE 33 HUMIDITY SENSORS: IOT SENSORS MARKET, BY REGION, 2024–2029 (USD MILLION)
    6.5 FLOW SENSORS 
           6.5.1 HIGH ADOPTION IN INDUSTRIAL MANUFACTURING AND HEALTHCARE TO DRIVE MARKET
                    TABLE 34 FLOW SENSORS: IOT SENSORS MARKET, BY VERTICAL, 2020–2023 (USD MILLION)
                    TABLE 35 FLOW SENSORS: IOT SENSORS MARKET, BY VERTICAL, 2024–2029 (USD MILLION)
                    TABLE 36 FLOW SENSORS: IOT SENSORS MARKET, BY REGION, 2020–2023 (USD MILLION)
                    TABLE 37 FLOW SENSORS: IOT SENSORS MARKET, BY REGION, 2024–2029 (USD MILLION)
    6.6 ACCELEROMETERS 
           6.6.1 ABILITY TO MEASURE ACCELERATION, TILT, VIBRATION, AND SHOCK TO DRIVE MARKET
                    TABLE 38 ACCELEROMETERS: IOT SENSORS MARKET, BY VERTICAL, 2020–2023 (USD MILLION)
                    TABLE 39 ACCELEROMETERS: IOT SENSORS MARKET, BY VERTICAL, 2024–2029 (USD MILLION)
                    TABLE 40 ACCELEROMETERS: IOT SENSORS MARKET, BY REGION, 2020–2023 (USD MILLION)
                    TABLE 41 ACCELEROMETERS: IOT SENSORS MARKET, BY REGION, 2024–2029 (USD MILLION)
    6.7 MAGNETOMETERS 
           6.7.1 INDUSTRIAL IOT AND SMART CITIES TO DRIVE MARKET
                    TABLE 42 MAGNETOMETERS: IOT SENSORS MARKET, BY VERTICAL, 2020–2023 (USD MILLION)
                    TABLE 43 MAGNETOMETERS: IOT SENSORS MARKET, BY VERTICAL, 2024–2029 (USD MILLION)
                    TABLE 44 MAGNETOMETERS: IOT SENSORS MARKET, BY REGION, 2020–2023 (USD MILLION)
                    TABLE 45 MAGNETOMETERS: IOT SENSORS MARKET, BY REGION, 2024–2029 (USD MILLION)
    6.8 GYROSCOPES 
           6.8.1 INCREASING USE IN PORTABLE INSTRUMENTS TO DRIVE MARKET
                    TABLE 46 GYROSCOPES: IOT SENSORS MARKET, BY VERTICAL, 2020–2023 (USD MILLION)
                    TABLE 47 GYROSCOPES: IOT SENSORS MARKET, BY VERTICAL, 2024–2029 (USD MILLION)
                    TABLE 48 GYROSCOPES: IOT SENSORS MARKET, BY REGION, 2020–2023 (USD MILLION)
                    TABLE 49 GYROSCOPES: IOT SENSORS MARKET, BY REGION, 2024–2029 (USD MILLION)
    6.9 INERTIAL SENSORS 
           6.9.1 GEOENGINEERING, CONDITION MONITORING, AND NAVIGATION APPLICATIONS TO DRIVE MARKET
                    TABLE 50 INERTIAL SENSORS: IOT SENSORS MARKET, BY VERTICAL, 2020–2023 (USD MILLION)
                    TABLE 51 INERTIAL SENSORS: IOT SENSORS MARKET, BY VERTICAL, 2024–2029 (USD MILLION)
                    TABLE 52 INERTIAL SENSORS: IOT SENSORS MARKET, BY REGION, 2020–2023 (USD MILLION)
                    TABLE 53 INERTIAL SENSORS: IOT SENSORS MARKET, BY REGION, 2024–2029 (USD MILLION)
    6.10 IMAGE SENSORS 
           6.10.1 LOW POWER CONSUMPTION, COMPACTNESS, AND FAST PRODUCTION TO DRIVE MARKET
                    TABLE 54 IMAGE SENSORS: IOT SENSORS MARKET, BY VERTICAL, 2020–2023 (USD MILLION)
                    TABLE 55 IMAGE SENSORS: IOT SENSORS MARKET, BY VERTICAL, 2024–2029 (USD MILLION)
                    TABLE 56 IMAGE SENSORS: IOT SENSORS MARKET, BY REGION, 2020–2023 (USD MILLION)
                    TABLE 57 IMAGE SENSORS: IOT SENSORS MARKET, BY REGION, 2024–2029 (USD MILLION)
    6.11 TOUCH SENSORS 
           6.11.1 ATTRACTIVE DESIGNS WITH AFFORDABLE MANUFACTURING TO DRIVE MARKET
                    TABLE 58 TOUCH SENSORS: IOT SENSORS MARKET, BY VERTICAL, 2020–2023 (USD MILLION)
                    TABLE 59 TOUCH SENSORS: IOT SENSORS MARKET, BY VERTICAL, 2024–2029 (USD MILLION)
                    TABLE 60 TOUCH SENSORS: IOT SENSORS MARKET, BY REGION, 2020–2023 (USD MILLION)
                    TABLE 61 TOUCH SENSORS: IOT SENSORS MARKET, BY REGION, 2024–2029 (USD MILLION)
    6.12 PROXIMITY SENSORS 
           6.12.1 PROMINENT USE IN MOBILE PHONES, TABLETS, AND PERSONAL COMPUTERS TO DRIVE MARKET
                    TABLE 62 PROXIMITY SENSORS: IOT SENSORS MARKET, BY VERTICAL, 2020–2023 (USD MILLION)
                    TABLE 63 PROXIMITY SENSORS: IOT SENSORS MARKET, BY VERTICAL, 2024–2029 (USD MILLION)
                    TABLE 64 PROXIMITY SENSORS: IOT SENSORS MARKET, BY REGION, 2020–2023 (USD MILLION)
                    TABLE 65 PROXIMITY SENSORS: IOT SENSORS MARKET, BY REGION, 2024–2029 (USD MILLION)
    6.13 ACOUSTIC SENSORS 
           6.13.1 UNDERWATER AND UNDERGROUND COMMUNICATION TO DRIVE MARKET
                    TABLE 66 ACOUSTIC SENSORS: IOT SENSORS MARKET, BY VERTICAL, 2020–2023 (USD MILLION)
                    TABLE 67 ACOUSTIC SENSORS: IOT SENSORS MARKET, BY VERTICAL, 2024–2029 (USD MILLION)
                    TABLE 68 ACOUSTIC SENSORS: IOT SENSORS MARKET, BY REGION, 2020–2023 (USD MILLION)
                    TABLE 69 ACOUSTIC SENSORS: IOT SENSORS MARKET, BY REGION, 2024–2029 (USD MILLION)
    6.14 MOTION SENSORS 
           6.14.1 RISING USE IN CONSUMER APPLIANCES, MEDICAL DEVICES, AND INDUSTRIAL APPLICATIONS TO DRIVE MARKET
                    TABLE 70 MOTION SENSORS: IOT SENSORS MARKET, BY VERTICAL, 2020–2023 (USD MILLION)
                    TABLE 71 MOTION SENSORS: IOT SENSORS MARKET, BY VERTICAL, 2024–2029 (USD MILLION)
                    TABLE 72 MOTION SENSORS: IOT SENSORS MARKET, BY REGION, 2020–2023 (USD MILLION)
                    TABLE 73 MOTION SENSORS: IOT SENSORS MARKET, BY REGION, 2024–2029 (USD MILLION)
    6.15 OCCUPANCY SENSORS 
           TABLE 74 OCCUPANCY SENSORS: IOT SENSORS MARKET, BY VERTICAL, 2020–2023 (USD MILLION)
           TABLE 75 OCCUPANCY SENSORS: IOT SENSORS MARKET, BY VERTICAL, 2024–2029 (USD MILLION)
           TABLE 76 OCCUPANCY SENSORS: IOT SENSORS MARKET, BY REGION, 2020–2023 (USD MILLION)
           TABLE 77 OCCUPANCY SENSORS: IOT SENSORS MARKET, BY REGION, 2024–2029 (USD MILLION)
           6.15.1 IMAGE PROCESSING OCCUPANCY SENSORS
                    6.15.1.1 Improved performance than passive infrared sensors and ultrasonic sensors to drive market
           6.15.2 INTELLIGENT OCCUPANCY SENSORS
                    6.15.2.1 Easy detection of human presence and adjustment of HVAC systems to drive market
    6.16 CO2 SENSORS 
           6.16.1 INDOOR CLIMATE SENSING TO DRIVE MARKET
           TABLE 78 CO2 SENSORS: IOT SENSORS MARKET, BY VERTICAL, 2020–2023 (USD MILLION)
           TABLE 79 CO2 SENSORS: IOT SENSORS MARKET, BY VERTICAL, 2024–2029 (USD MILLION)
           TABLE 80 CO2 SENSORS: IOT SENSORS MARKET, BY REGION, 2020–2023 (USD MILLION)
           TABLE 81 CO2 SENSORS: IOT SENSORS MARKET, BY REGION, 2024–2029 (USD MILLION)
    6.17 OTHER SENSORS 
           6.17.1 LIGHT SENSORS
           6.17.2 RADAR SENSORS
           TABLE 82 OTHER SENSORS: IOT SENSORS MARKET, BY VERTICAL, 2020–2023 (USD MILLION)
           TABLE 83 OTHER SENSORS: IOT SENSORS MARKET, BY VERTICAL, 2024–2029 (USD MILLION)
           TABLE 84 OTHER SENSORS: IOT SENSORS MARKET, BY REGION, 2020–2023 (USD MILLION)
           TABLE 85 OTHER SENSORS: IOT SENSORS MARKET, BY REGION, 2024–2029 (USD MILLION)
 
7 IOT SENSORS MARKET, BY NETWORK TECHNOLOGY (Page No. - 124)
    7.1 INTRODUCTION 
           FIGURE 38 KEY NETWORK TECHNOLOGIES IN IOT SENSORS MARKET
           FIGURE 39 WIRELESS NETWORK TECHNOLOGY SEGMENT TO LEAD IOT SENSORS MARKET FROM 2024 TO 2029
           TABLE 86 IOT SENSORS MARKET, BY NETWORK TECHNOLOGY, 2020–2023 (USD MILLION)
           TABLE 87 IOT SENSORS MARKET, BY NETWORK TECHNOLOGY, 2024–2029 (USD MILLION)
    7.2 WIRED 
           FIGURE 40 ETHERNET TO HOLD LARGEST MARKET SHARE DURING FORECAST PERIOD
           TABLE 88 WIRED: IOT SENSORS MARKET, BY TYPE, 2020–2023 (USD MILLION)
           TABLE 89 WIRED: IOT SENSORS MARKET, BY TYPE, 2024–2029 (USD MILLION)
           7.2.1 KNX
                    7.2.1.1 Home and building control applications to drive market
           7.2.2 LONWORKS
                    7.2.2.1 Standardized interface for sensors to drive market
           7.2.3 ETHERNET
                    7.2.3.1 Mobile, cloud, and IoT network communication to drive market
           7.2.4 MODBUS
                    7.2.4.1 High adoption in manufacturing industries to drive market
           7.2.5 DIGITAL ADDRESSABLE LIGHTING INTERFACE (DALI)
                    7.2.5.1 Increasing prevalence of new lighting technologies to drive market
    7.3 WIRELESS 
           TABLE 90 WIRELESS: IOT SENSORS MARKET, BY TYPE, 2020–2023 (USD MILLION)
           TABLE 91 WIRELESS: IOT SENSORS MARKET, BY TYPE, 2024–2029 (USD MILLION)
           7.3.1 WI-FI
                    7.3.1.1 3G-powered Wi-Fi connections in cars to drive market
           7.3.2 BLUETOOTH
                    7.3.2.1 Bluetooth Smart
                               7.3.2.1.1 High adoption in wearable electronics to drive market
                    7.3.2.2 Wi-Fi/Bluetooth Smart
                               7.3.2.2.1 Seamless connectivity with wireless LAN networks to drive market
                    7.3.2.3 Bluetooth Smart/Ant+
                               7.3.2.3.1 SensRcore feature to drive market
                    7.3.2.4 Bluetooth 5
                               7.3.2.4.1 Location-based marketing to drive market
           7.3.3 ZIGBEE
                    7.3.3.1 Personal area networks to drive market
           7.3.4 Z-WAVE
                    7.3.4.1 Home automation trend to drive market
           7.3.5 NEAR FIELD COMMUNICATION (NFC)
                    7.3.5.1 Need for cost-effective and easy interactions between electronic devices to drive market
           7.3.6 RFID
                    7.3.6.1 Integration in supply chain, inventory control, and logistics to drive market
           7.3.7 ENOCEAN
                    7.3.7.1 Interoperable standard promoting wireless technologies to drive market
           7.3.8 THREAD
                    7.3.8.1 Higher speed than Wi-Fi to drive market
           7.3.9 6LOWPAN
                    7.3.9.1 Scalability and self-healing properties to drive market
           7.3.10 WIRELESS-HART (WHART)
                    7.3.10.1 Configuration, diagnostics, and data processing applications to drive market
           7.3.11 PROCESS FIELD BUS
                    7.3.11.1 Standardized field bus communication to drive market
           7.3.12 DECT-ULE
                    7.3.12.1 Low power consumption and long range to drive market
           7.3.13 OTHER WIRELESS TECHNOLOGIES
                    7.3.13.1 ANT+
                    7.3.13.2 ISA100
                    7.3.13.3 GPS
                    7.3.13.4 Sub-Gig
                    7.3.13.5 Cellular
 
8 IOT SENSORS MARKET, BY VERTICAL (Page No. - 138)
    8.1 INTRODUCTION 
           FIGURE 41 CONSUMER IOT SENSORS MARKET TO RECORD HIGHEST CAGR DURING FORECAST PERIOD
           TABLE 92 IOT SENSORS MARKET, BY VERTICAL, 2020–2023 (USD MILLION)
           TABLE 93 IOT SENSORS MARKET, BY VERTICAL, 2024–2029 (USD MILLION)
    8.2 CONSUMER IOT 
           8.2.1 INSIGHTS INTO USAGE PATTERNS OF ELECTRONIC DEVICES BY CONSUMERS TO DRIVE MARKET
                    TABLE 94 CONSUMER IOT: IOT SENSORS MARKET, BY SENSOR TYPE, 2020–2023 (USD MILLION)
                    TABLE 95 CONSUMER IOT: IOT SENSORS MARKET, BY SENSOR TYPE, 2024–2029 (USD MILLION)
    8.3 COMMERCIAL IOT 
           TABLE 96 COMMERCIAL IOT: IOT SENSORS MARKET, BY END USE APPLICATIONS, 2020–2023 (USD MILLION)
           TABLE 97 COMMERCIAL IOT: IOT SENSORS MARKET, BY END USE APPLICATIONS, 2024–2029 (USD MILLION)
           TABLE 98 COMMERCIAL IOT: IOT SENSORS MARKET, BY SENSOR TYPE, 2020–2023 (USD MILLION)
           TABLE 99 COMMERCIAL IOT: IOT SENSORS MARKET, BY SENSOR TYPE, 2024–2029 (USD MILLION)
           8.3.1 SMART CITIES
                    8.3.1.1 Traffic management and smart parking to drive market
           8.3.2 RETAIL
                    FIGURE 42 LOGISTICS, SUPPLY CHAIN, AND TRANSPORTATION SEGMENT TO HOLD LARGEST MARKET SHARE FOR RETAIL APPLICATIONS DURING FORECAST PERIOD
                    TABLE 100 COMMERCIAL IOT: IOT SENSORS MARKET, BY RETAIL APPLICATIONS, 2020–2023 (USD MILLION)
                    TABLE 101 COMMERCIAL IOT: IOT SENSORS MARKET, BY RETAIL APPLICATIONS, 2024–2029 (USD MILLION)
                    8.3.2.1 Advertising and marketing
                               8.3.2.1.1 Increased competition among retail stores to drive market
                    8.3.2.2 Digital signages
                               8.3.2.2.1 Product promotion and customer engagement to drive market
                    8.3.2.3 Energy optimization
                               8.3.2.3.1 Increasing use of smart meters to drive market
                    8.3.2.4 Intelligent payment solutions
                               8.3.2.4.1 Popularity of point-of-sale payment counters to drive market
                    8.3.2.5 Real-time/streaming analytics
                               8.3.2.5.1 Use of analytics for effective decision making to drive market
                    8.3.2.6 Resource management
                               8.3.2.6.1 Workforce training and productivity measurement to drive market
                    8.3.2.7 Safety & security
                               8.3.2.7.1 Threat of security breaches to drive market
                    8.3.2.8 Smart shelves and smart doors
                               8.3.2.8.1 Increasing use of radio frequency identification reader-equipped shelves to drive market
                    8.3.2.9 Smart vending machines
                               8.3.2.9.1 Growing preference for enhanced shopping experiences to drive market
           8.3.3 AEROSPACE & DEFENSE
                    8.3.3.1 Drones/unmanned aerial vehicles
                               8.3.3.1.1 Electronic warfare and strike missions to drive market
                    8.3.3.2 Predictive maintenance
                               8.3.3.2.1 Ability to identify first-stage equipment failure to drive market
           8.3.4 LOGISTICS, SUPPLY CHAIN, AND TRANSPORTATION
                    8.3.4.1 Warehouse and inventory management and travel-centric applications and services to drive market
           8.3.5 ENTERTAINMENT
                    8.3.5.1 Rising installation of IoT sensors in shopping malls and theme parks to drive market
           8.3.6 FINANCIAL INSTITUTES
                    8.3.6.1 Booming Fintech sector to drive market
           8.3.7 CORPORATE OFFICES
                    8.3.7.1 High adoption of occupancy sensors in corporate houses to drive market
    8.4 INDUSTRIAL IOT 
           FIGURE 43 INDUSTRIAL AUTOMATION TO DOMINATE INDUSTRIAL IOT SENSORS MARKET FROM 2024 TO 2029
           TABLE 102 INDUSTRIAL IOT: IOT SENSORS MARKET, BY END USE APPLICATIONS, 2020–2023 (USD MILLION)
           TABLE 103 INDUSTRIAL IOT: IOT SENSORS MARKET, BY END USE APPLICATIONS, 2024–2029 (USD MILLION)
           TABLE 104 INDUSTRIAL IOT: IOT SENSORS MARKET, BY SENSOR TYPE, 2020–2023 (USD MILLION)
           TABLE 105 INDUSTRIAL IOT: IOT SENSORS MARKET, BY SENSOR TYPE, 2024–2029 (USD MILLION)
           8.4.1 ENERGY
                    8.4.1.1 Implementation of smart grids to drive market
           8.4.2 INDUSTRIAL AUTOMATION
                    8.4.2.1 Supply chain optimization and enhanced asset maintenance to drive market
           8.4.3 HEALTHCARE
                    FIGURE 44 INPATIENT MONITORING SEGMENT TO EXHIBIT HIGHEST CAGR FROM 2024 TO 2029
                    TABLE 106 INDUSTRIAL IOT: IOT SENSORS MARKET, BY HEALTHCARE APPLICATIONS, 2020–2023 (USD MILLION)
                    TABLE 107 INDUSTRIAL IOT: IOT SENSORS MARKET, BY HEALTHCARE APPLICATIONS, 2024–2029 (USD MILLION)
                    8.4.3.1 Telemedicine
                               8.4.3.1.1 Need for accessible health facilities in rural areas to drive market
                    8.4.3.2 Clinical operations and workflow management
                               8.4.3.2.1 Improved medical equipment and inventory management to drive market
                    8.4.3.3 Connected imaging
                               8.4.3.3.1 High-quality healthcare and imaging services to drive market
                    8.4.3.4 Inpatient monitoring
                               8.4.3.4.1 Non-invasive monitoring of patients to drive market
                    8.4.3.5 Medication management
                               8.4.3.5.1 Accurate clinical trials and research to drive market
                    8.4.3.6 Other healthcare applications
           8.4.4 SMART AGRICULTURE
                    TABLE 108 INDUSTRIAL IOT: IOT SENSORS MARKET, BY SMART AGRICULTURE APPLICATIONS, 2020–2023 (USD MILLION)
                    TABLE 109 INDUSTRIAL IOT: IOT SENSORS MARKET, BY SMART AGRICULTURE APPLICATIONS, 2024–2029(USD MILLION)
                    8.4.4.1 Precision farming
                               8.4.4.1.1 Maximum yields with minimum input costs to drive market
                    8.4.4.2 Livestock monitoring
                               8.4.4.2.1 Monitoring livestock health to identify possible disease outbreaks and treatment plans to drive market
                    8.4.4.3 Smart fish farming
                               8.4.4.3.1 Efficient tracking of fish migration to drive market
                    8.4.4.4 Smart greenhouses
                               8.4.4.4.1 Cultivation of perishables in ideal environment to drive market
                    8.4.4.5 Other smart agriculture applications
 
9 IOT SENSORS MARKET, BY REGION (Page No. - 165)
    9.1 INTRODUCTION 
           FIGURE 45 GEOGRAPHIC SNAPSHOT OF IOT SENSORS MARKET
           TABLE 110 IOT SENSORS MARKET, BY REGION, 2020–2023 (USD MILLION)
           TABLE 111 IOT SENSORS MARKET, BY REGION, 2024–2029 (USD MILLION)
    9.2 NORTH AMERICA 
           FIGURE 46 NORTH AMERICA: IOT SENSORS MARKET SNAPSHOT
           TABLE 112 NORTH AMERICA: IOT SENSORS MARKET, BY SENSOR TYPE, 2020–2023 (USD MILLION)
           TABLE 113 NORTH AMERICA: IOT SENSORS MARKET, BY SENSOR TYPE, 2024–2029 (USD MILLION)
           TABLE 114 NORTH AMERICA: IOT SENSORS MARKET, BY COUNTRY, 2020–2023 (USD MILLION)
           TABLE 115 NORTH AMERICA: IOT SENSORS MARKET, BY COUNTRY, 2024–2029 (USD MILLION)
           9.2.1 US
                    9.2.1.1 Growing demand for consumer electronics and presence of leading sensor manufacturers to drive market
           9.2.2 CANADA
                    9.2.2.1 Setting up of data centers to drive market
           9.2.3 MEXICO
                    9.2.3.1 Economic growth, political stability, and increased healthcare expenditure to drive market
           9.2.4 NORTH AMERICA: RECESSION IMPACT ANALYSIS
    9.3 EUROPE 
           FIGURE 47 EUROPE: IOT SENSORS MARKET SNAPSHOT
           TABLE 116 EUROPE: IOT SENSORS MARKET, BY SENSOR TYPE, 2020–2023 (USD MILLION)
           TABLE 117 EUROPE: IOT SENSORS MARKET, BY SENSOR TYPE, 2024–2029 (USD MILLION)
           TABLE 118 EUROPE: IOT SENSORS MARKET, BY COUNTRY, 2020–2023 (USD MILLION)
           TABLE 119 EUROPE: IOT SENSORS MARKET, BY COUNTRY, 2024–2029 (USD MILLION)
           9.3.1 GERMANY
                    9.3.1.1 Industry 4.0 initiative to drive market
           9.3.2 UK
                    9.3.2.1 Robust digital infrastructure to drive market
           9.3.3 FRANCE
                    9.3.3.1 Presence of industry-leading car companies to drive market
           9.3.4 ITALY
                    9.3.4.1 Cloud computing and big data adoption in various industries to drive market
           9.3.5 SPAIN
                    9.3.5.1 IoT sensor deployment in precision agriculture to drive market
           9.3.6 REST OF EUROPE
           9.3.7 EUROPE: RECESSION IMPACT ANALYSIS
    9.4 ASIA PACIFIC 
           FIGURE 48 ASIA PACIFIC: IOT SENSORS MARKET SNAPSHOT
           TABLE 120 ASIA PACIFIC: IOT SENSORS MARKET, BY SENSOR TYPE, 2020–2023 (USD MILLION)
           TABLE 121 ASIA PACIFIC: IOT SENSORS MARKET, BY SENSOR TYPE, 2024–2029 (USD MILLION)
           TABLE 122 ASIA PACIFIC: IOT SENSORS MARKET, BY COUNTRY, 2020–2023 (USD MILLION)
           TABLE 123 ASIA PACIFIC: IOT SENSORS MARKET, BY COUNTRY, 2024–2029 (USD MILLION)
           9.4.1 CHINA
                    9.4.1.1 Internet Plus strategy to drive market
           9.4.2 JAPAN
                    9.4.2.1 Growing demand for sophisticated and expensive medical equipment to drive market
           9.4.3 SOUTH KOREA
                    9.4.3.1 Ministry of Trade, Industry, and Energy investments to drive market
           9.4.4 INDIA
                    9.4.4.1 Development of government-backed digital payment systems to drive market
           9.4.5 AUSTRALIA
                    9.4.5.1 Increased healthcare and agriculture expenditures to drive market
           9.4.6 REST OF ASIA PACIFIC
           9.4.7 ASIA PACIFIC: RECESSION IMPACT ANALYSIS
    9.5 REST OF THE WORLD 
           TABLE 124 REST OF THE WORLD: IOT SENSORS MARKET, BY SENSOR TYPE, 2020–2023 (USD MILLION)
           TABLE 125 REST OF THE WORLD: IOT SENSORS MARKET, BY SENSOR TYPE, 2024–2029 (USD MILLION)
           TABLE 126 REST OF THE WORLD: IOT SENSORS MARKET, BY REGION, 2020–2023 (USD MILLION)
           TABLE 127 REST OF THE WORLD: IOT SENSORS MARKET, BY REGION, 2024–2029 (USD MILLION)
           9.5.1 GCC
                    9.5.1.1 Strategic partnerships and collaborations between countries and global semiconductor companies to drive market
           9.5.2 REST OF MIDDLE EAST & AFRICA
                    9.5.2.1 Oil & gas industry to drive market
           9.5.3 SOUTH AMERICA
                    9.5.3.1 Easy availability of affordable electronic products and rising use of smartphones and handheld devices to drive market
 
10 COMPETITIVE LANDSCAPE (Page No. - 190)
     10.1 INTRODUCTION 
     10.2 KEY PLAYERS’ STRATEGIES 
             TABLE 128 KEY PLAYERS’ STRATEGIES
     10.3 MARKET REVENUE ANALYSIS 
             FIGURE 49 MARKET REVENUE ANALYSIS, 2020–2022
     10.4 MARKET SHARE ANALYSIS 
             FIGURE 50 MARKET SHARE ANALYSIS, 2023
             TABLE 129 DEGREE OF COMPETITION
             TABLE 130 MARKET RANKING ANALYSIS OF TOP FIVE PLAYERS
     10.5 COMPANY EVALUATION MATRIX 
             10.5.1 STARS
             10.5.2 EMERGING LEADERS
             10.5.3 PERVASIVE PLAYERS
             10.5.4 PARTICIPANTS
                        FIGURE 51 COMPANY EVALUATION MATRIX
             10.5.5 COMPANY FOOTPRINT
                        TABLE 131 COMPANY FOOTPRINT
                        TABLE 132 COMPANY FOOTPRINT, BY VERTICAL
                        TABLE 133 COMPANY FOOTPRINT, BY REGION
                        TABLE 134 COMPANY FOOTPRINT, BY SENSOR TYPE
     10.6 STARTUP/SME EVALUATION MATRIX 
             10.6.1 PROGRESSIVE COMPANIES
             10.6.2 RESPONSIVE COMPANIES
             10.6.3 DYNAMIC COMPANIES
             10.6.4 STARTING BLOCKS
                        FIGURE 52 STARTUP/SME EVALUATION MATRIX
             10.6.5 COMPETITIVE BENCHMARKING
                        TABLE 135 LIST OF KEY STARTUPS/SMES
                        TABLE 136 COMPETITIVE BENCHMARKING
                        TABLE 137 COMPETITIVE BENCHMARKING, BY REGION
                        TABLE 138 COMPETITIVE BENCHMARKING, BY VERTICAL
                        TABLE 139 COMPETITIVE BENCHMARKING, BY SENSOR TYPE
     10.7 COMPETITIVE SCENARIOS AND TRENDS 
             10.7.1 PRODUCT LAUNCHES
                        TABLE 140 PRODUCT LAUNCHES, 2019–2023
             10.7.2 DEALS
                        TABLE 141 DEALS, 2019–2023
 
11 COMPANY PROFILES (Page No. - 207)
     11.1 KEY PLAYERS 
(Business Overview, Products/Solutions/Services Offered, Recent Developments, MnM view (Key strengths/Right to win, Strategic choices made, Weakness/competitive threats)*  
             11.1.1 TEXAS INSTRUMENTS
                        TABLE 142 TEXAS INSTRUMENTS: COMPANY OVERVIEW
                        FIGURE 53 TEXAS INSTRUMENTS: COMPANY SNAPSHOT
                        TABLE 143 TEXAS INSTRUMENTS: PRODUCTS/SOLUTIONS/SERVICES OFFERED
                        TABLE 144 TEXAS INSTRUMENTS: PRODUCT LAUNCHES
                        TABLE 145 TEXAS INSTRUMENTS: DEALS
             11.1.2 TE CONNECTIVITY
                        TABLE 146 TE CONNECTIVITY: COMPANY OVERVIEW
                        FIGURE 54 TE CONNECTIVITY: COMPANY SNAPSHOT
                        TABLE 147 TE CONNECTIVITY: PRODUCTS/SOLUTIONS/SERVICES OFFERED
                        TABLE 148 TE CONNECTIVITY: DEALS
             11.1.3 BROADCOM
                        TABLE 149 BROADCOM: COMPANY OVERVIEW
                        FIGURE 55 BROADCOM: COMPANY SNAPSHOT
                        TABLE 150 BROADCOM: PRODUCTS/SOLUTIONS/SERVICES OFFERED
                        TABLE 151 BROADCOM: PRODUCT LAUNCHES
             11.1.4 NXP SEMICONDUCTORS
                        TABLE 152 NXP SEMICONDUCTORS: COMPANY OVERVIEW
                        FIGURE 56 NXP SEMICONDUCTORS: COMPANY SNAPSHOT
                        TABLE 153 NXP SEMICONDUCTORS: PRODUCTS/SOLUTIONS/SERVICES OFFERED
                        TABLE 154 NXP SEMICONDUCTORS: PRODUCT LAUNCHES
                        TABLE 155 NXP SEMICONDUCTORS: DEALS
             11.1.5 STMICROELECTRONICS NV
                        TABLE 156 STMICROELECTRONICS NV: COMPANY OVERVIEW
                        FIGURE 57 STMICROELECTRONICS NV: COMPANY SNAPSHOT
                        TABLE 157 STMICROELECTRONICS NV: PRODUCTS/SOLUTIONS/SERVICES OFFERED
                        TABLE 158 STMICROELECTRONICS NV: PRODUCT LAUNCHES
                        TABLE 159 STMICROELECTRONICS NV: DEALS
                        TABLE 160 STMICROELECTRONICS NV: EXPANSIONS
             11.1.6 BOSCH SENSORTEC
                        TABLE 161 BOSCH SENSORTEC: COMPANY OVERVIEW
                        TABLE 162 BOSCH SENSORTEC: PRODUCTS/SOLUTIONS/SERVICES OFFERED
                        TABLE 163 BOSCH SENSORTEC: PRODUCT LAUNCHES
                        TABLE 164 BOSCH SENSORTEC: DEALS
             11.1.7 TDK CORPORATION
                        TABLE 165 TDK CORPORATION: COMPANY OVERVIEW
                        FIGURE 58 TDK CORPORATION: COMPANY SNAPSHOT
                        TABLE 166 TDK CORPORATION: PRODUCTS/SOLUTIONS/SERVICES OFFERED
                        TABLE 167 TDK CORPORATION: PRODUCT LAUNCHES
                        TABLE 168 TDK CORPORATION: DEALS
             11.1.8 INFINEON TECHNOLOGIES AG
                        TABLE 169 INFINEON TECHNOLOGIES AG: COMPANY OVERVIEW
                        FIGURE 59 INFINEON TECHNOLOGIES AG: COMPANY SNAPSHOT
                        TABLE 170 INFINEON TECHNOLOGIES AG: PRODUCTS/SOLUTIONS/SERVICES OFFERED
                        TABLE 171 INFINEON TECHNOLOGIES AG: PRODUCT LAUNCHES
                        TABLE 172 INFINEON TECHNOLOGIES AG: DEALS
             11.1.9 ANALOG DEVICES
                        TABLE 173 ANALOG DEVICES: COMPANY OVERVIEW
                        FIGURE 60 ANALOG DEVICES: COMPANY SNAPSHOT
                        TABLE 174 ANALOG DEVICES: PRODUCTS/SOLUTIONS/SERVICES OFFERED
                        TABLE 175 ANALOG DEVICES: DEALS
                        TABLE 176 ANALOG DEVICES: OTHER DEVELOPMENTS
             11.1.10 OMRON CORPORATION
                        TABLE 177 OMRON CORPORATION: COMPANY OVERVIEW
                        FIGURE 61 OMRON CORPORATION: COMPANY SNAPSHOT
                        TABLE 178 OMRON CORPORATION: PRODUCTS/SOLUTIONS/SERVICES OFFERED
                        TABLE 179 OMRON CORPORATION: PRODUCT LAUNCHES
                        TABLE 180 OMRON CORPORATION: DEALS
     11.2 OTHER PLAYERS 
             11.2.1 SENSIRION
                        TABLE 181 SENSIRION: COMPANY OVERVIEW
             11.2.2 HONEYWELL INTERNATIONAL
                        TABLE 182 HONEYWELL INTERNATIONAL: COMPANY OVERVIEW
             11.2.3 SIEMENS AG
                        TABLE 183 SIEMENS AG: COMPANY OVERVIEW
             11.2.4 KNOWLES CORPORATION
                        TABLE 184 KNOWLES CORPORATION: COMPANY OVERVIEW
             11.2.5 ABB LTD.
                        TABLE 185 ABB LTD.: COMPANY OVERVIEW
             11.2.6 SENSATA TECHNOLOGIES
                        TABLE 186 SENSATA TECHNOLOGIES: COMPANY OVERVIEW
             11.2.7 EMERSON ELECTRIC CO.
                        TABLE 187 EMERSON ELECTRIC CO.: COMPANY OVERVIEW
             11.2.8 TELEDYNE TECHNOLOGIES INCORPORATED
                        TABLE 188 TELEDYNE TECHNOLOGIES INCORPORATED: COMPANY OVERVIEW
             11.2.9 SMARTTHINGS INC.
                        TABLE 189 SMARTTHINGS INC.: COMPANY OVERVIEW
             11.2.10 MONNIT CORPORATION
                        TABLE 190 MONNIT CORPORATION: COMPANY OVERVIEW
             11.2.11 MURATA MANUFACTURING CO., LTD.
                        TABLE 191 MURATA MANUFACTURING CO. LTD.: COMPANY OVERVIEW
             11.2.12 FIGARO ENGINEERING INC.
                        TABLE 192 FIGARO ENGINEERING INC.: COMPANY OVERVIEW
             11.2.13 TRAFAG AG
                        TABLE 193 TRAFAG AG: COMPANY OVERVIEW
             11.2.14 NIDEC COPAL ELECTRONICS
                        TABLE 194 NIDEC COPAL ELECTRONICS: COMPANY OVERVIEW
             11.2.15 KITA SENSOR TECH. CO., LTD.
                        TABLE 195 KITA SENSOR TECH CO., LTD.: COMPANY OVERVIEW
*Details on Business Overview, Products/Solutions/Services Offered, Recent Developments, MnM view (Key strengths/Right to win, Strategic choices made, Weakness/competitive threats)* might not be captured in case of unlisted companies.  
 
12 APPENDIX (Page No. - 261)
     12.1 DISCUSSION GUIDE 
     12.2 KNOWLEDGESTORE: MARKETSANDMARKETS’ SUBSCRIPTION PORTAL 
     12.3 CUSTOMIZATION OPTIONS 
     12.4 RELATED REPORTS 
     12.5 AUTHOR DETAILS 
 

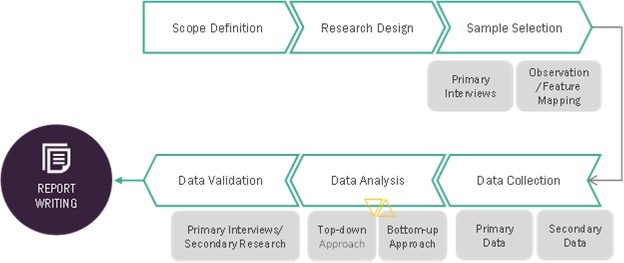
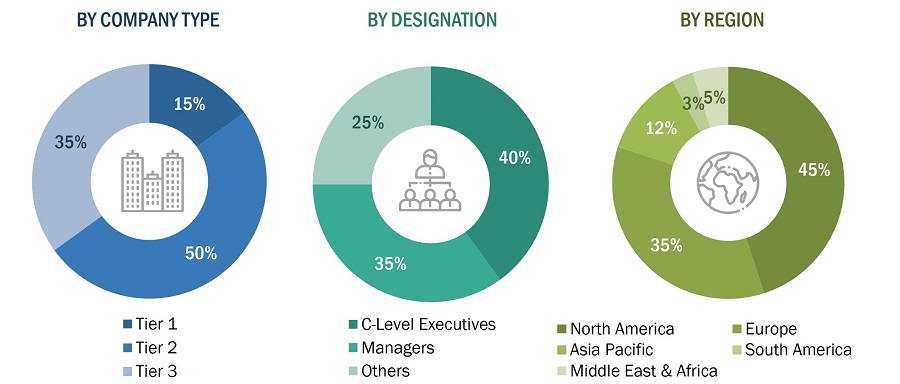
The study involved four major activities in estimating the size of the IoT sensors market. Exhaustive secondary research has been done to collect information on the market, peer market, and parent market. Validation of these findings, assumptions, and sizing with industry experts across the value chain through primary research has been the next step. Both top-down and bottom-up approaches have been employed to estimate the global market size. After that, market breakdown and data triangulation have been used to estimate the market sizes of segments and subsegments.

Secondary Research

Secondary sources that were referred to for this research study include corporate filings (such as annual reports, investor presentations, and financial statements); trade, business, and professional associations; white papers; certified publications; articles from recognized authors; directories; and databases. Secondary data was collected and analyzed to arrive at the overall market size, further validated by primary research.

Primary Research

Extensive primary research was conducted after understanding and analyzing the IoT sensors market scenario through the secondary research process. Several primary interviews were conducted with key opinion leaders from both the demand- and supply-side vendors across four major regions—North America, Asia Pacific, Europe, and RoW (including the Middle East & Africa and South America).

After interacting with industry experts, brief sessions were conducted with highly experienced independent consultants to reinforce the findings from our primary. This, along with the in-house subject matter experts’ opinions, has led us to the findings as described in the remainder of this report.
IoT Sensors Market
 Size, and Share

To know about the assumptions considered for the study, download the pdf brochure

Market Size Estimation

In the complete market engineering process, both top-down and bottom-up approaches have been used, along with several data triangulation methods to perform market estimation and forecasting for the overall market segments and subsegments listed in this report. Extensive qualitative and quantitative analyses have been performed on the complete market engineering process to list key information/insights. The research methodology used to estimate the market size includes the following:

  • Key players in major applications and markets have been identified through extensive secondary research.
  • The industry’s supply chain and market size, in terms of value, have been determined through primary and secondary research processes.
  • All percentage shares, splits, and breakdowns have been determined using secondary sources and verified through primary sources.

After arriving at the overall market size from the market size estimation process explained above, the total market has been split into several segments and subsegments. To complete the overall market engineering process and arrive at the exact statistics for all segments and subsegments, the market breakdown and data triangulation procedures have been employed, wherever applicable. The data has been triangulated by studying various factors and trends from both demand-and supply-side. Along with this, the market has been validated using both top-down and bottom-up approaches.

IoT sensors Market Top-down Approach

IoT Sensors Market
 Size, and Top-down Approach

Data Triangulation

After arriving at the overall market size through the process explained earlier, the total market was split into several segments. The market breakdown and data triangulation procedures were employed, wherever applicable, to complete the overall market engineering process and arrive at the exact statistics for all the segments and subsegments. The data was triangulated by studying various factors and trends from both the demand and supply sides. The market was validated using both the top-down and bottom-up approaches.

Market Definition

IoT sensors refer to sensors used in smart applications, which require uninterrupted connectivity to carry out real-time data analytics. They require common connecting platforms for collecting and analyzing data. IoT sensors are based on the computing concept that considers every physical object to be connected to the Internet to communicate with each other. Sensors are the most important component in the IoT ecosystem. They gather required data from their surroundings and communicate it to the concerned operators. Image, temperature, pressure, ultrasonic, light, and position sensors, accelerometers, and gyroscopes are the key sensors in the IoT ecosystem.

Key Stakeholders

  • Semiconductor Companies
  • Embedded System Companies
  • Consumer Electronics Manufacturers
  • Sensor Manufacturers
  • Technology Providers
  • Original Equipment Manufacturers (OEMs)
  • Universities and Research Organizations
  • Internet Identity Management, Privacy, and Security Companies
  • Machine-to-Machine (M2M), IoT, and Telecommunication Companies
  • Government Bodies

Report Objectives

  • To describe and forecast the size of the Internet of Things (IoT) sensors market in terms of value, based sensor type, network technology, vertical, and region
  • To forecast the market size, in terms of value, for various segments in four key regions, namely, North America, Europe, Asia Pacific (APAC), and the Rest of the World (RoW)
  • To forecast the size of the IoT sensors market in terms of volume
  • To provide detailed information regarding the key factors such as drivers, restraints, opportunities, and challenges influencing the growth of the IoT sensors market
  • To analyze micromarkets1 with respect to individual growth trends, prospects, and contribution to the total market
  • To analyze the opportunities in the market for various stakeholders by identifying the
    high-growth segments of the IoT sensors market
  • To profile the key players and comprehensively analyze their market ranking and core competencies2, along with a detailed competitive landscape for the market leaders.
  • To map the competitive intelligence based on the company profiles, key player strategies, and game-changing developments, such as product launches and developments, partnerships, collaborations, and acquisitions undertaken in the market.

Available customizations:

MarketsandMarkets offers the following customizations for this market report:

  • Further breakdown of the market in different regions to the country-level
  • Detailed analysis and profiling of additional market players (up to 5)
Custom Market Research Services

We will customize the research for you, in case the report listed above does not meet with your exact requirements. Our custom research will comprehensively cover the business information you require to help you arrive at strategic and profitable business decisions.

Request Customization

Instant Answers with GPT - Ask Now!

Ask real questions. Get complete answers !
Report Code
SE 4506
Published ON
Feb, 2024
Choose License Type
BUY NOW
  • SHARE
X
Request Customization
Speak to Analyst
Speak to Analyst
OR FACE-TO-FACE MEETING
PERSONALIZE THIS RESEARCH
  • Triangulate with your Own Data
  • Get Data as per your Format and Definition
  • Gain a Deeper Dive on a Specific Application, Geography, Customer or Competitor
  • Any level of Personalization
REQUEST A FREE CUSTOMIZATION
LET US HELP YOU!
  • What are the Known and Unknown Adjacencies Impacting the IoT Sensors Market
  • What will your New Revenue Sources be?
  • Who will be your Top Customer; what will make them switch?
  • Defend your Market Share or Win Competitors
  • Get a Scorecard for Target Partners
CUSTOMIZED WORKSHOP REQUEST
+1-888-600-6441
  • Call Us
  • +1-888-600-6441 (Corporate office hours)
  • +1-888-600-6441 (US/Can toll free)
  • +44-800-368-9399 (UK office hours)
CONNECT WITH US
ABOUT TRUST ONLINE
©2024 MarketsandMarkets Research Private Ltd. All rights reserved
DMCA.com Protection Status Website Feedback