Management Decision Market

Management Decision Market by Offering, Vertical (BFSI, Retail & Consumer Goods, Telecom, IT & ITeS, Healthcare & Lifesciences, Manufacturing, Government, Transportation & Logistics, Energy & Utilities), Application and Region - Global Forecast to 2028

Report Code: TC 6094 Aug, 2023, by marketsandmarkets.com

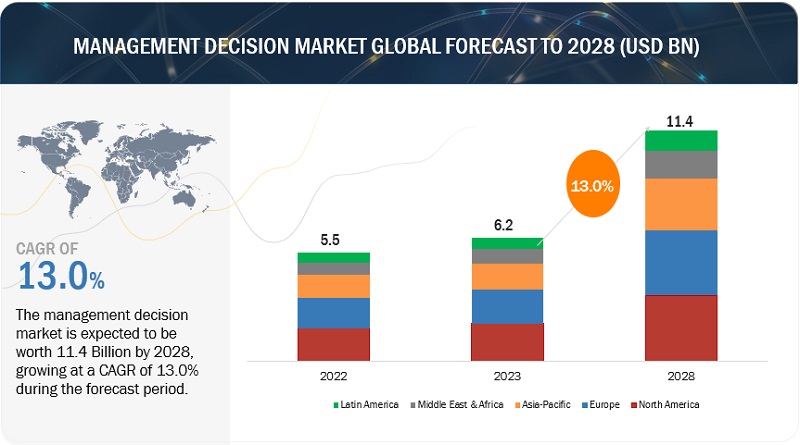
[290 Pages Report] MarketsandMarkets forecasts that the Management Decision market size is projected to grow from USD 6.2 billion in 2023 to USD 11.4 billion by 2028, at a CAGR of 13.0% during the forecast period. The rising need to enhance global presence will increase the adoption of Management Decisions. Key factors expected to drive the market’s growth are the compelling need to manage regulatory and compliance standards and the growing need for faster operational decisions and improved process efficiency. The rising customer expectations and competition among the leading market players increase the demand for cost-effective measures to enhance operational efficiencies. These factors are driving the demand for management decisions.
Management Decision Market

To know about the assumptions considered for the study, Request for Free Sample Report
Management Decision Market

To know about the assumptions considered for the study, download the pdf brochure

Management Decision Market Dynamics

Driver:  Increasing integration of AI to automate the decision-making process will drive market growth.

AI is transforming businesses, boosting innovation and productivity while facilitating organizational agility. It's widely implemented across industries, enhancing supply chains, transportation, education, marketing, and disaster management. AI's benefits include automation, anomaly detection, and accurate predictions, reducing manual work and improving decision-making. Organizations should strategically evaluate AI adoption to align with company goals and address ethical considerations. AI's impact on business operations is profound and continues to grow.

Restraint: Companies’ resistance to adopting modern technologies to reduce machine dependency, wrong information, and limited skills

Despite the numerous advantages of automation and cutting-edge technologies, such as time savings, decreased error rates, and cost efficiencies. Certain companies remain hesitant about integrating these advancements. This resistance often stems from apprehensions about the disruptions that new technological changes might bring to their established business environments. Consequently, some businesses confine themselves to a select group of vendors that offer familiar protocols and tools. In the present digital age, enterprises are exhibiting reluctance to adopt emerging technologies, largely due to the specialized skills and training these technologies demand.

Opportunity: Growing inclination of organizations toward decision-making with predictive analytics

There is a strong need for traditional methods to be changed, moving away from manual – arduous – planning processes to digital platforms that deliver digital transformation and build resiliency to disruption. Predictive modeling and What-If Scenario capabilities will help address this, providing insight into how different market changes and business strategies will impact the financial bottom line. This data will also offer more for operational teams and clarify how the organization achieves its overarching strategic goals.

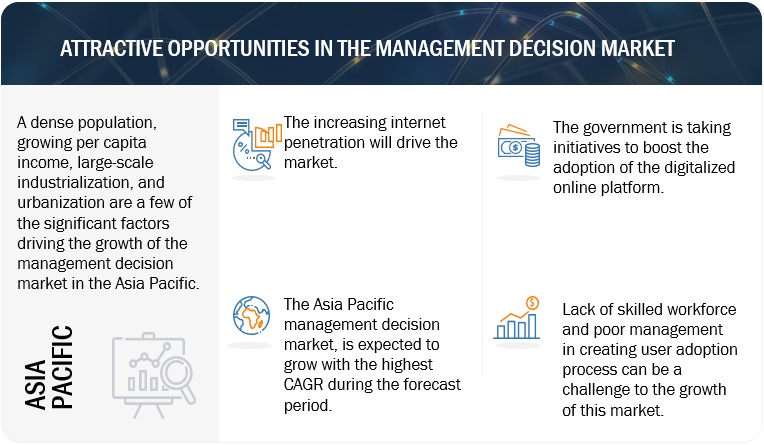
Challenge: Lack of skilled workforce and poor management in creating user adoption process

The efficacy of technology relies heavily on the capabilities of the workforce utilizing it. The system's potential remains unrealized if employees fail to input accurate data or extract pertinent reports. This challenge is predominantly linked to training deficiencies, where numerous companies highlight the scarcity of competent candidates and proficient staff available for training. As a company embarks on a comprehensive digital transformation, the industrial landscape undergoes significant changes. Correspondingly, training initiatives must adapt to these shifts. Streamlining the complexity that has permeated company cultures within the industry will be pivotal in genuinely enhancing reliability and achieving successful digitization.

Management Decision Market Ecosystem

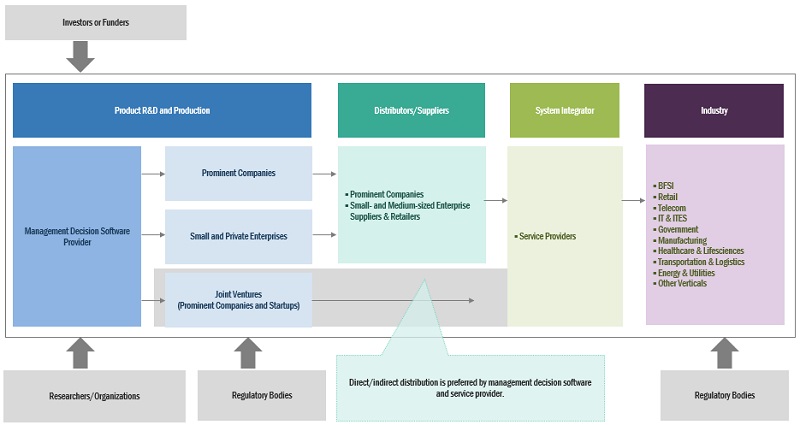
Prominent companies in this market include a well-established, financially stable provider of the Management Decision market. These companies have innovated their offerings and possess a diversified product portfolio, state-of-the-art technologies, and strong global sales and marketing networks. Prominent companies in this market include IBM (US), FICO (US), SAS (US), Oracle (US), Pegasystems (US), TIBCO Software (US), Sapiens International Corporation (Israel), and Experian (Ireland).
Management Decision Market

By Service, the deployment & integration segment is expected to hold the largest market size during the forecast period.

Management decision vendors offer deployment and integration services to organizations for hassle-free implementation, installation, and deployment of management decision software. System integration services help organizations plan the integration layout as per the business requirement. Management decision software needs to be integrated with the existing systems; hence, they require the right connectors and back-end integration capabilities. System integration services are gaining wide acceptance by end users globally, as they ensure that systems communicate with each other efficiently to enhance the entire production process workflow

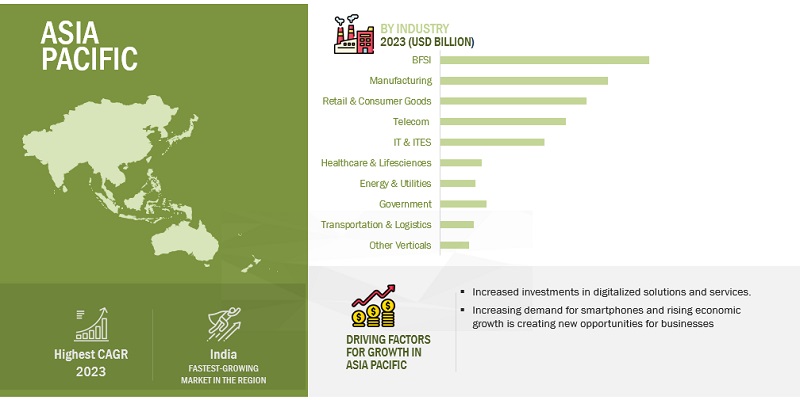
By Vertical, the BFSI segment is expected to hold the largest market size during the forecast period.

Today’s banking organizations face the pressing challenges of digital transformation, changing regulatory requirements, increased competition, and constrained margins. Banks are compelled to fundamentally change how they operate and govern their organizations to keep up with the rapid pace of change and create efficiencies for the bank and its customers. The BFSI industry provides extensive growth opportunities for management decisions due to the globalization of financial services and the growing IT investment. Management decision software empowers financial institutions to automate the decision-making process, thereby helping them to make informed decisions.

By application, the fraud detection management segment is expected to grow with the highest CAGR during the forecast period.

Numerous companies are showing keen interest in leveraging IoT (Internet of Things) technologies within the finance sector, primarily for fraud detection, as they anticipate impressive outcomes from their implementation. This approach facilitates the collection of data related to financial transactions, enabling the monitoring of accounts for fraudulent activities, scrutiny of applications for inconsistencies, and the creation of more accurate customer spending profiles. IoT tools have the capability to seamlessly identify customers across various digital devices and channels, thereby reducing instances of fraud while facilitating legitimate transactions. By integrating IoT into banking and financial services, institutions can effectively track the location of financial crimes, identify the specific devices implicated, and proactively address these issues in a timely manner. With the rise in fraud incidents globally, the demand for management decision software is gaining traction among enterprises for fraud detection management.

Based on region, Asia Pacific is expected to have the highest growth rate during the forecast period.

Asia Pacific exhibits a notable propensity for technology adoption and is poised to achieve the highest growth rate in the Management Decision market in the coming years. The management decision market within the Asia Pacific region encompasses China, Japan, India, and other countries in the region. Asia Pacific stands as a prominent global center for digital innovation, and enterprises here have promptly recognized the advantages of utilizing cloud technology to drive their digital transformation endeavors. The need for effective management decisions is experiencing swift expansion across the Asia Pacific area. This growth can be attributed to the escalating intricacies of businesses within the region, the heightened accessibility of data, and the amplified emphasis on regulatory compliance.
Management Decision Market Size, and Share

Market Players:

The major players in the Management Decision market are IBM (US), FICO (US), SAS (US), Oracle (US), Pegasystems (US), TIBCO Software (US), Sapiens International Corporation (Israel), Experian (Ireland), Equifax (US), Actico (Germany), Parmenides (Germany), Decision Management Solutions (US), OpenRules (US), Sparkling Logic (US), Scorto (Netherland), RapidGen (UK), Progress (US), InRule (US), CRIF (Italy), Decisions (US), Enova Decisions (US), FlexRule (Australia), Rulex (US), Seon (UK), and Decisimo (UK). These players have adopted various growth strategies, such as partnerships, agreements and collaborations, new product launches, product enhancements, and acquisitions to expand their footprint in the Management Decision market.

Get online access to the report on the World's First Market Intelligence Cloud

  • Easy to Download Historical Data & Forecast Numbers
  • Company Analysis Dashboard for high growth potential opportunities
  • Research Analyst Access for customization & queries
  • Competitor Analysis with Interactive dashboard
  • Latest News, Updates & Trend analysis
Request Sample

Scope of the Report

Report Metrics

Details

Market size available for years

2018-2028

Base year considered

2022

Forecast period

2023–2028

Forecast units

Value (USD) Million/Billion

Segments Covered

Offering (Software and Service), Application (Credit Risk Management, Collection Management, Customer Experience Management, Fraud Detection Management, Pricing Optimization, and Other Applications), Vertical, and Region

Region covered

North America, Europe, Asia Pacific, Middle East & Africa, Latin America

Companies covered

IBM (US), FICO (US), SAS (US), Oracle (US), Pegasystems (US), TIBCO Software (US), Sapiens International Corporation (Israel), Experian (Ireland), Equifax (US), Actico (Germany), Parmenides (Germany), Decision Management Solutions (US), OpenRules (US), Sparkling Logic (US), Scorto (Netherland), RapidGen (UK), Progress (US), InRule (US), CRIF (Italy), Decisions (US), Enova Decisions (US), FlexRule (Australia), Rulex (US), Seon (UK), and Decisimo (UK)

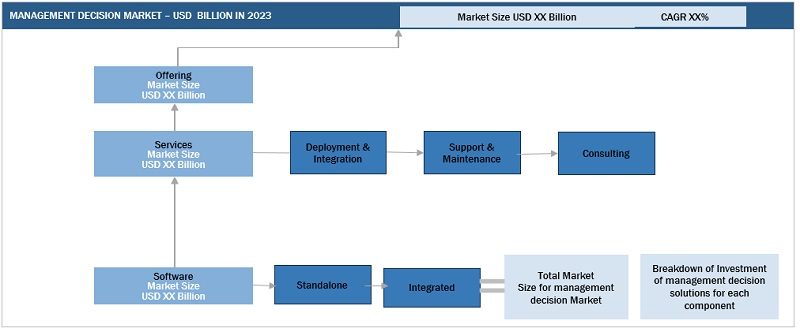
This research report categorizes the management decision market based on offering, functions, deployment model, organization size, vertical, and region.

Based on the Offering:
  • Software
    • Standalone
    • Integrated
  • Services
    • Deployment and Integration
    • Support and Maintenance
    • Consulting
Based on the Application:
Based on the vertical:
  • BFSI
  • Telecom
  • IT & ITES
  • Manufacturing
  • Retail and Consumer Goods
  • Government
  • Healthcare and Life Sciences
  • Energy and Utilities
  • Transportation and Logistics
  • Other Verticals
Based on the region:
  • North America
    • US
    • Canada
  • Europe
    • UK
    • Germany
    • Italy
    • Spain
    • France
    • Rest of Europe
  • Asia Pacific
    • China
    • Japan
    • India
    • Australia and New Zealand (ANZ)
    • Rest of Asia Pacific
  • Middle East & Africa
    • Kingdom of Saudi Arabia
    • UAE
    • South Africa
    • Rest of Middle East & Africa
  • Latin America
    • Brazil
    • Mexico
    • Rest of Latin America

Recent Developments

  • In June 2023, IBM added new features to Operational Decision Manager (ODM). The supported versions of key software components have been updated, enhancing ODM's compatibility and performance. Operational Decision Manager containers now have the RuntimeDefault seccomp profile enabled by default. This profile specifies a predefined list of system calls that can be executed within the container.
  • In June 2023, FICO, a global analytic software company and recognized leader in AI decisioning platforms, and Belvo, the leading open finance data and payments platform in Latin America, announced a strategic partnership to expand credit access in Latin America. The two firms are developing an interpretable and explainable machine learning model that will provide a customer score based on consumer-permission transaction-level data aimed at increasing consumer credit access, improving banks’ risk management, and empowering lenders to create personalized financial experiences for their customers.
  • In June 2023, the latest edition of the Pega Infinity™ software suite introduces new features to enhance low-code development, optimize existing processes, and deliver seamless experiences for employees and customers. These capabilities are designed to support organizations’ journey toward becoming autonomous enterprises. The software suite enables businesses to innovate rapidly, boost productivity, personalize customer interactions, and streamline operations, leading to cost reduction and decreased manual efforts. By leveraging these advancements, organizations can achieve greater efficiency and effectiveness in their operations while delivering enhanced customer experiences.
  • In May 2023, FICO launched 19 major enhancements to the FICO Platform, the leading applied intelligence platform in the market, that helps clients drive critical and strategic business outcomes across their customer lifecycle.
  • In February 2023, SAS Decision Manager 5.2, integrated with SAS Viya 3.4, introduced several new features and enhancements to enhance decision-making capabilities. Users can now utilize data grid variables within rules, providing greater flexibility in decision logic. Custom DS2 code files can be added and edited directly in decisions, enabling users to leverage custom code. The integration of analytic store models allows users to include them in decisions and publish them to various platforms like SAS Cloud Analytic Services, Apache Hadoop, SAS Micro Analytic Service, and Teradata.

Frequently Asked Questions (FAQ):

To speak to our analyst for a discussion on the above findings, click Speak to Analyst

TABLE OF CONTENTS
 
1 INTRODUCTION (Page No. - 36)
    1.1 STUDY OBJECTIVES 
    1.2 MARKET DEFINITION 
           1.2.1 INCLUSIONS AND EXCLUSIONS
    1.3 STUDY SCOPE 
           1.3.1 MARKET SEGMENTATION
           1.3.2 REGIONS COVERED
    1.4 YEARS CONSIDERED 
    1.5 CURRENCY CONSIDERED 
           TABLE 1 USD EXCHANGE RATES, 2020–2022
    1.6 STAKEHOLDERS 
    1.7 RECESSION IMPACT 
    1.8 SUMMARY OF CHANGES 
 
2 RESEARCH METHODOLOGY (Page No. - 41)
    2.1 RESEARCH DATA 
           FIGURE 1 RESEARCH DESIGN
           2.1.1 SECONDARY DATA
                    2.1.1.1 Key data from secondary sources
           2.1.2 PRIMARY DATA
                    2.1.2.1 List of key primary interview participants
                    2.1.2.2 Breakup of primary profiles
                               FIGURE 2 BREAKUP OF PRIMARY INTERVIEWS: BY COMPANY TYPE, DESIGNATION, AND REGION
                    2.1.2.3 Key data from primary sources
                    2.1.2.4 Key industry insights
    2.2 DATA TRIANGULATION 
           FIGURE 3 DATA TRIANGULATION
    2.3 MARKET SIZE ESTIMATION 
           FIGURE 4 MANAGEMENT DECISION MARKET: TOP-DOWN AND BOTTOM-UP APPROACHES
           FIGURE 5 MARKET SIZE ESTIMATION METHODOLOGY – APPROACH 1 (SUPPLY SIDE): REVENUE OF SERVICES OFFERED BY VENDORS
           FIGURE 6 MARKET SIZE ESTIMATION METHODOLOGY – BOTTOM-UP APPROACH (SUPPLY SIDE): COLLECTIVE REVENUE OF VENDORS
           FIGURE 7 MARKET SIZE ESTIMATION METHODOLOGY (SUPPLY SIDE): ILLUSTRATION OF VENDOR REVENUE ESTIMATION
           FIGURE 8 MARKET SIZE ESTIMATION METHODOLOGY – APPROACH 2 (BOTTOM-UP): REVENUE GENERATED BY VENDORS FROM SOFTWARE AND SERVICES
           FIGURE 9 MARKET SIZE ESTIMATION METHODOLOGY – APPROACH 2 (DEMAND SIDE): REVENUE GENERATED BY KEY VENDORS
    2.4 RESEARCH ASSUMPTIONS 
    2.5 LIMITATIONS AND RISK ASSESSMENT 
    2.6 RECESSION IMPACT ANALYSIS 
 
3 EXECUTIVE SUMMARY (Page No. - 53)
    FIGURE 10 MANAGEMENT DECISION MARKET, 2023–2028 (USD MILLION) 
    FIGURE 11 MARKET, BY OFFERING, 2023 VS. 2028 (USD MILLION) 
    FIGURE 12 MARKET, BY VERTICAL, 2023 VS. 2028 (USD MILLION) 
    FIGURE 13 MARKET: REGIONAL SHARE 
 
4 PREMIUM INSIGHTS (Page No. - 57)
    4.1 ATTRACTIVE OPPORTUNITIES FOR PLAYERS IN MANAGEMENT DECISION MARKET 
           FIGURE 14 RISING GLOBAL TREND OF AUTOMATION AND INTELLIGENT DECISIONING ACROSS GLOBE TO DRIVE MARKET
    4.2 NORTH AMERICA: MARKET, BY OFFERING AND KEY VERTICAL 
           FIGURE 15 SOFTWARE AND BFSI SEGMENTS TO ACCOUNT FOR SIGNIFICANT SHARE IN 2023
    4.3 ASIA PACIFIC: MARKET, BY OFFERING AND KEY VERTICAL 
           FIGURE 16 SOFTWARE AND BFSI SEGMENTS TO ACCOUNT FOR SIGNIFICANT SHARE IN 2023
    4.4 EUROPE: MARKET, BY OFFERING AND KEY VERTICAL 
           FIGURE 17 SOFTWARE AND BFSI SEGMENTS TO ACCOUNT FOR SIGNIFICANT SHARE IN 2023
    4.5 MARKET: GEOGRAPHICAL SNAPSHOT 
           FIGURE 18 ASIA PACIFIC TO ACHIEVE HIGHEST GROWTH DURING FORECAST PERIOD
 
5 MARKET OVERVIEW AND INDUSTRY TRENDS (Page No. - 60)
    5.1 INTRODUCTION 
    5.2 MARKET DYNAMICS 
           FIGURE 19 MANAGEMENT DECISION MARKET: DRIVERS, RESTRAINTS, OPPORTUNITIES, AND CHALLENGES
           5.2.1 DRIVERS
                    5.2.1.1 Increasing integration of AI to automate decision-making process
                    5.2.1.2 Rising need to improve quality of decisions and achieve business agility
                               FIGURE 20 MAJOR BENEFITS DRIVING MARKET
                    5.2.1.3 Growing focus on nurturing faster operational decision-making and improved process efficiency
                    5.2.1.4 Demand for reduced dependency on IT teams
                    5.2.1.5 Rising need for companies to manage regulatory and compliance standards
           5.2.2 RESTRAINTS
                    5.2.2.1 Resistance of middle management
                    5.2.2.2 Rising mistrust of companies regarding adoption of new technologies
           5.2.3 OPPORTUNITIES
                    5.2.3.1 Growing trend of automation and intelligent decision-making
                               FIGURE 21 CHALLENGES IN ADOPTING AI AND ML TECHNOLOGIES INTO EXISTING BANKING OPERATIONS
                               FIGURE 22 BENEFITS ACHIEVED FROM ADOPTING AI AND ML TECHNOLOGIES
                    5.2.3.2 Focus of players on data-driven insights
                    5.2.3.3 Inclination of organizations toward decision-making with predictive analytics
           5.2.4 CHALLENGES
                    5.2.4.1 Insufficient documentation
                    5.2.4.2 Lack of skilled workforce
    5.3 HISTORY OF MANAGEMENT DECISION MARKET 
           5.3.1 EARLY APPROACH
           5.3.2 SCIENTIFIC MANAGEMENT
           5.3.3 ADMINISTRATIVE MANAGEMENT
           5.3.4 DECISION SUPPORT SYSTEMS
           5.3.5 MANAGEMENT INFORMATION SYSTEMS
           5.3.6 ENTERPRISE RESOURCE PLANNING
           5.3.7 INTEGRATED DECISION SUPPORT
    5.4 ECOSYSTEM ANALYSIS 
           FIGURE 23 EVOLUTION OF MARKET
           FIGURE 24 ECOSYSTEM MAP
           5.4.1 SOLUTION PROVIDERS
           5.4.2 SERVICE PROVIDERS
           5.4.3 SYSTEM INTEGRATORS
           5.4.4 DATA SOURCES AND PARTNERS
           5.4.5 TECHNOLOGY & CLOUD INFRASTRUCTURE PROVIDERS
           5.4.6 END USERS
                    TABLE 2 ROLE OF PLAYERS IN MARKET ECOSYSTEM
    5.5 CASE STUDY ANALYSIS 
           5.5.1 MERCURY INSURANCE ADOPTED FICO’S MANAGEMENT DECISION SOLUTIONS TO ACCELERATE UNDERWRITING PROCESS
           5.5.2 ABBVIE ADOPTED PEGASYSTEM’S MANAGEMENT DECISION SOLUTIONS TO ENHANCE CUSTOMER EXPERIENCE
           5.5.3 SÜDLEASING USED ACTICO’S CREDIT RISK MANAGEMENT PLATFORM TO ACHIEVE EFFICIENT CREDIT DECISION
           5.5.4 BAJAJ FINANCE EMPLOYED ACTICO’S RULES TO ACHIEVE SIGNIFICANT IMPROVEMENT IN BUSINESS PROCESSES
           5.5.5 T-MOBILE ADOPTED PEGASYSTEM’S SOLUTIONS TO ESTABLISH TEAM OF EXPERTS TO HANDLE CUSTOMER ISSUES
    5.6 VALUE CHAIN ANALYSIS 
           FIGURE 25 VALUE CHAIN ANALYSIS
    5.7 PATENT ANALYSIS 
           TABLE 3 PATENTS FILED, 2018–2023
           TABLE 4 TOP 10 PATENT OWNERS IN MANAGEMENT DECISION MARKET, 2018–2023
           FIGURE 26 TOTAL NUMBER OF PATENTS GRANTED ANNUALLY, 2018–2023
           FIGURE 27 TOP 10 COMPANIES WITH HIGHEST NUMBER OF PATENT APPLICATIONS
           TABLE 5 LIST OF PATENTS GRANTED, 2018–2023
    5.8 TRENDS AND DISRUPTIONS IMPACTING BUYERS 
           FIGURE 28 TRENDS AND DISRUPTIONS IMPACTING BUYERS
    5.9 PORTER’S FIVE FORCES ANALYSIS 
           TABLE 6 PORTER’S FIVE FORCES ANALYSIS
           FIGURE 29 PORTER’S FIVE FORCES ANALYSIS
           5.9.1 THREAT OF NEW ENTRANTS
           5.9.2 THREAT OF SUBSTITUTES
           5.9.3 BARGAINING POWER OF SUPPLIERS
           5.9.4 BARGAINING POWER OF BUYERS
           5.9.5 INTENSITY OF COMPETITIVE RIVALRY
    5.10 REGULATORY LANDSCAPE 
           TABLE 7 NORTH AMERICA: LIST OF REGULATORY BODIES, GOVERNMENT AGENCIES, AND OTHER ORGANIZATIONS
           TABLE 8 EUROPE: LIST OF REGULATORY BODIES, GOVERNMENT AGENCIES, AND OTHER ORGANIZATIONS
           TABLE 9 ASIA PACIFIC: LIST OF REGULATORY BODIES, GOVERNMENT AGENCIES, AND OTHER ORGANIZATIONS
           TABLE 10 MIDDLE EAST & AFRICA: LIST OF REGULATORY BODIES, GOVERNMENT AGENCIES, AND OTHER ORGANIZATIONS
           TABLE 11 LATIN AMERICA: LIST OF REGULATORY BODIES, GOVERNMENT AGENCIES, AND OTHER ORGANIZATIONS
           5.10.1 GENERAL DATA PROTECTION REGULATION
           5.10.2 INTERNATIONAL ORGANIZATION FOR STANDARDIZATION (ISO)/INTERNATIONAL ELECTROTECHNICAL COMMISSION (IEC) 27000 STANDARDS
           5.10.3 CLOUD SECURITY ALLIANCE (CSA)
           5.10.4 HEALTH INSURANCE PORTABILITY AND ACCOUNTABILITY ACT, 1996
           5.10.5 FEDERAL FINANCIAL INSTITUTIONS EXAMINATION COUNCIL (FFIEC)
    5.11 KEY STAKEHOLDERS AND BUYING CRITERIA 
           5.11.1 KEY STAKEHOLDERS IN BUYING PROCESS
                    FIGURE 30 INFLUENCE OF STAKEHOLDERS ON BUYING PROCESS
                    TABLE 12 INFLUENCE OF STAKEHOLDERS ON BUYING PROCESS
           5.11.2 BUYING CRITERIA
                    FIGURE 31 KEY BUYING CRITERIA
                    TABLE 13 BUYING CRITERIA, BY KEY VERTICAL
    5.12 TECHNOLOGY ANALYSIS 
           5.12.1 CLOUD/SOFTWARE-AS-A-SERVICE
           5.12.2 ARTIFICIAL INTELLIGENCE
           5.12.3 MACHINE LEARNING
           5.12.4 ROBOTIC PROCESS AUTOMATION
           5.12.5 IOT
    5.13 PRICING ANALYSIS 
           5.13.1 AVERAGE SELLING PRICE OF MAJOR OFFERINGS, BY KEY PLAYER
                    TABLE 14 PRICING MODELS AND INDICATIVE PRICE POINTS, 2022–2023
    5.14 KEY CONFERENCES & EVENTS 
                    TABLE 15 KEY CONFERENCES & EVENTS, 2023–2024
    5.15 BEST PRACTICES IN MANAGEMENT DECISION MARKET 
    5.16 FUTURE DIRECTION OF MARKET 
           5.16.1 MARKET ROADMAP
                    5.16.1.1 Short-term (2023–2025)
                    5.16.1.2 Mid-term (2026–2028)
                    5.16.1.3 Long-term (2029–2030)
 
6 MANAGEMENT DECISION MARKET, BY OFFERING (Page No. - 95)
    6.1 INTRODUCTION 
           6.1.1 OFFERINGS: MARKET DRIVERS
                    FIGURE 32 SERVICES SEGMENT TO GROW AT HIGHER CAGR DURING FORECAST PERIOD
                    TABLE 16 MARKET, BY OFFERING, 2018–2022 (USD MILLION)
                    TABLE 17 MARKET, BY OFFERING, 2023–2028 (USD MILLION)
    6.2 SOFTWARE 
           6.2.1 GROWING DEMAND FOR COST-EFFECTIVE MANAGEMENT DECISION SOLUTIONS TO DRIVE MARKET
                    TABLE 18 SOFTWARE: MARKET, BY REGION, 2018–2022 (USD MILLION)
                    TABLE 19 SOFTWARE: MARKET, BY REGION, 2023–2028 (USD MILLION)
           6.2.2 STANDALONE
           6.2.3 INTEGRATED
    6.3 SERVICES 
           6.3.1 FOCUS ON DEPLOYING RIGHT SOLUTIONS TO IMPROVE OPERATIONAL EFFICIENCY TO BOOST GROWTH
                    FIGURE 33 CONSULTING SEGMENT TO ACHIEVE HIGHEST GROWTH DURING FORECAST PERIOD
                    TABLE 20 SERVICES: MARKET, BY REGION, 2018–2022 (USD MILLION)
                    TABLE 21 SERVICES: MARKET, BY REGION, 2023–2028 (USD MILLION)
                    TABLE 22 MARKET, BY SERVICE, 2018–2022 (USD MILLION)
                    TABLE 23 MARKET, BY SERVICE, 2023–2028 (USD MILLION)
           6.3.2 DEPLOYMENT & INTEGRATION
           6.3.3 SUPPORT & MAINTENANCE
           6.3.4 CONSULTING
 
7 MANAGEMENT DECISION MARKET, BY APPLICATION (Page No. - 102)
    7.1 INTRODUCTION 
           7.1.1 APPLICATIONS: MARKET DRIVERS
                    FIGURE 34 FRAUD DETECTION MANAGEMENT SEGMENT TO GROW AT HIGHEST CAGR DURING FORECAST PERIOD
                    TABLE 24 MARKET, BY APPLICATION, 2018–2022 (USD MILLION)
                    TABLE 25 MARKET, BY APPLICATION, 2023–2028 (USD MILLION)
    7.2 COLLECTION MANAGEMENT 
           7.2.1 NEED FOR COMPANIES TO MANAGE AND TRACK CUSTOMER DEBT TO PROPEL GROWTH
                    TABLE 26 COLLECTION MANAGEMENT: MARKET, BY REGION, 2018–2022 (USD MILLION)
                    TABLE 27 COLLECTION MANAGEMENT: MARKET, BY REGION, 2023–2028 (USD MILLION)
    7.3 CUSTOMER EXPERIENCE MANAGEMENT 
           7.3.1 GROWING EMPHASIS ON UNDERSTANDING CUSTOMER EXPECTATIONS AND IMPROVING SERVICES TO PROPEL MARKET
                    TABLE 28 CUSTOMER EXPERIENCE MANAGEMENT: MARKET, BY REGION, 2018–2022 (USD MILLION)
                    TABLE 29 CUSTOMER EXPERIENCE MANAGEMENT: MARKET, BY REGION, 2023–2028 (USD MILLION)
    7.4 FRAUD DETECTION MANAGEMENT 
           7.4.1 GLOBAL RISE IN INCIDENTS OF FRAUD TO DRIVE USE OF FRAUD DETECTION MANAGEMENT SOLUTIONS
                    TABLE 30 FRAUD DETECTION MANAGEMENT: MANAGEMENT DECISION MARKET, BY REGION, 2018–2022 (USD MILLION)
                    TABLE 31 FRAUD DETECTION MANAGEMENT: MARKET, BY REGION, 2023–2028 (USD MILLION)
    7.5 PRICING OPTIMIZATION 
           7.5.1 RISING FOCUS ON ENHANCING CROSS-BORDER SALES ACROSS MULTIPLE GEOGRAPHIES TO ENCOURAGE MARKET EXPANSION
                    TABLE 32 PRICING OPTIMIZATION: MARKET, BY REGION, 2018–2022 (USD MILLION)
                    TABLE 33 PRICING OPTIMIZATION: MARKET, BY REGION, 2023–2028 (USD MILLION)
    7.6 CREDIT RISK MANAGEMENT 
           7.6.1 RISING DEMAND FOR ROBUST CREDIT RISK MANAGEMENT STRATEGIES TO DRIVE MARKET
                    TABLE 34 CREDIT RISK MANAGEMENT: MARKET, BY REGION, 2018–2022 (USD MILLION)
                    TABLE 35 CREDIT RISK MANAGEMENT: MARKET, BY REGION, 2023–2028 (USD MILLION)
    7.7 OTHER APPLICATIONS 
           TABLE 36 OTHER APPLICATIONS: MARKET, BY REGION, 2018–2022 (USD MILLION)
           TABLE 37 OTHER APPLICATIONS: MARKET, BY REGION, 2023–2028 (USD MILLION)
 
8 MANAGEMENT DECISION MARKET, BY VERTICAL (Page No. - 111)
    8.1 INTRODUCTION 
           8.1.1 VERTICALS: MARKET DRIVERS
                    FIGURE 35 ENERGY & UTILITIES SEGMENT TO ACHIEVE HIGHEST GROWTH DURING FORECAST PERIOD
                    TABLE 38 MARKET, BY VERTICAL, 2018–2022 (USD MILLION)
                    TABLE 39 MARKET, BY VERTICAL, 2023–2028 (USD MILLION)
    8.2 BANKING, FINANCIAL SERVICES, AND INSURANCE (BFSI) 
           8.2.1 RAPID DIGITAL TRANSFORMATION AND CHANGING REGULATORY REQUIREMENTS TO DRIVE POPULARITY OF MANAGEMENT DECISION SOLUTIONS IN BFSI SECTOR
                    TABLE 40 BFSI: MARKET, BY REGION, 2018–2022 (USD MILLION)
                    TABLE 41 BFSI: MARKET, BY REGION, 2023–2028 (USD MILLION)
           8.2.2 BFSI: MARKET USE CASES
                    8.2.2.1 Banco de Crédito del Perú adopted FICO’s management decision solutions to achieve performance goals
                    8.2.2.2 BanReservas utilized FICO’s automation solutions to standardize credit evaluations, lower expenses, and enhance customer satisfaction
    8.3 RETAIL & CONSUMER GOODS 
           8.3.1 GROWING NEED TO MANAGE ENORMOUS VOLUME OF CUSTOMER DATA AND INVENTORY TO BOOST MARKET
                    TABLE 42 RETAIL & CONSUMER GOODS: MANAGEMENT DECISION MARKET, BY REGION, 2018–2022 (USD MILLION)
                    TABLE 43 RETAIL & CONSUMER GOODS: MARKET, BY REGION, 2023–2028 (USD MILLION)
           8.3.2 RETAIL & CONSUMER GOODS: MARKET USE CASES
                    8.3.2.1 Apero Solutions integrated its latest OpenEdge features into Latitude EFR to improve user interface
    8.4 TELECOM 
           8.4.1 INCREASING FOCUS ON ANALYZING CUSTOMER INTERACTIONS TO DRIVE MARKET
                    TABLE 44 TELECOM: MARKET, BY REGION, 2018–2022 (USD MILLION)
                    TABLE 45 TELECOM: MARKET, BY REGION, 2023–2028 (USD MILLION)
           8.4.2 TELECOM: MARKET USE CASES
                    8.4.2.1 Power & Telephone Supply Company adopted Telerik Platform to integrate mobile app development into its strategy
                    8.4.2.2 TELUS adopted FICO’s solutions to facilitate customer onboarding procedures
    8.5 IT & ITES 
           8.5.1 RAPID AUTOMATION AND RISING NEED TO ESTABLISH EFFECTIVE RISK MANAGEMENT SYSTEMS TO BOOST DEMAND FOR MANAGEMENT DECISION SOLUTIONS
                    TABLE 46 IT & ITES: MARKET, BY REGION, 2018–2022 (USD MILLION)
                    TABLE 47 IT & ITES: MARKET, BY REGION, 2023–2028 (USD MILLION)
           8.5.2 IT & ITES: MARKET USE CASES
                    8.5.2.1 Build.One adopted Progress’s OpenEdge to efficiently develop contemporary web applications
    8.6 HEALTHCARE & LIFE SCIENCES 
           8.6.1 GROWING EMPHASIS ON ENHANCING PATIENT EXPERIENCE TO DRIVE ADOPTION OF MANAGEMENT DECISION SOFTWARE AND SERVICES
                    TABLE 48 HEALTHCARE & LIFE SCIENCES: MANAGEMENT DECISION MARKET, BY REGION, 2018–2022 (USD MILLION)
                    TABLE 49 HEALTHCARE & LIFE SCIENCES: MARKET, BY REGION, 2023–2028 (USD MILLION)
           8.6.2 HEALTHCARE & LIFE SCIENCES: MARKET USE CASES
                    8.6.2.1 Bradesco Saúde partnered with Pega and Ernst & Young to digitally transform processes
                    8.6.2.2 Sked24 employed cutting-edge technology to transform patient-provider interactions into enduring relationships
    8.7 MANUFACTURING 
           8.7.1 DEMAND TO IMPROVE OPERATIONAL EFFICIENCY AND MANAGE SUPPLY CHAIN TO PROPEL GROWTH
                    TABLE 50 MANUFACTURING: MARKET, BY REGION, 2018–2022 (USD MILLION)
                    TABLE 51 MANUFACTURING: MARKET, BY REGION, 2023–2028 (USD MILLION)
           8.7.2 MANUFACTURING: MARKET USE CASES
                    8.7.2.1 Kubota Tractor Corporation partnered with Team SI to establish consistent brand experience and streamline infrastructure management
    8.8 GOVERNMENT 
           8.8.1 INCREASING ADOPTION OF TECHNOLOGY IN GOVERNMENT ORGANIZATIONS TO DRIVE MARKET
                    TABLE 52 GOVERNMENT: MARKET, BY REGION, 2018–2022 (USD MILLION)
                    TABLE 53 GOVERNMENT: MARKET, BY REGION, 2023–2028 (USD MILLION)
           8.8.2 GOVERNMENT: MARKET USE CASES
                    8.8.2.1 California Department of Public Health adopted Pega’s licensing programs to enhance customer experience
                    8.8.2.2 Jungle Lasers adopted Progress Rollbase Development Platform to achieve expedited time-to-market and business growth
                    8.8.2.3 National Physiatry Academy adopted Sitefinity’s content organization solutions to enhance customer experience and workflow efficiency
    8.9 TRANSPORTATION & LOGISTICS 
           8.9.1 RISING DEMAND FOR MANAGEMENT DECISION SOLUTIONS TO OPTIMIZE OPERATIONS TO PROPEL MARKET
                    TABLE 54 TRANSPORTATION & LOGISTICS: MANAGEMENT DECISION MARKET, BY REGION, 2018–2022 (USD MILLION)
                    TABLE 55 TRANSPORTATION & LOGISTICS: MARKET, BY REGION, 2023–2028 (USD MILLION)
           8.9.2 TRANSFORMATION & LOGISTICS: MARKET USE CASES
                    8.9.2.1 SA Taxi adopted FICO’s Decision Modeler to incorporate automated decision-making into its loan origination processes
    8.10 ENERGY & UTILITIES 
           8.10.1 RISING NEED TO LEVERAGE ADVANCED DECISIONING CAPABILITIES TO DRIVE MARKET
                    TABLE 56 ENERGY & UTILITIES: MARKET, BY REGION, 2018–2022 (USD MILLION)
                    TABLE 57 ENERGY & UTILITIES: MARKET, BY REGION, 2023–2028 (USD MILLION)
           8.10.2 ENERGY & UTILITIES: MARKET USE CASES
                    8.10.2.1 Cleco utilized Progress Sitefinity’s solutions to enhance its performance in various categories essential for measuring overall customer satisfaction
    8.11 OTHER VERTICALS 
                    TABLE 58 OTHER VERTICALS: MARKET, BY REGION, 2018–2022 (USD MILLION)
                    TABLE 59 OTHER VERTICALS: MARKET, BY REGION, 2023–2028 (USD MILLION)
 
9 MANAGEMENT DECISION MARKET, BY REGION (Page No. - 129)
    9.1 INTRODUCTION 
           FIGURE 36 MARKET: REGIONAL SNAPSHOT
           FIGURE 37 ASIA PACIFIC TO ACHIEVE HIGHEST CAGR DURING FORECAST PERIOD
           TABLE 60 MARKET, BY REGION, 2018–2022 (USD MILLION)
           TABLE 61 MARKET, BY REGION, 2023–2028 (USD MILLION)
    9.2 NORTH AMERICA 
           9.2.1 NORTH AMERICA: MARKET DRIVERS
           9.2.2 NORTH AMERICA: RECESSION IMPACT
                    FIGURE 38 NORTH AMERICA: MANAGEMENT DECISION MARKET SNAPSHOT
                    TABLE 62 NORTH AMERICA: MARKET, BY OFFERING, 2018–2022 (USD MILLION)
                    TABLE 63 NORTH AMERICA: MARKET, BY OFFERING, 2023–2028 (USD MILLION)
                    TABLE 64 NORTH AMERICA: MARKET, BY APPLICATION, 2018–2022 (USD MILLION)
                    TABLE 65 NORTH AMERICA: MARKET, BY APPLICATION, 2023–2028 (USD MILLION)
                    TABLE 66 NORTH AMERICA: MARKET, BY VERTICAL, 2018–2022 (USD MILLION)
                    TABLE 67 NORTH AMERICA: MARKET, BY VERTICAL, 2023–2028 (USD MILLION)
                    TABLE 68 NORTH AMERICA: MARKET, BY SERVICE, 2018–2022 (USD MILLION)
                    TABLE 69 NORTH AMERICA: MARKET, BY SERVICE, 2023–2028 (USD MILLION)
                    TABLE 70 NORTH AMERICA: MARKET, BY COUNTRY, 2018–2022 (USD MILLION)
                    TABLE 71 NORTH AMERICA: MARKET, BY COUNTRY, 2023–2028 (USD MILLION)
                    FIGURE 39 NORTH AMERICA: COUNTRY-WISE ANALYSIS
           9.2.3 US
                    9.2.3.1 Rising adoption of cloud-based services to boost demand for management decision solutions
                               TABLE 72 US: MANAGEMENT DECISION MARKET, BY OFFERING, 2018–2022 (USD MILLION)
                               TABLE 73 US: MARKET, BY OFFERING, 2023–2028 (USD MILLION)
                               TABLE 74 US: MARKET, BY APPLICATION, 2018–2022 (USD MILLION)
                               TABLE 75 US: MARKET, BY APPLICATION, 2023–2028 (USD MILLION)
                               TABLE 76 US: MARKET, BY VERTICAL, 2018–2022 (USD MILLION)
                               TABLE 77 US: MARKET, BY VERTICAL, 2023–2028 (USD MILLION)
           9.2.4 CANADA
                    9.2.4.1 Rapid cloud adoption and digital transformation to propel market
                               TABLE 78 CANADA: MANAGEMENT DECISION MARKET, BY OFFERING, 2018–2022 (USD MILLION)
                               TABLE 79 CANADA: MARKET, BY OFFERING, 2023–2028 (USD MILLION)
                               TABLE 80 CANADA: MARKET, BY APPLICATION, 2018–2022 (USD MILLION)
                               TABLE 81 CANADA: MARKET, BY APPLICATION, 2023–2028 (USD MILLION)
                               TABLE 82 CANADA: MARKET, BY VERTICAL, 2018–2022 (USD MILLION)
                               TABLE 83 CANADA: MARKET, BY VERTICAL, 2023–2028 (USD MILLION)
    9.3 EUROPE 
           9.3.1 EUROPE: MARKET DRIVERS
           9.3.2 EUROPE: RECESSION IMPACT
                    TABLE 84 EUROPE: MANAGEMENT DECISION MARKET, BY OFFERING, 2018–2022 (USD MILLION)
                    TABLE 85 EUROPE: MARKET, BY OFFERING, 2023–2028 (USD MILLION)
                    TABLE 86 EUROPE: MARKET, BY APPLICATION, 2018–2022 (USD MILLION)
                    TABLE 87 EUROPE: MARKET, BY APPLICATION, 2023–2028 (USD MILLION)
                    TABLE 88 EUROPE: MARKET, BY VERTICAL, 2018–2022 (USD MILLION)
                    TABLE 89 EUROPE: MARKET, BY VERTICAL, 2023–2028 (USD MILLION)
                    TABLE 90 EUROPE: MARKET, BY SERVICE, 2018–2022 (USD MILLION)
                    TABLE 91 EUROPE: MARKET, BY SERVICE, 2023–2028 (USD MILLION)
                    FIGURE 40 EUROPE: COUNTRY-WISE ANALYSIS
                    TABLE 92 EUROPE: MARKET, BY COUNTRY, 2018–2022 (USD MILLION)
                    TABLE 93 EUROPE: MARKET, BY COUNTRY, 2023–2028 (USD MILLION)
           9.3.3 UK
                    9.3.3.1 Adoption of advanced IT infrastructure and continued transition toward online services to drive market
                               TABLE 94 UK: MANAGEMENT DECISION MARKET, BY OFFERING, 2018–2022 (USD MILLION)
                               TABLE 95 UK: MARKET, BY OFFERING, 2023–2028 (USD MILLION)
                               TABLE 96 UK: MARKET, BY APPLICATION, 2018–2022 (USD MILLION)
                               TABLE 97 UK: MARKET, BY APPLICATION, 2023–2028 (USD MILLION)
                               TABLE 98 UK: MARKET, BY VERTICAL, 2018–2022 (USD MILLION)
                               TABLE 99 UK: MARKET, BY VERTICAL, 2023–2028 (USD MILLION)
           9.3.4 GERMANY
                    9.3.4.1 Government initiatives for technological developments in manufacturing sector to drive growth
                               TABLE 100 GERMANY: MANAGEMENT DECISION MARKET, BY OFFERING, 2018–2022 (USD MILLION)
                               TABLE 101 GERMANY: MARKET, BY OFFERING, 2023–2028 (USD MILLION)
                               TABLE 102 GERMANY: MARKET, BY APPLICATION, 2018–2022 (USD MILLION)
                               TABLE 103 GERMANY: MARKET, BY APPLICATION, 2023–2028 (USD MILLION)
                               TABLE 104 GERMANY: MARKET, BY VERTICAL, 2018–2022 (USD MILLION)
                               TABLE 105 GERMANY: MARKET, BY VERTICAL, 2023–2028 (USD MILLION)
           9.3.5 FRANCE
                    9.3.5.1 Stringent regulations to detect and prevent financial crimes to boost market expansion
           9.3.6 ITALY
                    9.3.6.1 Increasing recognition of value of technology to boost adoption of management decision solutions
           9.3.7 SPAIN
                    9.3.7.1 Growing demand for data-driven insights to drive growth
           9.3.8 REST OF EUROPE
    9.4 ASIA PACIFIC 
           9.4.1 ASIA PACIFIC: MARKET DRIVERS
           9.4.2 ASIA PACIFIC: RECESSION IMPACT
                    FIGURE 41 ASIA PACIFIC: MANAGEMENT DECISION MARKET SNAPSHOT
                    TABLE 106 ASIA PACIFIC: MARKET, BY OFFERING, 2018–2022 (USD MILLION)
                    TABLE 107 ASIA PACIFIC: MARKET, BY OFFERING, 2023–2028 (USD MILLION)
                    TABLE 108 ASIA PACIFIC: MARKET, BY APPLICATION, 2018–2022 (USD MILLION)
                    TABLE 109 ASIA PACIFIC: MARKET, BY APPLICATION, 2023–2028 (USD MILLION)
                    TABLE 110 ASIA PACIFIC: MARKET, BY VERTICAL, 2018–2022 (USD MILLION)
                    TABLE 111 ASIA PACIFIC: MARKET, BY VERTICAL, 2023–2028 (USD MILLION)
                    TABLE 112 ASIA PACIFIC: MARKET, BY SERVICE, 2018–2022 (USD MILLION)
                    TABLE 113 ASIA PACIFIC: MARKET, BY SERVICE, 2023–2028 (USD MILLION)
                    FIGURE 42 ASIA PACIFIC: COUNTRY-WISE ANALYSIS
                    TABLE 114 ASIA PACIFIC: MARKET, BY COUNTRY, 2018–2022 (USD MILLION)
                    TABLE 115 ASIA PACIFIC: MARKET, BY COUNTRY, 2023–2028 (USD MILLION)
           9.4.3 CHINA
                    9.4.3.1 Use of decision intelligence services for driving policy support and technological investments to fuel growth
                               TABLE 116 CHINA: MANAGEMENT DECISION MARKET, BY OFFERING, 2018–2022 (USD MILLION)
                               TABLE 117 CHINA: MARKET, BY OFFERING, 2023–2028 (USD MILLION)
                               TABLE 118 CHINA: MARKET, BY APPLICATION, 2018–2022 (USD MILLION)
                               TABLE 119 CHINA: MARKET, BY APPLICATION, 2023–2028 (USD MILLION)
                               TABLE 120 CHINA: MARKET, BY VERTICAL, 2018–2022 (USD MILLION)
                               TABLE 121 CHINA: MARKET, BY VERTICAL, 2023–2028 (USD MILLION)
           9.4.4 JAPAN
                    9.4.4.1 Need to facilitate growth of digital economy and cloud computing to drive market
           9.4.5 INDIA
                    9.4.5.1 Focus on enhancing customer experience and driving profitability to boost market
                               TABLE 122 INDIA: MANAGEMENT DECISION MARKET, BY OFFERING, 2018–2022 (USD MILLION)
                               TABLE 123 INDIA: MARKET, BY OFFERING, 2023–2028 (USD MILLION)
                               TABLE 124 INDIA: MARKET, BY APPLICATION, 2018–2022 (USD MILLION)
                               TABLE 125 INDIA: MARKET, BY APPLICATION, 2023–2028 (USD MILLION)
                               TABLE 126 INDIA: MARKET, BY VERTICAL, 2018–2022 (USD MILLION)
                               TABLE 127 INDIA: MARKET, BY VERTICAL, 2023–2028 (USD MILLION)
                               9.4.6 AUSTRALIA & NEW ZEALAND
                    9.4.6.1 Surge in fraud-related attacks to fuel adoption of management decision solutions
           9.4.7 REST OF ASIA PACIFIC
    9.5 MIDDLE EAST & AFRICA 
           9.5.1 MIDDLE EAST & AFRICA: MARKET DRIVERS
           9.5.2 MIDDLE EAST & AFRICA: RECESSION IMPACT
                    TABLE 128 MIDDLE EAST & AFRICA: MANAGEMENT DECISION MARKET, BY OFFERING, 2018–2022 (USD MILLION)
                    TABLE 129 MIDDLE EAST & AFRICA: MARKET, BY OFFERING, 2023–2028 (USD MILLION)
                    TABLE 130 MIDDLE EAST & AFRICA: MARKET, BY APPLICATION, 2018–2022 (USD MILLION)
                    TABLE 131 MIDDLE EAST & AFRICA: MARKET, BY APPLICATION, 2023–2028 (USD MILLION)
                    TABLE 132 MIDDLE EAST & AFRICA: MARKET, BY VERTICAL, 2018–2022 (USD MILLION)
                    TABLE 133 MIDDLE EAST & AFRICA: MARKET, BY VERTICAL, 2023–2028 (USD MILLION)
                    TABLE 134 MIDDLE EAST & AFRICA: MARKET, BY SERVICE, 2018–2022 (USD MILLION)
                    TABLE 135 MIDDLE EAST & AFRICA: MARKET, BY SERVICE, 2023–2028 (USD MILLION)
                    TABLE 136 MIDDLE EAST & AFRICA: MARKET, BY COUNTRY, 2018–2022 (USD MILLION)
                    TABLE 137 MIDDLE EAST & AFRICA: MARKET, BY COUNTRY, 2023–2028 (USD MILLION)
           9.5.3 KSA
                    9.5.3.1 Rapidly changing business environment to drive need for management decision solutions
           9.5.4 UAE
                    9.5.4.1 Growing inclination of people toward advanced technologies to propel market
                               TABLE 138 UAE: MANAGEMENT DECISION MARKET, BY OFFERING, 2018–2022 (USD MILLION)
                               TABLE 139 UAE: MARKET, BY OFFERING, 2023–2028 (USD MILLION)
                               TABLE 140 UAE: MARKET, BY APPLICATION, 2018–2022 (USD MILLION)
                               TABLE 141 UAE: MARKET, BY APPLICATION, 2023–2028 (USD MILLION)
                               TABLE 142 UAE: MARKET, BY VERTICAL, 2018–2022 (USD MILLION)
                               TABLE 143 UAE: MARKET, BY VERTICAL, 2023–2028 (USD MILLION)
           9.5.5 SOUTH AFRICA
                    9.5.5.1 Rapid digitalization and adoption of cloud applications to propel market
           9.5.6 REST OF MIDDLE EAST & AFRICA
    9.6 LATIN AMERICA 
           9.6.1 LATIN AMERICA: MARKET DRIVERS
           9.6.2 LATIN AMERICA: RECESSION IMPACT
                    TABLE 144 LATIN AMERICA: MANAGEMENT DECISION MARKET, BY OFFERING, 2018–2022 (USD MILLION)
                    TABLE 145 LATIN AMERICA: MARKET, BY OFFERING, 2023–2028 (USD MILLION)
                    TABLE 146 LATIN AMERICA: MARKET, BY APPLICATION, 2018–2022 (USD MILLION)
                    TABLE 147 LATIN AMERICA: MARKET, BY APPLICATION, 2023–2028 (USD MILLION)
                    TABLE 148 LATIN AMERICA: MARKET, BY VERTICAL, 2018–2022 (USD MILLION)
                    TABLE 149 LATIN AMERICA: MARKET, BY VERTICAL, 2023–2028 (USD MILLION)
                    TABLE 150 LATIN AMERICA: MARKET, BY SERVICE, 2018–2022 (USD MILLION)
                    TABLE 151 LATIN AMERICA: MARKET, BY SERVICE, 2023–2028 (USD MILLION)
                    TABLE 152 LATIN AMERICA: MARKET, BY COUNTRY, 2018–2022 (USD MILLION)
                    TABLE 153 LATIN AMERICA: MARKET, BY COUNTRY, 2023–2028 (USD MILLION)
           9.6.3 BRAZIL
                    9.6.3.1 Increasing investments by government to boost mobile technologies to drive growth
                               TABLE 154 BRAZIL: MANAGEMENT DECISION MARKET, BY OFFERING, 2018–2022 (USD MILLION)
                               TABLE 155 BRAZIL: MARKET, BY OFFERING, 2023–2028 (USD MILLION)
                               TABLE 156 BRAZIL: MARKET, BY APPLICATION, 2018–2022 (USD MILLION)
                               TABLE 157 BRAZIL: MARKET, BY APPLICATION, 2023–2028 (USD MILLION)
                               TABLE 158 BRAZIL: MARKET, BY VERTICAL, 2018–2022 (USD MILLION)
                               TABLE 159 BRAZIL: MARKET, BY VERTICAL, 2023–2028 (USD MILLION)
           9.6.4 MEXICO
                    9.6.4.1 Availability of technical expertise and high adoption rate of IoT to encourage market expansion
           9.6.5 REST OF LATIN AMERICA
 
10 COMPETITIVE LANDSCAPE (Page No. - 184)
     10.1 OVERVIEW 
     10.2 STRATEGIES ADOPTED BY KEY PLAYERS 
               TABLE 160 STRATEGIES ADOPTED BY KEY PLAYERS
     10.3 MARKET SHARE ANALYSIS FOR KEY PLAYERS 
               TABLE 161 MANAGEMENT DECISION MARKET: INTENSITY OF COMPETITIVE RIVALRY
     10.4 RANKING OF KEY PLAYERS 
               FIGURE 43 RANKING OF KEY PLAYERS, 2023
     10.5 COMPANY EVALUATION MATRIX FOR KEY PLAYERS 
               FIGURE 44 COMPANY EVALUATION MATRIX FOR KEY PLAYERS: CRITERIA WEIGHTAGE
             10.5.1 STARS
             10.5.2 EMERGING LEADERS
             10.5.3 PERVASIVE PLAYERS
             10.5.4 PARTICIPANTS
                       FIGURE 45 COMPANY EVALUATION MATRIX FOR KEY PLAYERS, 2023
     10.6 COMPANY EVALUATION MATRIX FOR STARTUPS/SMES 
               FIGURE 46 COMPANY EVALUATION MATRIX FOR STARTUPS/SMES: CRITERIA WEIGHTAGE
             10.6.1 PROGRESSIVE COMPANIES
             10.6.2 RESPONSIVE COMPANIES
             10.6.3 DYNAMIC COMPANIES
             10.6.4 STARTING BLOCKS
                       FIGURE 47 COMPANY EVALUATION MATRIX FOR STARTUPS/SMES, 2023
     10.7 COMPETITIVE BENCHMARKING 
               TABLE 162 PRODUCT FOOTPRINT WEIGHTAGE
               TABLE 163 COMPETITIVE BENCHMARKING, BY OFFERING, APPLICATION, AND REGION
               TABLE 164 LIST OF STARTUPS/SMES
     10.8 MANAGEMENT DECISION MARKET: PRODUCT BENCHMARKING 
             10.8.1 PROMINENT MANAGEMENT DECISION SOLUTION PROVIDERS
                       10.8.1.1 Parmenides
                       10.8.1.2 TIBCO
                       10.8.1.3 SEON
                                   TABLE 165 COMPARATIVE ANALYSIS OF MANAGEMENT DECISION SOLUTION PROVIDERS
     10.9 VALUATION AND FINANCIAL METRICS OF KEY MANAGEMENT DECISION SOLUTION VENDORS 
               FIGURE 48 VALUATION AND FINANCIAL METRICS OF KEY MANAGEMENT DECISION SOLUTION VENDORS
     10.10 COMPETITIVE SCENARIO 
               10.10.1 PRODUCT LAUNCHES
                                   TABLE 166 PRODUCT LAUNCHES, 2019–2023
               10.10.2 DEALS
                                   TABLE 167 DEALS, 2019–2023
 
11 COMPANY PROFILES (Page No. - 213)
(Business Overview, Products Offered, Recent Developments, MnM View Right to win, Strategic choices made, Weaknesses and competitive threats) *
     11.1 MAJOR PLAYERS 
             11.1.1 IBM
                       TABLE 168 IBM: BUSINESS OVERVIEW
                       FIGURE 49 IBM: COMPANY SNAPSHOT
                       TABLE 169 IBM: PRODUCTS/SOLUTIONS/SERVICES OFFERED
                       TABLE 170 IBM: PRODUCT LAUNCHES
                       TABLE 171 IBM: DEALS
             11.1.2 FICO
                       TABLE 172 FICO: BUSINESS OVERVIEW
                       FIGURE 50 FICO: COMPANY SNAPSHOT
                       TABLE 173 FICO: PRODUCT/SOLUTIONS/SERVICES OFFERED
                       TABLE 174 FICO: PRODUCT LAUNCHES
                       TABLE 175 FICO: DEALS
             11.1.3 SAS
                       TABLE 176 SAS: BUSINESS OVERVIEW
                       TABLE 177 SAS: PRODUCTS/SOLUTIONS/SERVICES OFFERED
                       TABLE 178 SAS: PRODUCT LAUNCHES
                       TABLE 179 SAS: DEALS
             11.1.4 ORACLE
                       TABLE 180 ORACLE: BUSINESS OVERVIEW
                       FIGURE 51 ORACLE: COMPANY SNAPSHOT
                       TABLE 181 ORACLE: PRODUCTS/SOLUTIONS/SERVICES OFFERED
                       TABLE 182 ORACLE: PRODUCT LAUNCHES
                       TABLE 183 ORACLE: DEALS
             11.1.5 PEGASYSTEMS
                       TABLE 184 PEGASYSTEMS: BUSINESS OVERVIEW
                       FIGURE 52 PEGASYSTEMS: COMPANY SNAPSHOT
                       TABLE 185 PEGASYSTEMS: PRODUCTS/SOLUTIONS/SERVICES OFFERED
                       TABLE 186 PEGASYSTEMS: PRODUCT LAUNCHES
                       TABLE 187 PEGASYSTEMS: DEALS
             11.1.6 TIBCO
                       TABLE 188 TIBCO: BUSINESS OVERVIEW
                       TABLE 189 TIBCO: PRODUCTS/SOLUTIONS/SERVICES OFFERED
                       TABLE 190 TIBCO: PRODUCT LAUNCHES
                       TABLE 191 TIBCO: DEALS
             11.1.7 SAPIENS INTERNATIONAL CORPORATION
                       TABLE 192 SAPIENS INTERNATIONAL CORPORATION: BUSINESS OVERVIEW
                       FIGURE 53 SAPIENS INTERNATIONAL CORPORATION: COMPANY SNAPSHOT
                       TABLE 193 SAPIENS INTERNATIONAL CORPORATION: PRODUCTS/SOLUTIONS/SERVICES OFFERED
                       TABLE 194 SAPIENS INTERNATIONAL CORPORATION: PRODUCT LAUNCHES
                       TABLE 195 SAPIENS INTERNATIONAL CORPORATION: DEALS
                       TABLE 196 SAPIENS INTERNATIONAL CORPORATION: OTHERS
             11.1.8 EXPERIAN
                       TABLE 197 EXPERIAN: BUSINESS OVERVIEW
                       FIGURE 54 EXPERIAN: COMPANY SNAPSHOT
                       TABLE 198 EXPERIAN: PRODUCTS/SOLUTIONS/SERVICES OFFERED
                       TABLE 199 EXPERIAN: PRODUCT LAUNCHES
                       TABLE 200 EXPERIAN: DEALS
             11.1.9 EQUIFAX
                       TABLE 201 EQUIFAX: BUSINESS OVERVIEW
                       FIGURE 55 EQUIFAX: COMPANY SNAPSHOT
                       TABLE 202 EQUIFAX: PRODUCTS/SOLUTIONS/SERVICES OFFERED
                       TABLE 203 EQUIFAX: PRODUCT LAUNCHES
                       TABLE 204 EQUIFAX: DEALS
             11.1.10 ACTICO
                       TABLE 205 ACTICO: BUSINESS OVERVIEW
                       TABLE 206 ACTICO: PRODUCTS/SOLUTIONS/SERVICES OFFERED
                       TABLE 207 ACTICO: PRODUCT LAUNCHES
                       TABLE 208 ACTICO: DEALS
             11.1.11 CRIF
             11.1.12 RAPIDGEN
             11.1.13 PROGRESS
             11.1.14 DECISIONS
     11.2 STARTUPS/SMES 
             11.2.1 DECISION MANAGEMENT SOLUTIONS
             11.2.2 OPENRULES
             11.2.3 SPARKLING LOGIC
             11.2.4 SCORTO
             11.2.5 ENOVA DECISIONS
             11.2.6 FLEXRULE
             11.2.7 RULEX
             11.2.8 SEON
             11.2.9 DECISIMO
             11.2.10 INRULE
             11.2.11 PARMENIDES
*Details on Business Overview, Products Offered, Recent Developments, MnM View, Right to win, Strategic choices made, Weaknesses and competitive threats might not be captured in case of unlisted companies.
 
12 ADJACENT AND RELATED MARKETS (Page No. - 277)
     12.1 INTRODUCTION TO ADJACENT MARKETS 
               TABLE 209 ADJACENT MARKETS AND FORECASTS
     12.2 LIMITATIONS 
     12.3 BUSINESS RULE MANAGEMENT SYSTEMS MARKET 
               TABLE 210 BUSINESS RULES MANAGEMENT SYSTEMS MARKET, BY COMPONENT, 2015–2019 (USD THOUSAND)
               TABLE 211 BUSINESS RULES MANAGEMENT SYSTEMS MARKET, BY COMPONENT, 2020–2025 (USD THOUSAND)
               TABLE 212 BUSINESS RULES MANAGEMENT SYSTEMS MARKET, BY ORGANIZATION SIZE, 2015–2019 (USD THOUSAND)
               TABLE 213 BUSINESS RULES MANAGEMENT SYSTEMS MARKET, BY ORGANIZATION SIZE, 2020–2025 (USD THOUSAND)
               TABLE 214 BUSINESS RULES MANAGEMENT SYSTEMS MARKET, BY DEPLOYMENT TYPE, 2015–2019 (USD THOUSAND)
               TABLE 215 BUSINESS RULES MANAGEMENT SYSTEMS MARKET, BY DEPLOYMENT TYPE, 2020–2025 (USD THOUSAND)
               TABLE 216 BUSINESS RULES MANAGEMENT SYSTEMS MARKET, BY VERTICAL, 2015–2019 (USD THOUSAND)
               TABLE 217 BUSINESS RULES MANAGEMENT SYSTEMS MARKET, BY VERTICAL, 2020–2025 (USD THOUSAND)
     12.4 CUSTOMER EXPERIENCE MANAGEMENT MARKET 
               TABLE 218 CUSTOMER EXPERIENCE MANAGEMENT MARKET, BY COMPONENT, 2015–2020 (USD MILLION)
               TABLE 219 CUSTOMER EXPERIENCE MANAGEMENT MARKET, BY COMPONENT, 2021–2026 (USD MILLION)
               TABLE 220 CUSTOMER EXPERIENCE MANAGEMENT MARKET, BY DEPLOYMENT TYPE, 2015–2020 (USD MILLION)
               TABLE 221 CUSTOMER EXPERIENCE MANAGEMENT MARKET, BY DEPLOYMENT TYPE, 2021–2026 (USD MILLION)
               TABLE 222 CUSTOMER EXPERIENCE MANAGEMENT MARKET, BY ORGANIZATION SIZE, 2015–2020 (USD MILLION)
               TABLE 223 CUSTOMER EXPERIENCE MANAGEMENT MARKET, BY ORGANIZATION SIZE, 2021–2026 (USD MILLION)
               TABLE 224 CUSTOMER EXPERIENCE MANAGEMENT MARKET, BY VERTICAL, 2015–2020 (USD MILLION)
               TABLE 225 CUSTOMER EXPERIENCE MANAGEMENT MARKET, BY VERTICAL, 2021–2026 (USD MILLION)
 
13 APPENDIX (Page No. - 284)
     13.1 DISCUSSION GUIDE 
     13.2 KNOWLEDGESTORE: MARKETSANDMARKETS’ SUBSCRIPTION PORTAL 
     13.3 CUSTOMIZATION OPTIONS 
     13.4 RELATED REPORTS 
     13.5 AUTHOR DETAILS 

The study involved four major activities in estimating the current size of the global Management decision market. Exhaustive secondary research was done to collect information on the market, peer market, and parent market. The next step was to validate these findings, assumptions, and sizing with industry experts across the value chain through primary research. Both top-down and bottom-up approaches were employed to estimate the total management decision market size. After that, the market breakup and data triangulation techniques were used to estimate the market size of segments and subsegments.

Secondary Research

In the secondary research process, various secondary sources, such as Bloomberg and BusinessWeek, have been referred to identify and collect information for this study. The secondary sources included annual reports, press releases, and investor presentations of companies; white papers; journals, such as Linux Journal and Container Journal, and articles from recognized authors, directories, and databases.

Primary Research

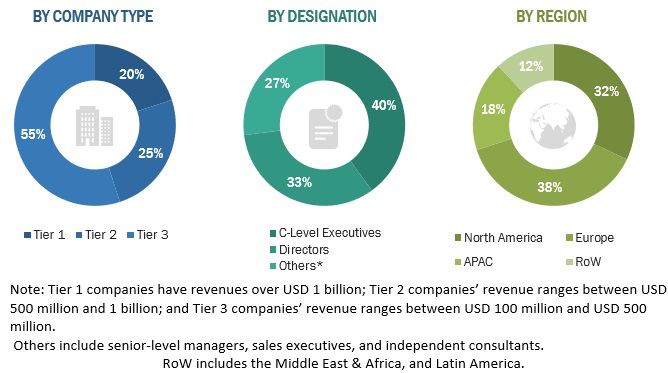
Various primary sources from both the supply and demand sides were interviewed to obtain qualitative and quantitative information for this report. The primary sources from the supply side included industry experts, such as Chief Executive Officers (CEOs), Chief Marketing Officers (CMO), Vice Presidents (VPs), Managing Directors (MDs), technology and innovation directors, and related key executives from various key companies and organizations operating in the management decision market along with the associated service providers, and system integrators operating in the targeted regions. All possible parameters that affect the market covered in this research study have been accounted for, viewed in extensive detail, verified through primary research, and analyzed to get the final quantitative and qualitative data. Following is the breakup of primary respondents.

The Breakup of Primary Research:
Management Decision Market Size, and Share

To know about the assumptions considered for the study, download the pdf brochure

Company Name

Designation

FICO

Senior Manager

IBM

Senior Analyst

SAS

Sales Executive

Market Size Estimation

For making market estimates and forecasting the management decision market and other dependent submarkets, the top-down and bottom-up approaches were used. The bottom-up procedure was used to arrive at the overall market size of the global management decision market using key companies’ revenue and their offerings in the market. The research methodology used to estimate the market size includes the following:

  • The key players in the management decision market have been identified through extensive secondary research.
  • The market size, in terms of value, has been determined through primary and secondary research processes.
  • All percentage shares, splits, and breakups have been determined using secondary sources and verified through primary sources.

Management Decision Market Size: Bottom-Up Approach
Management Decision Market Size, and Share

To know about the assumptions considered for the study, Request for Free Sample Report

Management Decision Market Size: Top-Down Approach

Management Decision Market Size, and Share

Data Triangulation

With data triangulation and validation through primary interviews, this study determined and confirmed the exact value of the overall parent market size. The overall market size was then used in the top-down procedure to estimate the size of other individual markets via percentage splits of the market segmentation.

Market Definition

Management decision software enables enterprises to make accurate and consistent business decisions throughout the enterprise. The software uses data analytics to control, manage, and automate business decisions, particularly operational decisions. The software is used for collection management, customer experience management, fraud detection management, pricing optimization, credit risk management, and decision automation.

Key Stakeholders

  • Management Software and Service Providers
  • Technology Vendors
  • Telecom Providers
  • System Integrators (SIs)
  • Resellers
  • Value-added Resellers (VARs)
  • Managed Service Providers (MSPs)
  • Compliance Regulatory Authorities
  • Government Authorities

Report Objectives

  • To determine, segment, and forecast the global Management Decision market by offering, application, vertical, and region in terms of value.
  • To forecast the size of the market segments to five main regions: North America, Europe, Asia Pacific, Middle East & Africa, and Latin America 
  • To provide detailed information about the major factors (drivers, opportunities, threats, and challenges) influencing the growth of the market
  • To study the complete value chain and related industry segments and perform a value chain analysis of the market landscape.
  • To strategically analyze the macro and micro markets to individual growth trends, prospects, and contributions to the total market
  • To analyze the industry trends, pricing data, patents, and innovations related to the market.
  • To analyze the opportunities for stakeholders by identifying the high-growth segments of the Management Decision market
  • To profile the key players in the market and comprehensively analyze their market share/ranking and core competencies.
  • To track and analyze competitive developments, such as mergers & acquisitions, product launches & developments, partnerships, agreements, collaborations, business expansions, and Research & Development (R&D) activities.

Available Customizations

With the given market data, MarketsandMarkets offers customizations as per the company’s specific needs. The following customization options are available for the report:

Company Information

  • Detailed analysis and profiling of an additional two market players
Custom Market Research Services

We will customize the research for you, in case the report listed above does not meet with your exact requirements. Our custom research will comprehensively cover the business information you require to help you arrive at strategic and profitable business decisions.

Request Customization

Instant Answers with GPT - Ask Now!

Ask real questions. Get complete answers !
Report Code
TC 6094
Published ON
Aug, 2023
Choose License Type
BUY NOW
  • SHARE
X
Request Customization
Speak to Analyst
Speak to Analyst
OR FACE-TO-FACE MEETING
PERSONALIZE THIS RESEARCH
  • Triangulate with your Own Data
  • Get Data as per your Format and Definition
  • Gain a Deeper Dive on a Specific Application, Geography, Customer or Competitor
  • Any level of Personalization
REQUEST A FREE CUSTOMIZATION
LET US HELP YOU!
  • What are the Known and Unknown Adjacencies Impacting the Management Decision Market
  • What will your New Revenue Sources be?
  • Who will be your Top Customer; what will make them switch?
  • Defend your Market Share or Win Competitors
  • Get a Scorecard for Target Partners
CUSTOMIZED WORKSHOP REQUEST
+1-888-600-6441
  • Call Us
  • +1-888-600-6441 (Corporate office hours)
  • +1-888-600-6441 (US/Can toll free)
  • +44-800-368-9399 (UK office hours)
CONNECT WITH US
ABOUT TRUST ONLINE
©2024 MarketsandMarkets Research Private Ltd. All rights reserved
DMCA.com Protection Status Website Feedback