Application Modernization Services Market

Application Modernization Services Market by Service Type (Application Portfolio Assessment, Cloud application Migration, Application Re-platforming), Cloud Deployment Mode, Organization Size, Vertical and Region - Global Forecast to 2027

Report Code: TC 5645 Feb, 2023, by marketsandmarkets.com

[305 Pages Report] The application modernization services market size is expected to grow from USD 15.2 billion in 2022 to USD 32.8 billion by 2027 at a Compound Annual Growth Rate (CAGR) of 16.7% during the forecast period. Application modernization services are the process of moving legacy programs or platforms to new ones and integrating new functionality to give the organization the newest features. In order to regularly deploy application code and insulate apps from the underlying host environment, which makes them more efficient than virtual machines, modernization might also entail switching to a containerized or serverless architecture. Companies must accelerate innovation and cost-effectiveness while maintaining, or even enhancing performance and reliability. Many of these businesses continue to use out-of-date hardware and software, which raises Operation costs and puts their operations in danger. IT leaders are aware of the need to upgrade their old programs, citing decreased time to market, lower technical debt, and lower running expenses as the main motivators.
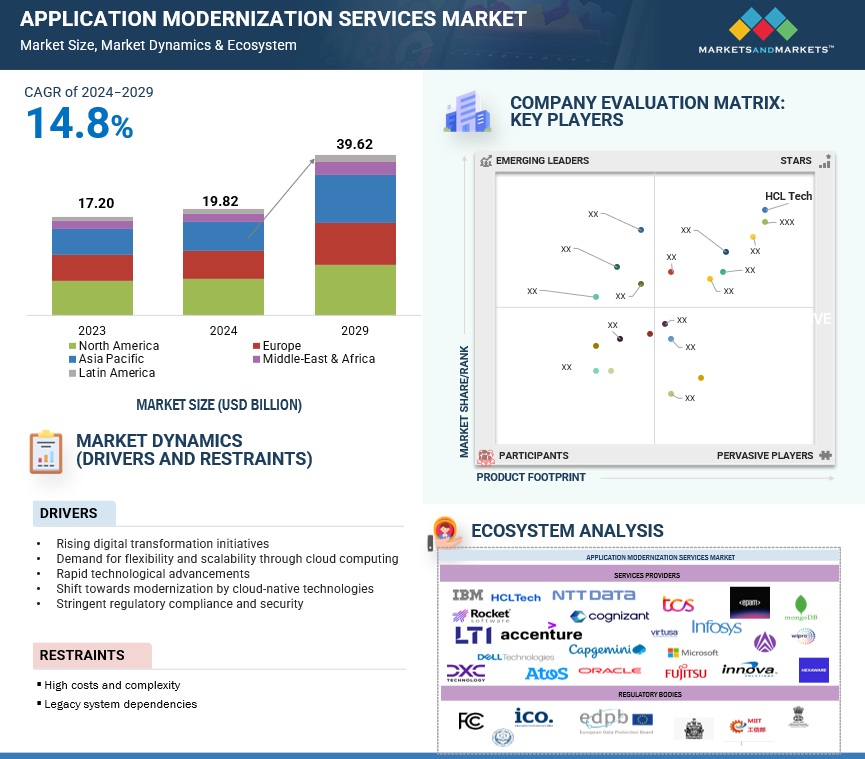
Application Modernization Services Market

To know about the assumptions considered for the study, Request for Free Sample Report

Market Dynamics

Driver:  Shift toward modernization by cloud-native technologies

There is a sudden shift in the market during 2021 and 2022 for application modernization and migration services towards modernization that are enabled by advanced cloud-native technologies with a correspondingly lower emphasis on infrastructure-led lift-and-shift migration. At the same time, the hyper-scale cloud providers have become an integral part of customers’ migration and modernization journeys, not only by becoming important strategic partners for large enterprise customers but also by participating in dedicated go-to-market units that the large systems integrators (SIs) are forming. The market is also characterized by higher degrees of automation, including the growing importance of service delivery accelerators, quality enablers, and vertical-industry-specific assets. Modern cloud-native development techniques can often be used for the modernization of discrete portions of legacy applications; however, for many businesses, successfully collocating a legacy application on a modern platform is considered a win.

Restraint: High costs and complexities in application modernization services

Although new application features can aid companies in streamlining their operations and boosting income, organizations must first examine their return on investment (ROI) before making any decisions about their investments in application modernization. Application modernization costs are largely influenced by the features and functions of the organizations pursuing it. Organizations must make sure that the difficulties of compatibility with other legacy programs do not outweigh the advantages offered by updated applications while upgrading a few applications. It is crucial for enterprises to begin the process with an application evaluation and select the best method for application modernization based on business goals in order to take into account the costs and complexities associated with the modernization procedures. The global market for application modernization services is therefore being constrained by the rising costs and complexity of application modernization.

Opportunity: Proliferation of Kubernetes and containerization

Kubernetes adoption is increasing rapidly, making it more important to address ongoing operations and management at scale. Huge numbers of stateful applications mean that the management burden for applications is expected to grow along with the capacity needed to support them. Organizations need tools to help mitigate Kubernetes-based workloads’ complexity to prepare for ongoing operations and scalability. Several companies are implementing containerization to enhance their application’s portability and data from across computing environments. The containers help virtualize storage and other computing resources at the OS level and help developers in the logical isolation of applications. Application modernization service providers, including IBM, AWS, Alibaba Cloud, Microsoft, HPE, Dell, and Google, have added container technology in their cloud storage and cloud-native storage solutions to enable persistent storage, with which running applications can easily consume the data on demand. Thus, containers combined with DevOps and cloud storage to completely modernize application development, which is expected to create opportunities in the application modernization services market.

Challenge: Lack of IT skills among employees

The addition of additional features and functionality to apps is a component of application modernization. Although it eventually improves/simplifies the entire process, staff must learn new functionalities and adjust to new Uls in order to use all functionalities. The amount of work required to embrace modernized software can vary depending on modifications to Uls and functionality. Uls modifications may be resisted by people who are accustomed to utilizing outdated Uls and software, which is a substantial obstacle to application modernization. Many businesses struggle to modernize and incorporate new technologies within established organizational cultures. The recent pandemic has caused many firms to reevaluate how they conduct business and the idea of operating remotely as a significant business continuity option. These two factors are connected, thus businesses work to maintain a balance between them. Unless top management is convinced of the benefits of the modernization process, the traditional organizational culture may not choose to engage in it. To meet this challenge, businesses should think about organizational change management (OCM).

US to account for the largest market size during the forecast period

The geographic analysis of North America is segmented into countries, including US and Canada. A state-of-the-art IT infrastructure and readily available technical competence Due to its established end-user industries and well-established suppliers, the US holds the largest market share in North America for the adoption of application modernization, which helps to increase corporate productivity and worker efficiency. American businesses are embracing cloud-based services to take advantage of its high flexibility, scalability, and minimal maintenance expenses. Several small and large modernization service providers, including Accenture, ATOS, Capgemini, HCL, Cognizant, IBM, and TCS, are based in the US, and they are among the main forces behind the expansion of the application modernization services market in the nation. The FedRAMP is a standardized approach to security assessment, authorization, and continuous monitoring for cloud products and services that was developed by the US government. The country's highly established BFSI and healthcare industries, together with the existence of several sizable IT firms, are major factors influencing the demand for application modernization there. In the US, cloud technology adoption is reportedly very high. Due to the nation's accessibility to a highly established digital infrastructure environment, businesses can efficiently upgrade their legacy systems and boost profitability. One of the key factors propelling the nation's market for application modernization services is the urgent requirement for the modernization of numerous old federal systems.
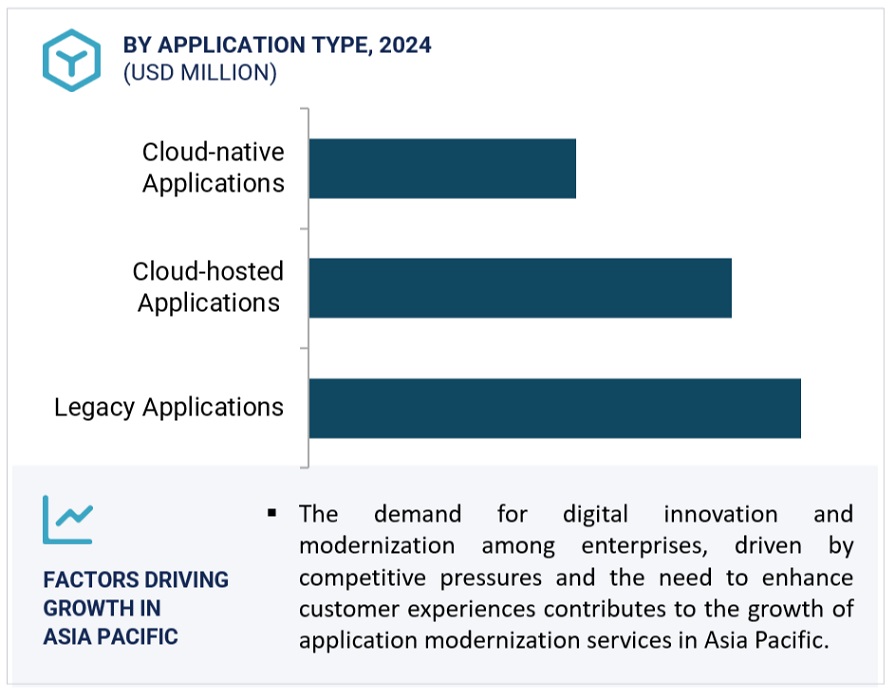
Application Modernization Services Market Size, and Share

To know about the assumptions considered for the study, download the pdf brochure

China to account for the largest market size during the forecast period

The geographic analysis of Asia Pacific is segmented into countries, including China, Japan, Australia, India, and the rest of Asia Pacific. Applications must be modernized by businesses to maintain growth and compete effectively. China's economy, which is expanding in the Asia-Pacific region, has built its foundation on the creation of cloud infrastructure services. China has one of the largest economies in the world and holds a sizeable portion of the market for application modernization services in the Asia Pacific region. The nation is swiftly adopting technology advancements, such as mobile payments and artificially intelligent virtual news broadcasts. Government programs in the nation are also intended to boost innovation and enhance technology. The nation has demonstrated a greater interest in promoting technical investments and legislative assistant in the Asia Pacific area. Traditional business models are being updated by companies in order to maintain growth and compete. Traditional business models are being updated by companies in order to maintain growth and compete. The demand for application modernization across all businesses in the country is mostly being driven by the increased adoption of new technologies such as loT, mobile, and cloud.
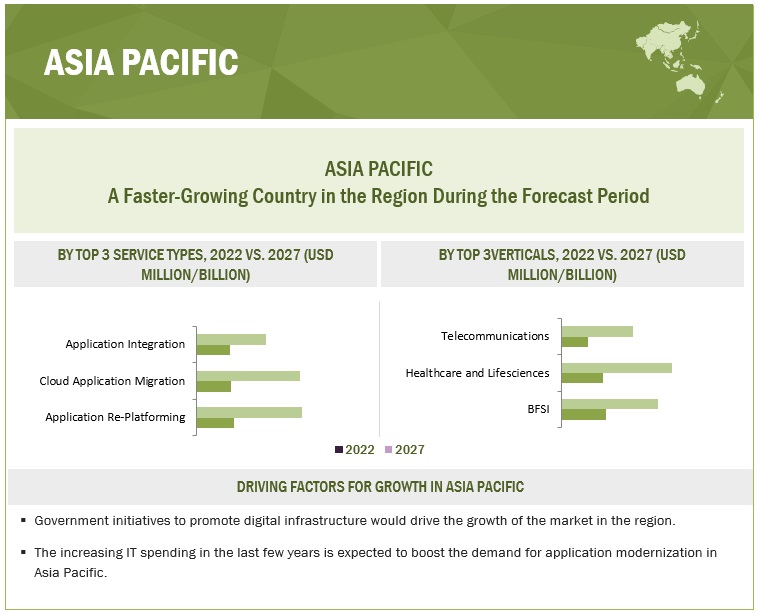
Application Modernization Services Market Size, and Share

Key Market Players

Some of the major application modernization services market vendors are AWS (US), Microsoft (US), Google (US), Salesforce (US), Alibaba Cloud (China), Oracle (US), IBM (US), SAP (Germany), Tencent (China), Workday (US), Fujitsu (Japan), VMWare (US), Rackspace (US), HPE (US), Adobe (US), NEC (Japan), Cisco (US), Dell Technologies (US), ServiceNow (US), OVH (France), Huawei (China), Verizon (US), OrangeGroup (France), NetApp (US), dinCloud (US), Vultr (US), Megaport (Australia), AppScale (US), Zymr (US), Genesis Cloud (Germany), Ekco (Ireland), Tudip Technologies (India), ORock Technologies (US), and CloudFlex (Nigeria).

Get online access to the report on the World's First Market Intelligence Cloud

  • Easy to Download Historical Data & Forecast Numbers
  • Company Analysis Dashboard for high growth potential opportunities
  • Research Analyst Access for customization & queries
  • Competitor Analysis with Interactive dashboard
  • Latest News, Updates & Trend analysis
Request Sample

Scope of the Report

Report Metrics

Details

Market size available for years

2017–2027

Base year considered

2021

Forecast period

2022–2027

Forecast units

Million/Billion(USD)

Segments Covered

Service Types, Cloud Deployment Modes, Organization Sizes, Verticals, and Regions

Geographies Covered

North America, Europe, Asia Pacific, Middle East and Africa, and Latin America

Companies Covered

Some of the major application modernization services market vendors are IBM (US), Accenture (Ireland), HCL Technologies (India), Atos (France), Capgemini (France), Cognizant (US), TCS (India), Bell Integrators (US), Innova Solutions (US), Oracle (US), Microsoft (US), EPAM Systems (US),  Aspire Systems (India), NTT Data (Japan), Dell Technologies  (US), DXC Technology (US), Infosys (India), LTI (India), Wipro (India), Micro Focus (UK), Fujitsu (Japan), Softura (US), Hexaware Technologies (India), Virtusa (US), and MongoDB (US).

This research report categorizes the application modernization services market based on service, organization sizes, cloud deployment modes, verticals, and regions.

Based on the Service Type:
  • Application Portfolio Assessment
  • Cloud Application Migration
  • Application Re-Platforming
  • Application Integration
  • UI Modernization
  • Post-Modernization
Based on the Cloud Deployment Mode:
  • Public Cloud
  • Private Cloud
Based on the Organization Size:
  • Large enterprises
  • Small and Medium Enterprises (SMEs)
Based on the Verticals:
  • BFSI
  • Healthcare and Life Sciences
  • Telecommunication
  • IT and ITeS
  • Retail and Consumer Goods
  • Government and Public Sector
  • Energy and Utilities
  • Manufacturing
  • Other Verticals
Based on the Region:
  • North America
    • United States
    • Canada
  • Europe
    • United Kingdom
    • Germany
    • France
    • Rest of Europe
  • Asia Pacific
    • China
    • Japan
    • India
    • Australia
    • Rest of Asia Pacific
  • Middle East & Africa
    • Kingdom of Saudi Arabia
    • South Africa
    • Rest of Middle East & Africa
  • Latin America
    • Brazil
    • Mexico
    • Rest of Latin America

Recent Developments:

  • In January 2023, the company launched Capgemini Invent, the digital innovation, design, and transformation brand of the Capgemini Group, which offers CxOs the ability to foresee and influence the direction of their companies' futures. A team of over 10,000 strategists, data scientists, product and experience designers, brand experts, and developers work in roughly 40 studios and more than 60 offices around the globe to create innovative digital services, products, experiences, and business models for sustainable growth.
  • In September 2022, Innova Solutions unveiled a new vertical business strategy made up of several strategic business units (SBUs), including Healthcare, Insurance, and Life Sciences (HIL), Communications & Media, Retail, Manufacturing, and Transport (RMT), Banking and Financial Services (BFS), and Hi-Tech. The company cited a need for a wider selection of industry-specific offerings made to assist companies on their paths toward digital transformation. Innova will work with its strategic partners to expand on current tech ecosystems while it creates new products.
  • In July 2022, Scalor, the Atos Accelerator, was designed to be an open innovation accelerator program for startups and SMEs. Atos announced the addition of five new startups to the program to concentrate particularly on quantum technology and digital security. As startups contribute novel solutions to Atos’ portfolio, Scaler added value for the company’s clients. In return, Atos promoted the startup’s business and international expansion by facilitating faster access to its clientele and partner network.
  • In September 2021, After noticing an increase in demand from companies in the public sector and the Health Industry, Cognizant built its new delivery center in Leeds, UK and Northern Ireland to boost its client services. The action solidifies Cognizant's dedication to fostering the careers of young technologists and aligns it with the UK's Levelling-Up and North Shoring agenda.
  • In February 2021, Oracle introduced the most recent enhancements to Oracle Cloud Customer Experience (CX), which can assist businesses in giving customers dynamic and unique experiences. Oracle Sales, Oracle Care, and Oracle Marketing's most recent upgrades enable businesses to shorten sales cycles, respond to customer service requests more quickly, and create rewarding loyalty programs that can increase customer lifetime value.

Frequently Asked Questions (FAQ):


To speak to our analyst for a discussion on the above findings, click Speak to Analyst

TABLE OF CONTENTS
 
1 INTRODUCTION (Page No. - 39)
    1.1 STUDY OBJECTIVES 
    1.2 MARKET DEFINITION 
           1.2.1 INCLUSIONS AND EXCLUSIONS
    1.3 MARKET SCOPE 
           1.3.1 MARKET SEGMENTATION
           1.3.2 REGIONS COVERED
           1.3.3 YEARS CONSIDERED
    1.4 CURRENCY CONSIDERED 
           TABLE 1 USD EXCHANGE RATE, 2017–2021
    1.5 STAKEHOLDERS 
    1.6 SUMMARY OF CHANGES 
 
2 RESEARCH METHODOLOGY (Page No. - 44)
    2.1 RESEARCH DATA 
           FIGURE 1 APPLICATION MODERNIZATION SERVICES MARKET: RESEARCH DESIGN
           2.1.1 SECONDARY DATA
           2.1.2 PRIMARY DATA
                    2.1.2.1 Breakdown of primaries
                               TABLE 2 PRIMARY RESPONDENTS
                    2.1.2.2 Key industry insights
    2.2 MARKET BREAKUP AND DATA TRIANGULATION 
           FIGURE 2 DATA TRIANGULATION
    2.3 MARKET SIZE ESTIMATION 
           FIGURE 3 TOP-DOWN AND BOTTOM-UP APPROACHES
           2.3.1 TOP-DOWN APPROACH
                    FIGURE 4 TOP-DOWN APPROACH: REVENUE OF VENDORS OFFERING APPLICATION MODERNIZATION SERVICES
           2.3.2 BOTTOM-UP APPROACH
                    FIGURE 5 BOTTOM-UP APPROACH: REVENUE OF VENDORS ACROSS SERVICES
                    FIGURE 6 BOTTOM-UP APPROACH (SUPPLY SIDE): COLLECTIVE REVENUE OF APPLICATION MODERNIZATION SERVICES VENDORS
                    FIGURE 7 CAGR PROJECTIONS FROM SUPPLY SIDE
    2.4 RESEARCH ASSUMPTIONS 
           TABLE 3 RESEARCH ASSUMPTIONS
    2.5 RESEARCH LIMITATIONS 
 
3 EXECUTIVE SUMMARY (Page No. - 56)
    FIGURE 8 APPLICATION MODERNIZATION SERVICES MARKET SNAPSHOT, 2017–2027 
    FIGURE 9 TOP MARKET SEGMENTS IN TERMS OF GROWTH RATE 
    FIGURE 10 APPLICATION RE-PLATFORMING SEGMENT TO ACCOUNT FOR LARGEST MARKET BY 2027 
    FIGURE 11 PUBLIC CLOUD SEGMENT TO ACCOUNT FOR LARGER MARKET BY 2027 
    FIGURE 12 LARGE ENTERPRISES SEGMENT TO ACCOUNT FOR LARGER MARKET BY 2027 
    FIGURE 13 BFSI TO BE DOMINANT VERTICAL BY 2027 
    FIGURE 14 NORTH AMERICA TO ACCOUNT FOR LARGEST SHARE DURING FORECAST PERIOD 
 
4 PREMIUM INSIGHTS (Page No. - 63)
    4.1 ATTRACTIVE GROWTH OPPORTUNITIES FOR PLAYERS IN  APPLICATION MODERNIZATION SERVICES MARKET 
           FIGURE 15 TECHNOLOGICAL EVOLUTION TO DRIVE GROWTH OF APPLICATION MODERNIZATION SERVICES
    4.2 MARKET,  BY SERVICE TYPE, 2022 VS. 2027 
           FIGURE 16 APPLICATION RE-PLATFORMING ACCOUNTED FOR LARGEST SHARE IN 2022
    4.3 MARKET,  BY CLOUD DEPLOYMENT MODE, 2022 VS. 2027 
           FIGURE 17 PUBLIC CLOUD SEGMENT ACCOUNTED FOR LARGER SHARE IN 2022
    4.4 MARKET,  BY ORGANIZATION SIZE, 2022 VS. 2027 
           FIGURE 18 LARGE ENTERPRISES SEGMENT ACCOUNTED FOR LARGER SHARE IN 2022
    4.5 MARKET, BY VERTICAL, 2022 VS. 2027 
           FIGURE 19 BFSI SEGMENT ACCOUNTED FOR LARGEST SHARE IN 2022
    4.6 MARKET, BY REGION,  2022 VS. 2027 
           FIGURE 20 ASIA PACIFIC TO EMERGE AS BEST MARKET FOR INVESTMENTS IN  NEXT FIVE YEARS
 
5 MARKET OVERVIEW AND INDUSTRY TRENDS (Page No. - 67)
    5.1 INTRODUCTION 
    5.2 MARKET DYNAMICS 
           FIGURE 21 DRIVERS, RESTRAINTS, OPPORTUNITIES, AND CHALLENGES:  APPLICATION MODERNIZATION SERVICES MARKET
           5.2.1 DRIVERS
                    5.2.1.1 Need for improved software functionalities due to changing business landscapes
                    5.2.1.2 Demand for flexibility and scalability through cloud computing
                    5.2.1.3 Benefits of integrating modern technologies with software systems
                    5.2.1.4 Shift toward modernization by cloud-native technologies
                    5.2.1.5 Increase in automation in application updates
           5.2.2 RESTRAINTS
                    5.2.2.1 High costs and complexities in application modernization services
           5.2.3 OPPORTUNITIES
                    5.2.3.1 Existence of large number of legacy applications
                    5.2.3.2 Evolution of open standards for software development
                    5.2.3.3 Proliferation of Kubernetes and containerization
           5.2.4 CHALLENGES
                    5.2.4.1 Reduction in technology spending due to COVID-19
                    5.2.4.2 Lack of IT skills among employees
                    5.2.4.3 Complexities associated with cloud-native concepts
    5.3 CASE STUDY ANALYSIS 
           5.3.1 CASE STUDY 1: WOVENWARE DESIGNED WEB APPLICATION TO MEET NEEDS OF CLIENT
           5.3.2 CASE STUDY 2: CLOUDHEDGE SUGGESTED MIGRATION AND DEPLOYMENT OF CONTAINERS ON IBM CLOUD PLATFORM
           5.3.3 CASE STUDY 3: FUJITSU TO HELP CLIENT IN MIGRATING ITS BUSINESS-CRITICAL APPLICATIONS
           5.3.4 CASE STUDY 4: TECH MAHINDRA TO INCORPORATE TOOL-BASED APPLICATION ASSESSMENT SOLUTION
           5.3.5 CASE STUDY 5: ATOS TO HELP CLIENTS IN ACHIEVING COST-EFFECTIVE, LOW-RISK MODERNIZATION, AND MODULAR DESIGN
           5.3.6 CASE STUDY 6: TRILIO ENABLED CSI-PIEMONTE TO OFFER NATIVE DATA PROTECTION AND MANAGEMENT SERVICES
    5.4 ECOSYSTEM ANALYSIS 
           FIGURE 22 ECOSYSTEM ANALYSIS OF APPLICATION MODERNIZATION SERVICES MARKET
    5.5 PRICING ANALYSIS 
           5.5.1 AVERAGE SELLING PRICE OF KEY PLAYERS, BY SOLUTION
                    TABLE 4 MARKET: PRICING ANALYSIS
           5.5.2 AVERAGE SELLING PRICE TRENDS
                    TABLE 5 MARKET: AVERAGE PRICING LEVELS (USD)
    5.6 PATENT ANALYSIS 
           FIGURE 23 NUMBER OF PATENTS PUBLISHED, 2012–2022
                    FIGURE 24 TOP 5 PATENT APPLICANTS (GLOBALLY) IN 2022
                    TABLE 6 TOP 10 PATENT OWNERS IN MARKET
    5.7 VALUE CHAIN ANALYSIS 
           FIGURE 25 APPLICATION MODERNIZATION SERVICES MARKET: VALUE CHAIN ANALYSIS
    5.8 TECHNOLOGY ANALYSIS 
           5.8.1 ARTIFICIAL INTELLIGENCE
           5.8.2 IT AUTOMATION
           5.8.3 MICROSERVICES
           5.8.4 APPLICATION PROGRAMMING INTERFACE
           5.8.5 CLOUD SERVICES
    5.9 KEY STAKEHOLDERS AND BUYING CRITERIA 
           5.9.1 KEY STAKEHOLDERS IN BUYING PROCESS
                    FIGURE 26 INFLUENCE OF STAKEHOLDERS ON BUYING PROCESS
                    TABLE 7 INFLUENCE OF STAKEHOLDERS ON BUYING PROCESS
           5.9.2 BUYING CRITERIA
                    FIGURE 27 KEY BUYING CRITERIA FOR TOP THREE VERTICALS
                    TABLE 8 KEY BUYING CRITERIA FOR TOP THREE VERTICALS
    5.10 KEY CONFERENCES AND EVENTS 
           TABLE 9 APPLICATION MODERNIZATION SERVICES MARKET: DETAILED LIST OF KEY CONFERENCES AND EVENTS IN 2023 AND 2024
    5.11 PORTER’S FIVE FORCES ANALYSIS 
                    FIGURE 28 PORTER’S FIVE FORCES ANALYSIS: MARKET
                    TABLE 10 PORTER’S FIVE FORCES ANALYSIS: MARKET
           5.11.1 THREAT FROM NEW ENTRANTS
           5.11.2 THREAT FROM SUBSTITUTES
           5.11.3 BARGAINING POWER OF SUPPLIERS
           5.11.4 BARGAINING POWER OF BUYERS
           5.11.5 INTENSITY OF COMPETITIVE RIVALRY
    5.12 REGULATORY LANDSCAPE 
           5.12.1 REGULATORY BODIES, GOVERNMENT AGENCIES, AND OTHER ORGANIZATIONS
                    TABLE 11 NORTH AMERICA: LIST OF REGULATORY BODIES, GOVERNMENT AGENCIES,  AND OTHER ORGANIZATIONS
                    TABLE 12 EUROPE: LIST OF REGULATORY BODIES, GOVERNMENT AGENCIES, AND OTHER ORGANIZATIONS
                    TABLE 13 ASIA PACIFIC: LIST OF REGULATORY BODIES, GOVERNMENT AGENCIES, AND OTHER ORGANIZATIONS
                    TABLE 14 REST OF THE WORLD: LIST OF REGULATORY BODIES, GOVERNMENT AGENCIES,  AND OTHER ORGANIZATIONS
           5.12.2 REGULATORY IMPLICATIONS AND INDUSTRY STANDARDS
           5.12.3 GENERAL DATA PROTECTION REGULATION
           5.12.4 SEC RULE 17A-4
           5.12.5 ISO/IEC 27001
           5.12.6 SYSTEM AND ORGANIZATION CONTROLS 2 TYPE II COMPLIANCE
           5.12.7 FINANCIAL INDUSTRY REGULATORY AUTHORITY
           5.12.8 FREEDOM OF INFORMATION ACT
           5.12.9 HEALTH INSURANCE PORTABILITY AND ACCOUNTABILITY ACT
    5.13 TRENDS/DISRUPTIONS IMPACTING BUYERS 
                    FIGURE 29 MARKET: TRENDS/DISRUPTIONS IMPACTING BUYERS
 
6 APPLICATION MODERNIZATION SERVICES MARKET,  BY SERVICE TYPE (Page No. - 91)
    6.1 INTRODUCTION 
           6.1.1 SERVICE TYPE: MARKET DRIVERS
                    FIGURE 30 CLOUD APPLICATION MIGRATION SEGMENT TO REGISTER HIGHEST CAGR DURING FORECAST PERIOD
                    TABLE 15 MARKET, BY SERVICE TYPE,  2017–2021 (USD MILLION)
                    TABLE 16 MARKET, BY SERVICE TYPE,  2022–2027 (USD MILLION)
    6.2 APPLICATION PORTFOLIO ASSESSMENT 
           6.2.1 APPLICATION PORTFOLIO ASSESSMENT TO BRING CLEAR VISIBILITY INTO IT SYSTEMS AND APPLICATIONS
                    TABLE 17 APPLICATION PORTFOLIO ASSESSMENT: MARKET, BY REGION, 2017–2021 (USD MILLION)
                    TABLE 18 APPLICATION PORTFOLIO ASSESSMENT: MARKET, BY REGION, 2022–2027 (USD MILLION)
    6.3 CLOUD APPLICATION MIGRATION 
           6.3.1 CLOUD APPLICATION MIGRATION TO ACHIEVE REHOSTING, REFACTORING, REVISION, REBUILDING, REPLACING, AND RETAINING OF APPLICATION
                    TABLE 19 CLOUD APPLICATION MIGRATION: MARKET,  BY REGION, 2017–2021 (USD MILLION)
                    TABLE 20 CLOUD APPLICATION MIGRATION: MARKET,  BY REGION, 2022–2027 (USD MILLION)
    6.4 APPLICATION RE-PLATFORMING 
           6.4.1 APPLICATION RE-PLATFORMING TO KEEP UP WITH RAPID TECHNOLOGY EVOLUTION AND DEMAND OF CURRENT MARKETS
                    TABLE 21 APPLICATION RE-PLATFORMING: APPLICATION MODERNIZATION SERVICES MARKET,  BY REGION, 2017–2021 (USD MILLION)
                    TABLE 22 APPLICATION RE-PLATFORMING: MARKET,  BY REGION, 2022–2027 (USD MILLION)
    6.5 APPLICATION INTEGRATION 
           6.5.1 APPLICATION INTEGRATION TO ENSURE SMOOTH FUNCTIONING OF ENTERPRISE SYSTEMS AND APPLICATIONS
                    TABLE 23 APPLICATION INTEGRATION: MARKET,  BY REGION, 2017–2021 (USD MILLION)
                    TABLE 24 APPLICATION INTEGRATION: MARKET,  BY REGION, 2022–2027 (USD MILLION)
    6.6 UI MODERNIZATION 
           6.6.1 UI MODERNIZATION SERVICES TO ENHANCE END USERS' EFFICIENCY
                    TABLE 25 UI MODERNIZATION: MARKET, BY REGION, 2017–2021 (USD MILLION)
                    TABLE 26 UI MODERNIZATION: MARKET, BY REGION, 2022–2027 (USD MILLION)
    6.7 POST MODERNIZATION 
           6.7.1 RISING NEED TO BRIDGE GAP BETWEEN EXISTING ON-PREMISES SYSTEMS AND CLOUD-BASED ENTERPRISE APPLICATIONS
                    TABLE 27 POST MODERNIZATION: MARKET,  BY REGION, 2017–2021 (USD MILLION)
                    TABLE 28 POST MODERNIZATION: MARKET,  BY REGION, 2022–2027 (USD MILLION)
 
7 APPLICATION MODERNIZATION SERVICES MARKET,  BY CLOUD DEPLOYMENT MODE (Page No. - 101)
    7.1 INTRODUCTION 
           7.1.1 CLOUD DEPLOYMENT MODE: MARKET DRIVERS
                    FIGURE 31 PRIVATE CLOUD SEGMENT TO REGISTER HIGHER CAGR DURING  FORECAST PERIOD
                    TABLE 29 MARKET, BY CLOUD DEPLOYMENT MODE, 2017–2021 (USD MILLION)
                    TABLE 30 MARKET, BY CLOUD DEPLOYMENT MODE, 2022–2027 (USD MILLION)
    7.2 PUBLIC CLOUD 
           7.2.1 PUBLIC CLOUD APPLICATION MODERNIZATION EXPERTS TO ARCHITECT AND LAUNCH POWERFUL APPS
                    TABLE 31 PUBLIC CLOUD: MARKET, BY REGION,  2017–2021 (USD MILLION)
                    TABLE 32 PUBLIC CLOUD: MARKET, BY REGION,  2022–2027 (USD MILLION)
    7.3 PRIVATE CLOUD 
           7.3.1 NEED TO SECURE CUSTOMER DATA FROM MALWARE DRIVING DEMAND FOR PRIVATE CLOUD
                    TABLE 33 PRIVATE CLOUD: MARKET, BY REGION,  2017–2021 (USD MILLION)
                    TABLE 34 PRIVATE CLOUD: MARKET, BY REGION,  2022–2027 (USD MILLION)
 
8 APPLICATION MODERNIZATION SERVICES MARKET,  BY ORGANIZATION SIZE (Page No. - 106)
    8.1 INTRODUCTION 
           8.1.1 ORGANIZATION SIZE: MARKET DRIVERS
                    FIGURE 32 SMALL AND MEDIUM-SIZED ENTERPRISES SEGMENT TO WITNESS HIGHER CAGR DURING FORECAST PERIOD
                    TABLE 35 MARKET, BY ORGANIZATION SIZE,  2017–2021 (USD MILLION)
                    TABLE 36 MARKET, BY ORGANIZATION SIZE,  2022–2027 (USD MILLION)
    8.2 SMALL AND MEDIUM-SIZED ENTERPRISES 
           8.2.1 INCREASING IT SPENDING TO MANAGE BUSINESS OPERATIONS
                    TABLE 37 SMALL AND MEDIUM-SIZED ENTERPRISES: MARKET, BY REGION, 2017–2021 (USD MILLION)
                    TABLE 38 SMALL AND MEDIUM-SIZED ENTERPRISES: MARKET, BY REGION, 2022–2027 (USD MILLION)
    8.3 LARGE ENTERPRISES 
           8.3.1 FUNCTIONAL PRODUCTIVITY GAINS TO GENERATE DEMAND FOR APPLICATION MODERNIZATION SERVICES
                    TABLE 39 LARGE ENTERPRISES: MARKET,  BY REGION, 2017–2021 (USD MILLION)
                    TABLE 40 LARGE ENTERPRISES: MARKET,  BY REGION, 2022–2027 (USD MILLION)
 
9 APPLICATION MODERNIZATION SERVICES MARKET, BY VERTICAL (Page No. - 111)
    9.1 INTRODUCTION 
           9.1.1 VERTICAL: MARKET DRIVERS
                    FIGURE 33 BFSI VERTICAL TO HOLD LARGEST MARKET SIZE DURING FORECAST PERIOD
                    TABLE 41 MARKET, BY VERTICAL,  2017–2021 (USD MILLION)
                    TABLE 42 MARKET, BY VERTICAL,  2022–2027 (USD MILLION)
    9.2 BANKING, FINANCIAL SERVICES, AND INSURANCE 
           9.2.1 RISING NEED FOR DIGITAL TRANSFORMATION AND IMPROVED CUSTOMER EXPERIENCE
                    TABLE 43 BFSI: MARKET, BY REGION,  2017–2021 (USD MILLION)
                    TABLE 44 BFSI: MARKET, BY REGION,  2022–2027 (USD MILLION)
    9.3 HEALTHCARE AND LIFE SCIENCES 
           9.3.1 GROWTH IN DEMAND FOR TOOLS TO SUPPORT USER SECURITY
                    TABLE 45 HEALTHCARE AND LIFE SCIENCES: MARKET,  BY REGION, 2017–2021 (USD MILLION)
                    TABLE 46 HEALTHCARE AND LIFE SCIENCES: MARKET,  BY REGION, 2022–2027 (USD MILLION)
    9.4 TELECOMMUNICATIONS 
           9.4.1 PROVIDING FLEXIBLE AND SCALABLE NETWORKS FOR CORE BUSINESS TASKS
                    TABLE 47 TELECOMMUNICATIONS: MARKET,  BY REGION, 2017–2021 (USD MILLION)
                    TABLE 48 TELECOMMUNICATIONS: MARKET,  BY REGION, 2022–2027 (USD MILLION)
    9.5 IT AND ITES 
           9.5.1 IT AND ITES COMPANIES TO INVEST IN NEW TECHNOLOGIES TO GAIN EFFICIENCY AND INNOVATION
                    TABLE 49 IT AND ITES: APPLICATION MODERNIZATION SERVICES MARKET, BY REGION,  2017–2021 (USD MILLION)
                    TABLE 50 IT AND ITES: MARKET, BY REGION,  2022–2027 (USD MILLION)
    9.6 RETAIL AND CONSUMER GOODS 
           9.6.1 RETAILERS MOVE TO CLOUD TO CREATE CUSTOMER EXPERIENCES
                    TABLE 51 RETAIL AND CONSUMER GOODS: MARKET,  BY REGION, 2017–2021 (USD MILLION)
                    TABLE 52 RETAIL AND CONSUMER GOODS: MARKET,  BY REGION, 2022–2027 (USD MILLION)
    9.7 GOVERNMENT AND PUBLIC SECTOR 
           9.7.1 RISING DEMAND FOR TRANSFORMATION OF GOVERNMENT INFRASTRUCTURE
                    TABLE 53 GOVERNMENT AND PUBLIC SECTOR: MARKET, BY REGION, 2017–2021 (USD MILLION)
                    TABLE 54 GOVERNMENT AND PUBLIC SECTOR: MARKET, BY REGION, 2022–2027 (USD MILLION)
    9.8 ENERGY AND UTILITIES 
           9.8.1 ENERGY AND UTILITY INDUSTRY TO MIGRATE MAINFRAME AND LEGACY APPLICATIONS TO DISTRIBUTED AND CLOUD ENVIRONMENTS
                    TABLE 55 ENERGY AND UTILITIES: MARKET,  BY REGION, 2017–2021 (USD MILLION)
                    TABLE 56 ENERGY AND UTILITIES: MARKET,  BY REGION, 2022–2027 (USD MILLION)
    9.9 MANUFACTURING 
           9.9.1 ACCESSING MANUFACTURING DATA VIA CLOUD TO BE BETTER SOLUTION THAN INTERNAL IT INFRASTRUCTURE
                    TABLE 57 MANUFACTURING: MARKET, BY REGION,  2017–2021 (USD MILLION)
                    TABLE 58 MANUFACTURING: MARKET, BY REGION, 2022–2027 (USD MILLION)
    9.10 OTHER VERTICALS 
           TABLE 59 OTHER VERTICALS: MARKET, BY REGION,  2017–2021 (USD MILLION)
           TABLE 60 OTHER VERTICALS: MARKET, BY REGION,  2022–2027 (USD MILLION)
 
10 APPLICATION MODERNIZATION SERVICES MARKET, BY REGION (Page No. - 126)
     10.1 INTRODUCTION 
               FIGURE 34 ASIA PACIFIC TO GROW AT HIGHEST CAGR DURING FORECAST PERIOD
               TABLE 61 MARKET, BY REGION, 2017–2021 (USD MILLION)
               TABLE 62 MARKET, BY REGION,  2022–2027 (USD MILLION)
     10.2 NORTH AMERICA 
             10.2.1 NORTH AMERICA: MARKET DRIVERS
             10.2.2 NORTH AMERICA: RECESSION IMPACT
                       FIGURE 35 NORTH AMERICA: MARKET SNAPSHOT
                       TABLE 63 NORTH AMERICA: APPLICATION MODERNIZATION SERVICES MARKET, BY SERVICE TYPE, 2017–2021 (USD MILLION)
                       TABLE 64 NORTH AMERICA: MARKET, BY SERVICE TYPE, 2022–2027 (USD MILLION)
                       TABLE 65 NORTH AMERICA: MARKET, BY ORGANIZATION SIZE, 2017–2021 (USD MILLION)
                       TABLE 66 NORTH AMERICA: MARKET,  BY ORGANIZATION SIZE, 2022–2027 (USD MILLION)
                       TABLE 67 NORTH AMERICA: MARKET,  BY CLOUD DEPLOYMENT MODE, 2017–2021 (USD MILLION)
                       TABLE 68 NORTH AMERICA: MARKET,  BY CLOUD DEPLOYMENT MODE, 2022–2027 (USD MILLION)
                       TABLE 69 NORTH AMERICA: MARKET, BY VERTICAL, 2017–2021 (USD MILLION)
                       TABLE 70 NORTH AMERICA: MARKET, BY VERTICAL,  2022–2027 (USD MILLION)
                       TABLE 71 NORTH AMERICA: MARKET, BY COUNTRY, 2017–2021 (USD MILLION)
                       TABLE 72 NORTH AMERICA: MARKET, BY COUNTRY,  2022–2027 (USD MILLION)
             10.2.3 US
                       10.2.3.1 Advanced IT infrastructure and availability of technical expertise
                                   TABLE 73 US: APPLICATION MODERNIZATION SERVICES MARKET, BY SERVICE TYPE,  2017–2021 (USD MILLION)
                                   TABLE 74 US: MARKET, BY SERVICE TYPE,  2022–2027 (USD MILLION)
                                   TABLE 75 US: MARKET, BY ORGANIZATION SIZE, 2017–2021 (USD MILLION)
                                   TABLE 76 US: MARKET, BY ORGANIZATION SIZE,  2022–2027 (USD MILLION)
                                   TABLE 77 US: MARKET, BY CLOUD DEPLOYMENT MODE, 2017–2021 (USD MILLION)
                                   TABLE 78 US: MARKET, BY CLOUD DEPLOYMENT MODE, 2022–2027 (USD MILLION)
                                   TABLE 79 US: MARKET, BY VERTICAL,  2017–2021 (USD MILLION)
                                   TABLE 80 US: MARKET, BY VERTICAL,  2022–2027 (USD MILLION)
             10.2.4 CANADA
                       10.2.4.1 Advent of digital economy to create stable economy
                                   TABLE 81 CANADA: APPLICATION MODERNIZATION SERVICES MARKET, BY SERVICE TYPE,  2017–2021 (USD MILLION)
                                   TABLE 82 CANADA: MARKET, BY SERVICE TYPE,  2022–2027 (USD MILLION)
                                   TABLE 83 CANADA: MARKET, BY ORGANIZATION SIZE, 2017–2021 (USD MILLION)
                                   TABLE 84 CANADA: MARKET, BY ORGANIZATION SIZE, 2022–2027 (USD MILLION)
                                   TABLE 85 CANADA: MARKET, BY CLOUD DEPLOYMENT MODE, 2017–2021 (USD MILLION)
                                   TABLE 86 CANADA: MARKET,  BY CLOUD DEPLOYMENT MODE, 2022–2027 (USD MILLION)
                                   TABLE 87 CANADA: MARKET, BY VERTICAL,  2017–2021 (USD MILLION)
                                   TABLE 88 CANADA: MARKET, BY VERTICAL,  2022–2027 (USD MILLION)
     10.3 EUROPE 
             10.3.1 EUROPE: APPLICATION MODERNIZATION SERVICES MARKET DRIVERS
             10.3.2 EUROPE: RECESSION IMPACT
                       TABLE 89 EUROPE: MARKET, BY SERVICE TYPE,  2017–2021 (USD MILLION)
                       TABLE 90 EUROPE: MARKET, BY SERVICE TYPE,  2022–2027 (USD MILLION)
                       TABLE 91 EUROPE: MARKET, BY ORGANIZATION SIZE, 2017–2021 (USD MILLION)
                       TABLE 92 EUROPE: MARKET, BY ORGANIZATION SIZE, 2022–2027 (USD MILLION)
                       TABLE 93 EUROPE: MARKET, BY CLOUD DEPLOYMENT MODE, 2017–2021 (USD MILLION)
                       TABLE 94 EUROPE: MARKET, BY CLOUD DEPLOYMENT MODE, 2022–2027 (USD MILLION)
                       TABLE 95 EUROPE: MARKET, BY VERTICAL,  2017–2021 (USD MILLION)
                       TABLE 96 EUROPE: MARKET, BY VERTICAL,  2022–2027 (USD MILLION)
                       TABLE 97 EUROPE: MARKET, BY COUNTRY,  2017–2021 (USD MILLION)
                       TABLE 98 EUROPE: MARKET, BY COUNTRY,  2022–2027 (USD MILLION)
             10.3.3 UK
                       10.3.3.1 Growth of third-party service providers
                                   TABLE 99 UK: APPLICATION MODERNIZATION SERVICES MARKET, BY SERVICE TYPE,  2017–2021 (USD MILLION)
                                   TABLE 100 UK: MARKET, BY SERVICE TYPE,  2022–2027 (USD MILLION)
                                   TABLE 101 UK: MARKET, BY ORGANIZATION SIZE,  2017–2021 (USD MILLION)
                                   TABLE 102 UK: MARKET, BY ORGANIZATION SIZE,  2022–2027 (USD MILLION)
                                   TABLE 103 UK: MARKET, BY CLOUD DEPLOYMENT MODE, 2017–2021 (USD MILLION)
                                   TABLE 104 UK: MARKET, BY CLOUD DEPLOYMENT MODE, 2022–2027 (USD MILLION)
                                   TABLE 105 UK: MARKET, BY VERTICAL,  2017–2021 (USD MILLION)
                                   TABLE 106 UK: MARKET, BY VERTICAL,  2022–2027 (USD MILLION)
             10.3.4 GERMANY
                       10.3.4.1 Rapid digitization across industries to drive growth
                                   TABLE 107 GERMANY: APPLICATION MODERNIZATION SERVICES MARKET, BY SERVICE TYPE,  2017–2021 (USD MILLION)
                                   TABLE 108 GERMANY: MARKET, BY SERVICE TYPE,  2022–2027 (USD MILLION)
                                   TABLE 109 GERMANY: MARKET, BY ORGANIZATION SIZE, 2017–2021 (USD MILLION)
                                   TABLE 110 GERMANY: MARKET, BY ORGANIZATION SIZE, 2022–2027 (USD MILLION)
                                   TABLE 111 GERMANY: MARKET, BY CLOUD DEPLOYMENT MODE, 2017–2021 (USD MILLION)
                                   TABLE 112 GERMANY: MARKET, BY CLOUD DEPLOYMENT MODE, 2022–2027 (USD MILLION)
                                   TABLE 113 GERMANY: MARKET, BY VERTICAL,  2017–2021 (USD MILLION)
                                   TABLE 114 GERMANY: MARKET, BY VERTICAL,  2022–2027 (USD MILLION)
             10.3.5 FRANCE
                       10.3.5.1 Adoption of cloud services and ongoing smart city projects to boost demand for application modernization services
                                   TABLE 115 FRANCE: APPLICATION MODERNIZATION SERVICES MARKET, BY SERVICE TYPE,  2017–2021 (USD MILLION)
                                   TABLE 116 FRANCE: MARKET, BY SERVICE TYPE, 2022–2027 (USD MILLION)
                                   TABLE 117 FRANCE: MARKET, BY ORGANIZATION SIZE, 2017–2021 (USD MILLION)
                                   TABLE 118 FRANCE: MARKET, BY ORGANIZATION SIZE, 2022–2027 (USD MILLION)
                                   TABLE 119 FRANCE: MARKET, BY CLOUD DEPLOYMENT MODE, 2017–2021 (USD MILLION)
                                   TABLE 120 FRANCE: MARKET, BY CLOUD DEPLOYMENT MODE, 2022–2027 (USD MILLION)
                                   TABLE 121 FRANCE: MARKET, BY VERTICAL,  2017–2021 (USD MILLION)
                                   TABLE 122 FRANCE: MARKET, BY VERTICAL,  2022–2027 (USD MILLION)
             10.3.6 REST OF EUROPE
     10.4 ASIA PACIFIC 
             10.4.1 ASIA PACIFIC: MARKET DRIVERS
             10.4.2 ASIA PACIFIC: RECESSION IMPACT
                       FIGURE 36 ASIA PACIFIC: APPLICATION MODERNIZATION SERVICES MARKET SNAPSHOT
                       TABLE 123 ASIA PACIFIC: MARKET, BY SERVICE TYPE,  2017–2021 (USD MILLION)
                       TABLE 124 ASIA PACIFIC: MARKET, BY SERVICE TYPE, 2022–2027 (USD MILLION)
                       TABLE 125 ASIA PACIFIC: MARKET, BY ORGANIZATION SIZE, 2017–2021 (USD MILLION)
                       TABLE 126 ASIA PACIFIC: MARKET, BY ORGANIZATION SIZE, 2022–2027 (USD MILLION)
                       TABLE 127 ASIA PACIFIC: MARKET, BY CLOUD DEPLOYMENT MODE, 2017–2021 (USD MILLION)
                       TABLE 128 ASIA PACIFIC: MARKET, BY CLOUD DEPLOYMENT MODE, 2022–2027 (USD MILLION)
                       TABLE 129 ASIA PACIFIC: MARKET, BY VERTICAL,  2017–2021 (USD MILLION)
                       TABLE 130 ASIA PACIFIC: MARKET, BY VERTICAL,  2022–2027 (USD MILLION)
                       TABLE 131 ASIA PACIFIC: MARKET, BY COUNTRY, 2017–2021 (USD MILLION)
                       TABLE 132 ASIA PACIFIC: MARKET, BY COUNTRY,  2022–2027 (USD MILLION)
             10.4.3 CHINA
                       10.4.3.1 Enterprises to modernize applications to stay competitive and sustain growth
                                   TABLE 133 CHINA: APPLICATION MODERNIZATION SERVICES MARKET, BY SERVICE TYPE,  2017–2021 (USD MILLION)
                                   TABLE 134 CHINA: MARKET, BY SERVICE TYPE,  2022–2027 (USD MILLION)
                                   TABLE 135 CHINA: MARKET, BY ORGANIZATION SIZE, 2017–2021 (USD MILLION)
                                   TABLE 136 CHINA: MARKET, BY ORGANIZATION SIZE, 2022–2027 (USD MILLION)
                                   TABLE 137 CHINA: MARKET, BY CLOUD DEPLOYMENT MODE, 2017–2021 (USD MILLION)
                                   TABLE 138 CHINA: MARKET, BY CLOUD DEPLOYMENT MODE, 2022–2027 (USD MILLION)
                                   TABLE 139 CHINA: MARKET, BY VERTICAL,  2017–2021 (USD MILLION)
                                   TABLE 140 CHINA: MARKET, BY VERTICAL,  2022–2027 (USD MILLION)
             10.4.4 JAPAN
                       10.4.4.1 Highly developed communication infrastructure to drive demand for application modernization services
                                   TABLE 141 JAPAN: APPLICATION MODERNIZATION SERVICES MARKET, BY SERVICE TYPE,  2017–2021 (USD MILLION)
                                   TABLE 142 JAPAN: MARKET, BY SERVICE TYPE,  2022–2027 (USD MILLION)
                                   TABLE 143 JAPAN: MARKET, BY ORGANIZATION SIZE, 2017–2021 (USD MILLION)
                                   TABLE 144 JAPAN: MARKET, BY ORGANIZATION SIZE, 2022–2027 (USD MILLION)
                                   TABLE 145 JAPAN: MARKET, BY CLOUD DEPLOYMENT MODE, 2017–2021 (USD MILLION)
                                   TABLE 146 JAPAN: MARKET, BY CLOUD DEPLOYMENT MODE, 2022–2027 (USD MILLION)
                                   TABLE 147 JAPAN: MARKET, BY VERTICAL,  2017–2021 (USD MILLION)
                                   TABLE 148 JAPAN: MARKET, BY VERTICAL,  2022–2027 (USD MILLION)
             10.4.5 AUSTRALIA
                       10.4.5.1 Increasing demand by SMEs to adopt legacy applications and deliver high-quality education.
                                   TABLE 149 AUSTRALIA: APPLICATION MODERNIZATION SERVICES MARKET, BY SERVICE TYPE,  2017–2021 (USD MILLION)
                                   TABLE 150 AUSTRALIA: MARKET, BY SERVICE TYPE,  2022–2027 (USD MILLION)
                                   TABLE 151 AUSTRALIA: MARKET, BY ORGANIZATION SIZE, 2017–2021 (USD MILLION)
                                   TABLE 152 AUSTRALIA: MARKET, BY ORGANIZATION SIZE, 2022–2027 (USD MILLION)
                                   TABLE 153 AUSTRALIA: MARKET, BY CLOUD DEPLOYMENT MODE, 2017–2021 (USD MILLION)
                                   TABLE 154 AUSTRALIA: MARKET, BY CLOUD DEPLOYMENT MODE, 2022–2027 (USD MILLION)
             10.4.6 INDIA
                       10.4.6.1 Government initiatives and rapid development of digital infrastructure to increase adoption of application modernization services
                                   TABLE 155 INDIA: APPLICATION MODERNIZATION SERVICES MARKET, BY SERVICE TYPE,  2017–2021 (USD MILLION)
                                   TABLE 156 INDIA: MARKET, BY SERVICE TYPE,  2022–2027 (USD MILLION)
                                   TABLE 157 INDIA: MARKET, BY ORGANIZATION SIZE, 2017–2021 (USD MILLION)
                                   TABLE 158 INDIA: MARKET, BY ORGANIZATION SIZE, 2022–2027 (USD MILLION)
                                   TABLE 159 INDIA: MARKET, BY CLOUD DEPLOYMENT MODE, 2017–2021 (USD MILLION)
                                   TABLE 160 INDIA: MARKET, BY CLOUD DEPLOYMENT MODE, 2022–2027 (USD MILLION)
             10.4.7 REST OF ASIA PACIFIC
     10.5 MIDDLE EAST AND AFRICA 
             10.5.1 MIDDLE EAST AND AFRICA: MARKET DRIVERS
             10.5.2 MIDDLE EAST AND AFRICA: RECESSION IMPACT
                       TABLE 161 MIDDLE EAST AND AFRICA: APPLICATION MODERNIZATION SERVICES MARKET,  BY SERVICE TYPE, 2017–2021 (USD MILLION)
                       TABLE 162 MIDDLE EAST AND AFRICA: MARKET,  BY SERVICE TYPE, 2022–2027 (USD MILLION)
                       TABLE 163 MIDDLE EAST AND AFRICA: MARKET,  BY ORGANIZATION SIZE, 2017–2021 (USD MILLION)
                       TABLE 164 MIDDLE EAST AND AFRICA: MARKET,  BY ORGANIZATION SIZE, 2022–2027 (USD MILLION)
                       TABLE 165 MIDDLE EAST AND AFRICA: MARKET,  BY CLOUD DEPLOYMENT MODE, 2017–2021 (USD MILLION)
                       TABLE 166 MIDDLE EAST AND AFRICA: MARKET, BY CLOUD DEPLOYMENT MODE, 2022–2027 (USD MILLION)
                       TABLE 167 MIDDLE EAST AND AFRICA: MARKET,  BY VERTICAL, 2017–2021 (USD MILLION)
                       TABLE 168 MIDDLE EAST AND AFRICA: MARKET,  BY VERTICAL, 2022–2027 (USD MILLION)
                       TABLE 169 MIDDLE EAST AND AFRICA: MARKET,  BY COUNTRY, 2017–2021 (USD MILLION)
                       TABLE 170 MIDDLE EAST AND AFRICA: PUBLIC CLOUD STORAGE MARKET, BY COUNTRY,  2022–2027 (USD MILLION)
             10.5.3 KSA
                       10.5.3.1 Digital transformation, technological advancements, and government cloud policies to increase adoption of application modernization services
                                   TABLE 171 KSA: APPLICATION MODERNIZATION SERVICES MARKET, BY SERVICE TYPE,  2017–2021 (USD MILLION)
                                   TABLE 172 KSA: MARKET, BY SERVICE TYPE,  2022–2027 (USD MILLION)
                                   TABLE 173 KSA: MARKET, BY ORGANIZATION SIZE,  2017–2021 (USD MILLION)
                                   TABLE 174 KSA: MARKET, BY ORGANIZATION SIZE,  2022–2027 (USD MILLION)
                                   TABLE 175 KSA: MARKET, BY CLOUD DEPLOYMENT MODE, 2017–2021 (USD MILLION)
                                   TABLE 176 KSA: MARKET, BY CLOUD DEPLOYMENT MODE, 2022–2027 (USD MILLION)
             10.5.4 SOUTH AFRICA
                       10.5.4.1 IT spending and adoption of cloud services to grow rapidly
                                   TABLE 177 SOUTH AFRICA: APPLICATION MODERNIZATION SERVICES MARKET, BY SERVICE TYPE,  2017–2021 (USD MILLION)
                                   TABLE 178 SOUTH AFRICA: MARKET, BY SERVICE TYPE,  2022–2027 (USD MILLION)
                                   TABLE 179 SOUTH AFRICA: MARKET, BY ORGANIZATION SIZE, 2017–2021 (USD MILLION)
                                   TABLE 180 SOUTH AFRICA: MARKET, BY ORGANIZATION SIZE, 2022–2027 (USD MILLION)
                                   TABLE 181 SOUTH AFRICA: MARKET, BY CLOUD DEPLOYMENT MODE, 2017–2021 (USD MILLION)
                                   TABLE 182 SOUTH AFRICA: MARKET, BY CLOUD DEPLOYMENT MODE, 2022–2027 (USD MILLION)
             10.5.5 REST OF MIDDLE EAST AND AFRICA
     10.6 LATIN AMERICA 
             10.6.1 LATIN AMERICA: MARKET DRIVERS
             10.6.2 LATIN AMERICA: RECESSION IMPACT
                       TABLE 183 LATIN AMERICA: APPLICATION MODERNIZATION SERVICES MARKET, BY SERVICE TYPE,  2017–2021 (USD MILLION)
                       TABLE 184 LATIN AMERICA: MARKET, BY SERVICE TYPE,  2022–2027 (USD MILLION)
                       TABLE 185 LATIN AMERICA: MARKET, BY ORGANIZATION SIZE, 2017–2021 (USD MILLION)
                       TABLE 186 LATIN AMERICA: MARKET, BY ORGANIZATION SIZE, 2022–2027 (USD MILLION)
                       TABLE 187 LATIN AMERICA: MARKET, BY CLOUD DEPLOYMENT MODE, 2017–2021 (USD MILLION)
                       TABLE 188 LATIN AMERICA: MARKET, BY CLOUD DEPLOYMENT MODE, 2022–2027 (USD MILLION)
                       TABLE 189 LATIN AMERICA: MARKET, BY VERTICAL, 2017–2021 (USD MILLION)
                       TABLE 190 LATIN AMERICA: MARKET, BY VERTICAL,  2022–2027 (USD MILLION)
                       TABLE 191 LATIN AMERICA: MARKET, BY COUNTRY,  2017–2021 (USD MILLION)
                       TABLE 192 LATIN AMERICA: MARKET, BY COUNTRY,  2022–2027 (USD MILLION)
             10.6.3 BRAZIL
                       10.6.3.1 Investments by government to boost mobile technologies offering enhanced services
                                   TABLE 193 BRAZIL: APPLICATION MODERNIZATION SERVICES MARKET, BY SERVICE TYPE,  2017–2021 (USD MILLION)
                                   TABLE 194 BRAZIL: MARKET, BY SERVICE TYPE,  2022–2027 (USD MILLION)
                                   TABLE 195 BRAZIL: MARKET, BY ORGANIZATION SIZE, 2017–2021 (USD MILLION)
                                   TABLE 196 BRAZIL: MARKET, BY ORGANIZATION SIZE, 2022–2027 (USD MILLION)
                                   TABLE 197 BRAZIL: MARKET, BY CLOUD DEPLOYMENT MODE, 2017–2021 (USD MILLION)
                                   TABLE 198 BRAZIL: MARKET, BY CLOUD DEPLOYMENT MODE, 2022–2027 (USD MILLION)
             10.6.4 MEXICO
                       10.6.4.1 Digital innovation, data-driven business models, and modern cloud-centric infrastructure to accelerate market growth
                                   TABLE 199 MEXICO: APPLICATION MODERNIZATION SERVICES MARKET, BY SERVICE TYPE,  2017–2021 (USD MILLION)
                                   TABLE 200 MEXICO: MARKET, BY SERVICE TYPE,  2022–2027 (USD MILLION)
                                   TABLE 201 MEXICO: MARKET, BY ORGANIZATION SIZE, 2017–2021 (USD MILLION)
                                   TABLE 202 MEXICO: MARKET, BY ORGANIZATION SIZE, 2022–2027 (USD MILLION)
                                   TABLE 203 MEXICO: MARKET, BY CLOUD DEPLOYMENT MODE, 2017–2021 (USD MILLION)
                                   TABLE 204 MEXICO: MARKET, BY CLOUD DEPLOYMENT MODE, 2022–2027 (USD MILLION)
             10.6.5 REST OF LATIN AMERICA
 
11 COMPETITIVE LANDSCAPE (Page No. - 188)
     11.1 INTRODUCTION 
     11.2 STRATEGIES ADOPTED BY KEY PLAYERS 
     11.3 MARKET SHARE ANALYSIS 
               TABLE 205 MARKET SHARE OF KEY VENDORS IN, 2022
               FIGURE 37 APPLICATION MODERNIZATION SERVICES MARKET: MARKET  SHARE ANALYSIS
     11.4 HISTORICAL REVENUE ANALYSIS OF TOP VENDORS 
               FIGURE 38 HISTORICAL REVENUE ANALYSIS, 2017–2021 (USD MILLION)
     11.5 KEY COMPANY EVALUATION QUADRANT 
               FIGURE 39 COMPANY EVALUATION MATRIX FOR KEY PLAYERS: CRITERIA WEIGHTAGE
             11.5.1 STARS
             11.5.2 EMERGING LEADERS
             11.5.3 PERVASIVE PLAYERS
             11.5.4 PARTICIPANTS
                       FIGURE 40 COMPANY EVALUATION QUADRANT FOR KEY PLAYERS
                       TABLE 206 OVERALL COMPANY FOOTPRINT FOR KEY PLAYERS
     11.6 EVALUATION QUADRANT FOR STARTUPS/SMES, 2022 
               FIGURE 41 EVALUATION MATRIX FOR STARTUPS/SMES: CRITERIA WEIGHTAGE
             11.6.1 RESPONSIVE COMPANIES
             11.6.2 PROGRESSIVE COMPANIES
             11.6.3 DYNAMIC COMPANIES
             11.6.4 STARTING BLOCKS
                       FIGURE 42 EVALUATION QUADRANT FOR STARTUPS/SMES
                       TABLE 207 OVERALL COMPANY FOOTPRINT FOR STARTUPS/SMES
             11.6.5 COMPETITIVE BENCHMARKING OF STARTUPS/SMES
                       TABLE 208 DETAILED LIST OF KEY STARTUPS/SMES
     11.7 KEY MARKET DEVELOPMENTS 
               TABLE 209 MARKET: PRODUCT LAUNCHES AND ENHANCEMENTS, 2019–2023
               TABLE 210 APPLICATION MODERNIZATION SERVICES MARKET: DEALS, 2019–2023
 
12 COMPANY PROFILES (Page No. - 219)
     12.1 INTRODUCTION 
     12.2 MAJOR PLAYERS 
(Business overview, Products/Solutions/Services offered, Recent developments, MNM view, Key strengths, Strategic choices, and Weaknesses and competitive threats)*
             12.2.1 IBM
                       TABLE 211 IBM: BUSINESS OVERVIEW
                       FIGURE 43 IBM: COMPANY SNAPSHOT
                       TABLE 212 IBM: SERVICES OFFERED
                       TABLE 213 IBM: PRODUCT LAUNCHES AND ENHANCEMENTS
                       TABLE 214 IBM: DEALS
             12.2.2 ACCENTURE
                       TABLE 215 ACCENTURE: BUSINESS OVERVIEW
                       FIGURE 44 ACCENTURE: COMPANY SNAPSHOT
                       TABLE 216 ACCENTURE: SERVICES OFFERED
                       TABLE 217 ACCENTURE: PRODUCT LAUNCHES AND ENHANCEMENTS
                       TABLE 218 ACCENTURE: DEALS
             12.2.3 HCL TECHNOLOGIES
                       TABLE 219 HCL TECHNOLOGIES: BUSINESS OVERVIEW
                       FIGURE 45 HCL TECHNOLOGIES: COMPANY SNAPSHOT
                       TABLE 220 HCL TECHNOLOGIES: SERVICES OFFERED
                       TABLE 221 HCL TECHNOLOGIES: PRODUCT LAUNCHES AND ENHANCEMENTS
                       TABLE 222 HCL TECHNOLOGIES: DEALS
             12.2.4 ATOS
                       TABLE 223 ATOS: BUSINESS OVERVIEW
                       FIGURE 46 ATOS: COMPANY SNAPSHOT
                       TABLE 224 ATOS: SERVICES OFFERED
                       TABLE 225 ATOS: PRODUCT LAUNCHES AND ENHANCEMENTS
                       TABLE 226 ATOS: DEALS
             12.2.5 CAPGEMINI
                       TABLE 227 CAPGEMINI: BUSINESS OVERVIEW
                       FIGURE 47 CAPGEMINI: COMPANY SNAPSHOT
                       TABLE 228 CAPGEMINI: SERVICES OFFERED
                       TABLE 229 CAPGEMINI: PRODUCT LAUNCHES & ENHANCEMENT
                       TABLE 230 CAPGEMINI: DEALS
             12.2.6 COGNIZANT
                       TABLE 231 COGNIZANT: BUSINESS OVERVIEW
                       FIGURE 48 COGNIZANT: COMPANY SNAPSHOT
                       TABLE 232 COGNIZANT: SERVICES OFFERED
                       TABLE 233 COGNIZANT: PRODUCT LAUNCHES AND ENHANCEMENTS
                       TABLE 234 COGNIZANT: DEALS
             12.2.7 TCS
                       TABLE 235 TCS: BUSINESS OVERVIEW
                       FIGURE 49 TCS: COMPANY SNAPSHOT
                       TABLE 236 TCS: SERVICES OFFERED
                       TABLE 237 TCS: PRODUCT LAUNCHES & ENHANCEMENT
                       TABLE 238 TCS: DEALS
             12.2.8 BELL INTEGRATOR
                       TABLE 239 BELL INTEGRATOR: BUSINESS OVERVIEW
                       TABLE 240 SERVICES OFFERED
                       TABLE 241 BELL INTEGRATOR: PRODUCT LAUNCHES AND ENHANCEMENTS
                       TABLE 242 BELL INTEGRATOR: DEALS
             12.2.9 ORACLE
                       TABLE 243 ORACLE: BUSINESS OVERVIEW
                       FIGURE 50 ORACLE: COMPANY SNAPSHOT
                       TABLE 244 ORACLE: SERVICES OFFERED
                       TABLE 245 ORACLE: PRODUCT LAUNCHES AND ENHANCEMENTS
                       TABLE 246 ORACLE: DEALS
             12.2.10 MICROSOFT
                       TABLE 247 MICROSOFT: BUSINESS OVERVIEW
                       FIGURE 51 MICROSOFT: COMPANY SNAPSHOT
                       TABLE 248 MICROSOFT: SERVICES OFFERED
                       TABLE 249 MICROSOFT: PRODUCT LAUNCHES AND ENHANCEMENTS
                       TABLE 250 MICROSOFT: DEALS
     12.3 OTHER PLAYERS 
             12.3.1 INNOVA SOLUTIONS
             12.3.2 EPAM SYSTEMS
             12.3.3 ASPIRE SYSTEMS
             12.3.4 NTT DATA
             12.3.5 DELL TECHNOLOGIES
             12.3.6 DXC TECHNOLOGY
             12.3.7 INFOSYS
             12.3.8 LTI
             12.3.9 WIPRO
             12.3.10 MICRO FOCUS
             12.3.11 FUJITSU
             12.3.12 SOFTURA
             12.3.13 HEXAWARE TECHNOLOGIES
             12.3.14 VIRTUSA
             12.3.15 MONGODB
     12.4 STARTUPS/SMES 
             12.4.1 CLOUDHEDGE
             12.4.2 D3V TECHNOLOGY SOLUTIONS
             12.4.3 BAYSHORE INTELLIGENCE SOLUTIONS
             12.4.4 OPINOV8
             12.4.5 PRIME TSR
             12.4.6 ONE SIX SOLUTIONS
             12.4.7 CLEVEROAD
             12.4.8 TECHAHEAD
             12.4.9 GEOMOTIV
             12.4.10 SOFT SUAVE
*Details on Business overview, Products/Solutions/Services offered, Recent developments, MNM view, Key strengths, Strategic choices, and Weaknesses and competitive threats might not be captured in case of unlisted companies.
 
13 ADJACENT/RELATED MARKET (Page No. - 290)
     13.1 INTRODUCTION 
             13.1.1 RELATED MARKET
             13.1.2 LIMITATIONS
     13.2 CLOUD APPLICATIONS MARKET 
               TABLE 251 CLOUD APPLICATIONS MARKET, BY ORGANIZATION SIZE,  2018–2025 (USD MILLION)
               TABLE 252 LARGE ENTERPRISES: CLOUD APPLICATIONS MARKET, BY REGION,  2018–2025 (USD MILLION)
               TABLE 253 SMALL AND MEDIUM-SIZED ENTERPRISES: CLOUD APPLICATIONS MARKET,  BY REGION, 2018–2025 (USD MILLION)
     13.3 APPLICATION TRANSFORMATION MARKET 
               TABLE 254 APPLICATION TRANSFORMATION MARKET, BY VERTICAL,  2017–2024 (USD MILLION)
               TABLE 255 RETAIL: APPLICATION TRANSFORMATION MARKET, BY REGION,  2017–2024 (USD MILLION)
               TABLE 256 IT AND TELECOMMUNICATION: APPLICATION TRANSFORMATION MARKET,  BY REGION, 2017–2024 (USD MILLION)
               TABLE 257 HEALTHCARE: APPLICATION TRANSFORMATION MARKET, BY REGION,  2017–2024 (USD MILLION)
               TABLE 258 BFSI: APPLICATION TRANSFORMATION MARKET SIZE, BY REGION,  2017–2024 (USD MILLION)
               TABLE 259 GOVERNMENT: APPLICATION TRANSFORMATION MARKET, BY REGION,  2017–2024 (USD MILLION)
               TABLE 260 MANUFACTURING: APPLICATION TRANSFORMATION MARKET, BY REGION,  2017–2024 (USD MILLION)
     13.4 CLOUD MICROSERVICES MARKET 
               TABLE 261 CLOUD MICROSERVICES MARKET SIZE, BY COMPONENT, 2016–2023 (USD MILLION)
               TABLE 262 PLATFORM: CLOUD MICROSERVICES MARKET, BY REGION,  2016–2023 (USD MILLION)
               TABLE 263 SERVICES: CLOUD MICROSERVICES MARKET, BY REGION,  2016–2023 (USD MILLION)
               TABLE 264 SERVICES: CLOUD MICROSERVICES MARKET, BY TYPE, 2016–2023 (USD MILLION)
               TABLE 265 CONSULTING SERVICES MARKET, BY REGION, 2016–2023 (USD MILLION)
               TABLE 266 INTEGRATION SERVICES MARKET, BY REGION, 2016–2023 (USD MILLION)
               TABLE 267 TRAINING, SUPPORT, AND MAINTENANCE SERVICES MARKET, BY REGION,  2016–2023 (USD MILLION)
 
14 APPENDIX (Page No. - 298)
     14.1 DISCUSSION GUIDE 
     14.2 KNOWLEDGESTORE: MARKETSANDMARKETS’  SUBSCRIPTION PORTAL 
     14.3 CUSTOMIZATION OPTIONS 
     14.4 RELATED REPORTS 
     14.5 AUTHOR DETAILS 

The study involved four major activities in estimating the size of the application modernization services market. Exhaustive secondary research was done to collect information on the market, peer market, and parent market. The next step was to validate these findings, assumptions, and sizing with industry experts across value chains through primary research. The bottom-up approach was employed to estimate the overall market size. After that, market breakdown and data triangulation were used to estimate the market size of segments and subsegments.

Secondary Research

The market size of companies offering application modernization services was derived on the basis of the secondary data available through paid and unpaid sources and by analyzing the product portfolios of major companies in the ecosystem and rating the companies based on their product capabilities and business strategies. In the secondary research process, various sources were referred to for identifying and collecting information for the study. Secondary sources included annual reports, press releases, and investor presentations of companies and product data sheets; white papers; journals; certified publications; and articles from recognized authors, government websites, directories, and databases.

Secondary research was majorly used to obtain the key information related to the industry’s supply chain, the total pool of key players, market classification, and segmentation according to industry trends to the bottom-most level, regional markets, and key developments from both market and technology-oriented perspectives; all of which were further validated by primary sources.

Primary Research

In the primary research process, various primary sources from both the supply and demand sides were interviewed to obtain qualitative and quantitative information on the market. The primary sources from the supply side included various industry experts, including Chief Experience Officers (CXOs); Vice Presidents (VPs); directors from business development, marketing, and product development/innovation teams; related key executives from application modernization services vendors, industry associations, and independent consultants; and key opinion leaders.

Primary interviews were conducted to gather insights, such as market statistics, the latest trends disrupting the market, new use cases implemented, data on revenue collected from products and services, market breakups, market size estimations, market forecasts, and data triangulation. Primary research also helped in understanding various trends related to technology, component, deployment, and region. Demand-side stakeholders, such as Chief Information Officers (CIOs), Chief Technology Officers (CTOs), Chief Security Officers (CSOs), the installation teams of governments/end users using application modernization services, and digital initiatives project teams, were interviewed to understand the buyer’s perspective on suppliers, products, service providers, and their current use, which would affect the overall application modernization services market.
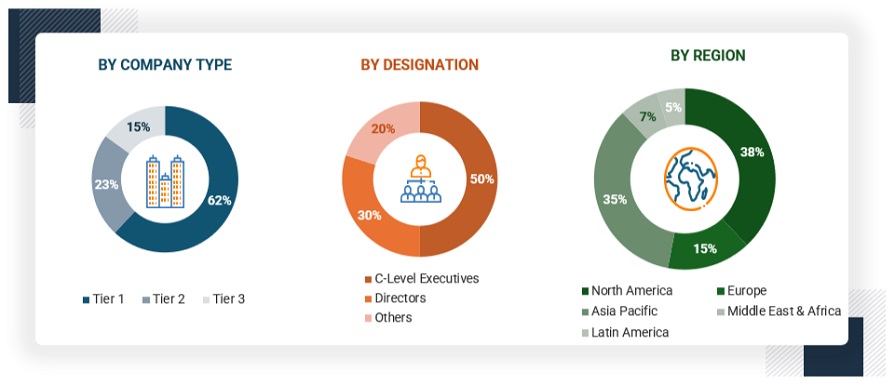
Application Modernization Services Market Size, and Share

To know about the assumptions considered for the study, download the pdf brochure

Market Size Estimation

Both top-down and bottom-up approaches were used to estimate and forecast the application modernization services market and other dependent submarkets. The bottom-up procedure was deployed to arrive at the overall market size using the revenues and offerings of key companies in the market. With data triangulation methods and validation through primary interviews, the exact value of the overall parent market size was determined and confirmed using this study. The overall market size was then used in the top-down procedure to estimate the size of other individual markets via percentage splits of the market segments.

Data Triangulation

After arriving at the overall market size—using the market size estimation processes as explained above—the market was split into several segments and subsegments. Data triangulation and market breakdown procedures were employed, wherever applicable, to complete the overall market engineering process and arrive at the exact statistics of each market segment and subsegment. The data was triangulated by studying various factors and trends from the demand and supply sides in BFSI, healthcare and life sciences, telecommunication, IT & ITeS, retail & consumer goods, government and public sector, energy & utilities, manufacturing, and other verticals.

Report Objectives

  • To determine and forecast the global application modernization services market based on service type, cloud deployment modes, organization size, verticals, and regions from 2022 to 2027, and analyze various macro and microeconomic factors affecting the market growth.
  • To forecast the market size of five main regions: North America, Europe, Asia Pacific, Middle East and Africa, and Latin America
  • To analyze subsegments concerning individual growth trends, prospects, and contributions to the total market.
  • To provide detailed information about the major factors (drivers, restraints, opportunities, and challenges) influencing the market's growth.
  • To provide recession impact on the adoption of application modernization services adoption.
  • To analyze the opportunities in the market for stakeholders and provide details of the competitive landscape of the major players.
  • To comprehensively analyze the core competencies of the key players in the market.
  • To track and analyze the competitive developments, such as product/solution launches and enhancements, business expansions, acquisitions, partnerships, and contracts and collaborations, in the market.

Available Customizations

With the given market data, MarketsandMarkets offers customizations as per the company’s specific needs. The following customization options are available for the report:

Product Analysis

  • Product matrix provides a detailed comparison of the product portfolio of each company

Geographic Analysis

  • Further breakup of the North American digital map market

Company Information

  • Detailed analysis and profiling of additional market players up to 5
Custom Market Research Services

We will customize the research for you, in case the report listed above does not meet with your exact requirements. Our custom research will comprehensively cover the business information you require to help you arrive at strategic and profitable business decisions.

Request Customization

Instant Answers with GPT - Ask Now!

Ask real questions. Get complete answers !
Report Code
TC 5645
Published ON
Feb, 2023
Choose License Type
BUY NOW
  • SHARE
X
Request Customization
Speak to Analyst
Speak to Analyst
OR FACE-TO-FACE MEETING
PERSONALIZE THIS RESEARCH
  • Triangulate with your Own Data
  • Get Data as per your Format and Definition
  • Gain a Deeper Dive on a Specific Application, Geography, Customer or Competitor
  • Any level of Personalization
REQUEST A FREE CUSTOMIZATION
LET US HELP YOU!
  • What are the Known and Unknown Adjacencies Impacting the Application Modernization Services Market
  • What will your New Revenue Sources be?
  • Who will be your Top Customer; what will make them switch?
  • Defend your Market Share or Win Competitors
  • Get a Scorecard for Target Partners
CUSTOMIZED WORKSHOP REQUEST
+1-888-600-6441
  • Call Us
  • +1-888-600-6441 (Corporate office hours)
  • +1-888-600-6441 (US/Can toll free)
  • +44-800-368-9399 (UK office hours)
CONNECT WITH US
ABOUT TRUST ONLINE
©2024 MarketsandMarkets Research Private Ltd. All rights reserved
DMCA.com Protection Status Website Feedback