Metalworking Fluids Market by Product Type (Removal, Forming, Protection, and Treating Fluids), by End-Use Application (Transport Equipment, Machinery, Metal Fabrication, Primary Ferrous, and Non-Ferrous,), by Region - Global Forecast to 2020


[148 Pages Report] The metalworking fluids market was estimated to be worth USD 8.30 billion in 2014 and is projected to reach USD 9.74 billion, by 2020, at a CAGR of 3.2% between 2015 and 2020. Removal fluid is expected to play a key role in fueling the growth of the overall metalworking fluids market owing to its use as a coolant across the manufacturing industry. The removal fluids are used for maintaining optimum temperature and the removal of unwanted metal chips during the grinding, drilling, and other processes. In this report, 2014 is considered as the base year and forecast period is between 2015 and 2020.
Market Dynamics
Drivers
- Massive industrial growth in Asia-Pacific and Middle East & Africa
- Growing automotive industry in South America
Restraints
- Reduction in metal parts by automakers and OEMs
- Minimum Quantity Lubrication (MQL) and near dry machining
Opportunities
- Multi-Phase Metalworking Fluids
Challenges
- Environmental Regualtions
Massinve Industrial Growth in Asia-Pacific and Middle East & Africa
The industrial development in Asia-Pacific and Africa has been fueling growth of the metalworking fluids market from the past few years and this trend is expected to continue over the next five years. The liberalization of foreign trade & investments and the change in industrial policies (allowing private enterprises) have triggered rapid industrialization in China over the past three decades. Domestic and foreign investments in key sectors such as energy, manufacturing, construction, and transportation have been consistently growing over the past decade.
The objectives of this study are:
- To analyze and forecast the market size, in terms of value and volume, of metalworking fluids
- To define, describe, and forecast the market for metalworking fluids by application, by type, and by region
- To forecast the market size of metalworking fluids and its different sub markets by five regions� Europe, North America, Asia-Pacific, South America, and Middle East & Africa
- To identify significant market trends and the factors, which are driving or inhibiting the growth of the metalworking fluids market
- To strategically analyze each submarket with respect to individual growth trends and their contribution to the metalworking fluids market
- To analyze opportunities in the market for the stakeholders by identifying high-growth segments of the metalworking fluids market
- To strategically profile the key players and comprehensively analyze their core competencies
- To analyze competitive developments, such as expansions, joint ventures, new products launches, and acquisitions in the metalworking fluids market
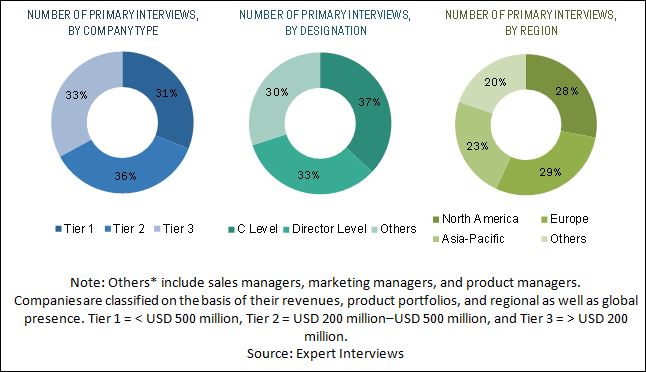
In this report, market sizes have been derived using both bottom-up and top-down approaches. First, the market size for each product type (removal fluids, forming fluids, protecting fluids, and treating fluids) in various regions (North America, APAC, Europe, South America, and Middle East & Africa) and countries have been estimated through secondary and primary research. The overall metalworking fluids market sizes for various regions and countries have been calculated by adding these individual market sizes. Regional-level metalworking fluids market sizes have been further broken down on the basis application using percentage split gathered during the research. For future growth (CAGRs) trends of the industrial lubricant market, metalworking fluids penetration, application industries � automotive, machinery, primary ferrous and non-ferrous , among others, have been analyzed. The findings of this study were verified through primary research by conducting extensive interviews with key officials such as CEOs, VPs, directors, and executives. The breakdown of profiles of primary interviewees is depicted in the below figure:
To know about the assumptions considered for the study, download the pdf brochure
The major metalworking fluids manufacturers are ExxonMobil Corporation (U.S.), Houghton International Inc. (U.S.), Fuchs Petrolub SE (Germany), Total S.A. (France), Chevron Corporation (U.S.), Lubrizol Corporation (U.S.), Idemitsu Kosan Co. Ltd (Japan), and Lukoil Oil Company (Russia).
Major Market Developments
- In October 2015, Idemitsu Kosan Co. Ltd. (Japan) expanded its production capacity In China. This strategic step was taken to cater to the growing demand for lubricants in Asia-Pacific with increasing manufacturing activities
- In October 2015, Chevron Corp. (U.S.) launched ISOCLEAN brand of lubricants, which meets the stringent quality measures set up by OEMs for longer machine life. These lubricants reduce unscheduled downtime and enhance machine life
- In July 2015, Total S.A. (France) established a lubricant blending plant in Singapore. This will strengthen its position in the accelerating lubricant market in Asia-Pacific. The production of automotive and industrial lubricants will be carried out in the plant
The target audiences for the metalworking fluids market report are as follows:
- Metalworking fluids manufacturers
- Metalworking fluids suppliers
- Metalworking fluids formulators
- Raw material suppliers
- Service providers
- End users such as automobile, aviation, marine, and manufacturing companies
Get online access to the report on the World's First Market Intelligence Cloud
- Easy to Download Historical Data & Forecast Numbers
- Company Analysis Dashboard for high growth potential opportunities
- Research Analyst Access for customization & queries
- Competitor Analysis with Interactive dashboard
- Latest News, Updates & Trend analysis
Request Sample Scope of the Report
:
Get online access to the report on the World's First Market Intelligence Cloud
- Easy to Download Historical Data & Forecast Numbers
- Company Analysis Dashboard for high growth potential opportunities
- Research Analyst Access for customization & queries
- Competitor Analysis with Interactive dashboard
- Latest News, Updates & Trend analysis

This report categorizes the l market for metalworking fluids on the basis of product type, end-use industry, and region.
Market Segmentation, by type:
- Removal fluids
- Forming fluids
- Protecting fluids
- Treating fluids
Market segmentation, by end-use industry:
- Transport equipment
- Metal fabrication
- Machinery
- Primary ferrous
- Primary non-ferrous
Market Segmentation, by region:
- Europe
- Russia
- Germany
- France
- Italy
- UK
- Spain
- North America
- US
- Canada
- Mexico
- Asia-Pacific
- China
- India
- Japan
- South America
- Brazil
- Argentina
- Chile
- Middle East & Africa
- Egypt
- South Africa
- Saudi Arabia
Critical questions which the report answers
- What are new product lubricants companies are exploring?
- Which are the key players in the market and how intense is the competition?
Available Customizations
With the given market data, MarketsandMarkets offers customizations according to the specific needs of the companies. The following customization options (not limited to) are available for the report:
Regional Analysis
- Further breakdown of a region with respect to a particular country, additional application, and/or type
Country Information
- Additional country information (up to three)
Company Information
- Detailed analysis and profiling of additional market players (up to five)
The metalworking fluids market size is expected to reach USD 9.74 billion by 2020, at a CAGR of 3.2%, between 2015 and 2020. Metalworking fluids have good viscosity to temperature behavior and are stable at high and low temperatures. Moreover, metalworking fluids also have good chemical resistance. The market is expected to be driven by the rapidly growing automotive industries.
Metalworking fluids are chemical formulations, which are used to improve the efficiency of machining tools during drilling, grinding, and other manufacturing operations. These fluids help in the reduction of heat, provide lubrication, and remove small metal chips during cutting and grinding of metal pieces. Metalworking fluids acquire a good viscosity to temperature behavior and are stable during temperature fluctuation.
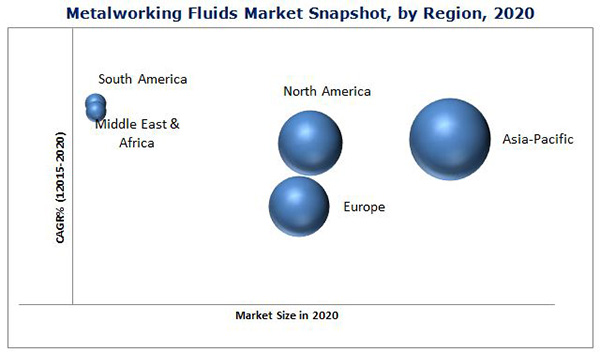
Metalworking fluids market, on the basis of product type, have been categorized into removal fluids, protecting fluids, forming fluids, and treating fluids. Removal fluid has dominance in the global market with demand arising from automotive and metal fabrication industries. Increasing automotive production in developing countries will increase the use of gear oils, thereby increasing the demand for industrial hydraulic and metalworking fluids. Asia-Pacific is the fastest-growing market for metalworking fluids due to the rising demand for efficient metalworking fluids from automotive manufacturers and OEMs.
Metalworking fluids market, on the basis of product type, have been categorized into transport equipment, metal fabrication, machinery, primary ferrous, and primary non-ferrous. Transport equipment segment is expected to be the largest and fastest growing end-use industry for metalworking fluids market. The rise in demand for high quality fabrication for automotive and OEMs is increasing. The use of lighter and high quality metals is increasing in automotive and OEMs for better efficiency. The high quality metals provide better resistance against corrosion and better functionality at extreme conditions.
Metalworking fluids market, on the basis of product type, have been categorized into North America, Asia-Pacific, Europe, Middle East & Africa, and South America. Asia-Pacific is expected to be the largest and fastest growing market for metalworking fluids. Asia-Pacific is expected to be the growth engine for the metalworking fluids market due increase in manufacturing activities. China and India are attracting lot of foreign investments in various industrial sectors. The growth of manufacturing industry will catalyze the demand for metalworking fluids in Asia-Pacific.
Transport equipment, metal fabrication, and machinery are the major end-use industries driving the growth of metalworking fluids market
Transport Equipment
Transport equipment mainly includes automotive manufacturing of heavy and light vehicles. The automotive industry is witnessing high growth at the backdrop of rising demand across the globe. The assembly line for manufacturing operations requires metalworking fluids during the machining processes. Metalworking fluid provides better finish to workpiece and results in high quality product. The use of cutting oils and coolants is increasing for removal of unwanted metal chips and heat reduction during the grinding and tilling processes.
Metal Fabrication
The metal fabrication industry includes manufacturing of boilers, radiators, general hardware, and tools. Metalworking fluids such as cutting fluid, rolling oil, forging & quenching oil, and other fluids are used in the metal fabrication industry. Metalworking fluids help to prevent metal surface deformation and cracking and also help in the removal of metal chips produced during grinding, cutting, drilling, and other metalworking processes.
Machinery
Machinery industry includes heavy machinery equipment manufacturing industries. The continuous production results in heating up of machinery. Coolants are used for cooling the machine parts. Also, corrosion prevention is required in machines and other OEMs. This is where metalworking fluids come into picture and form a protective layer to prevent seasonal and bimetallic corrosion. The use of heavy machinery in automotive and OEMs will generate demand for metalworking fluids.
Critical questions the report answers:
- Where will all these developments take the industry in the mid to long term?
- What are the upcoming applications of metalworking fluids?
To speak to our analyst for a discussion on the above findings, click Speak to Analyst
The metalworking fluids face a lot of challenges from environmental protection agencies, which are actively formulating regulations on product usage. The companies are continuously focusing on research and development (R&D) to prepare environmentally friendly formulations for metalworking fluids, so that there is no threat to the environment due to the use of metalworking fluids in various industries.
The use of metal parts in automobiles has reduced, which is a restraining factor in the growth of metalworking fluids. The near dry lubrication also known as Minimum Quantity Lubrication (MQL) is another factor restraining the growth of metalworking fluids.
The global key manufactures include ExxonMobil Corporation (U.S.), Houghton International (U.S.), Fuchs Petrolub SE (Germany), BP Plc. (U.K.), Total S.A. (France), Chevron Corporation (U.S.), Lubrizol Corporation (U.S.), and Idemitsu Kosan Co. Ltd. (Japan).
Table of Contents
1 Introduction (Page No. - 16)
1.1 Objectives of the Study
1.2 Market Definition
1.3 Market Scope
1.3.1 Years Considered for the Study
1.4 Currency and Pricing
1.5 Limitations
1.6 Stakeholders
2 Research Methodology (Page No. - 20)
2.1 Research Data
2.1.1 Secondary Data
2.1.1.1 Key Data From Secondary Sources
2.1.2 Primary Data
2.1.2.1 Key Data From Primary Sources
2.1.2.2 Key Industry Insights
2.1.2.3 Breakdown of Primary Interviews
2.2 Market Size Estimation
2.2.1 Bottom-Up Approach
2.2.2 Top-Down Approach
2.3 Market Breakdown and Data Triangulation
2.4 Research Assumptions
2.4.1 Assumptions
3 Executive Summary (Page No. - 28)
4 Premium Insights (Page No. - 33)
4.1 Significant Opportunities for Metalworking Fluids Market in the Long Term
4.2 Metalworking Fluids Market to Grow at A Robust Growth Rate
4.3 Metalworking Fluids Market Share, By Region and Product Type
4.4 Metalworking Fluids Market Attractiveness, 2015-2020
4.5 Metalworking Fluids Market, By Region
5 Market Overview (Page No. - 38)
5.1 Introduction
5.2 Market Segmentation
5.2.1 By Product Type
5.2.2 By Application
5.2.3 By Region
5.3 Market Dynamics
5.3.1 Drivers
5.3.1.1 Massive Industrial Growth in Asia-Pacific & Africa
5.3.1.2 Growing Automotive Industry in South America
5.3.2 Restraints
5.3.2.1 Reduction in Metal Parts By Automakers and Oems
5.3.2.2 Minimum Quantity Lubrication (MQL) and Near Dry Machining
5.3.3 Opportunities
5.3.3.1 Multi-Phase Metalworking Fluids
5.3.4 Challenges
5.3.4.1 Environmental Regulations
6 Industry Trends (Page No. - 44)
6.1 Introduction
6.2 Value-Chain Analysis
6.2.1 Raw Material
6.2.2 Blending
6.2.3 Distribution
6.2.4 End User
6.3 Porter�s Five Forces Analysis
6.3.1 Threat of New Entrants
6.3.2 Threat of Substitutes
6.3.3 Bargaining Power of Suppliers
6.3.4 Bargaining Power of Buyers
6.3.5 Intensity of Competitive Rivalry
7 Metalworking Fluids Market, By Product Type (Page No. - 48)
7.1 Introduction
7.2 Removal Fluids
7.3 Protecting Fluids
7.4 Forming Fluids
7.5 Treating Fluids
8 Metalworking Fluids Market, By End-Use Industry (Page No. - 55)
8.1 Introduction
8.2 Transport Equipment
8.3 Primary Ferrous Products
8.4 Primary Non-Ferrous Products
8.5 Machinery
8.6 Metal Fabrication
8.7 Others
9 Metalworking Fluids Market, By Region (Page No. - 65)
9.1 Introduction
9.2 North America
9.2.1 North America Market Analysis, By Type
9.2.2 North America Market Analysis, By End-Use Industry
9.2.3 North America Market Analysis, By Country
9.2.3.1 U.S.
9.2.3.2 Canada
9.2.3.3 Mexico
9.3 Asia-Pacific
9.3.1 Asia-Pacific Market Analysis, By Product Type
9.3.2 Asia-Pacific Market Analysis, By End-Use Industry
9.3.3 Asia-Pacific Market Analysis, By Country
9.3.3.1 China
9.3.3.2 India
9.3.3.3 Japan
9.3.3.4 Rest of Asia-Pacific
9.4 Europe
9.4.1 Europe Market Analysis, By Product Type
9.4.2 Europe Market Analysis, By End-Use Industry
9.4.3 Europe Market Analysis, By Country
9.4.3.1 Russia
9.4.3.2 Germany
9.4.3.3 France
9.4.3.4 Italy
9.4.3.5 U.K.
9.4.3.6 Spain
9.4.3.7 Rest of Europe
9.5 South America
9.5.1 South America Market Analysis, By Product Type
9.5.2 South America Market Analysis, By End-Use Industry
9.5.3 South America Market Analysis, By Country
9.5.3.1 Brazil
9.5.3.2 Argentina
9.5.3.3 Chile
9.5.3.4 Rest of South America
9.6 Middle East & Africa
9.6.1 Middle East & Africa Market Analysis, By Product Type
9.6.2 Middle East & Africa Market Analysis, By End-Use Industry
9.6.3 Middle East & Africa Market Analysis, By Country
9.6.3.1 Egypt
9.6.3.2 South Africa
9.6.3.3 Saudi Arabia
9.6.3.4 Rest of Middle East & Africa
10 Competitive Landscape (Page No. - 109)
10.1 Overview
10.2 Expansion: the Most Popular Growth Strategy
10.3 Maximum Development in North America
10.4 Breakup of Developments Between 2011 and 2015
10.5 Competitive Situation and Trends
10.5.1 Expansions
10.5.2 Acquisitions
10.5.3 New Product Launches
10.5.4 Other Developments
11 Company Profiles (Page No. - 117)
(Overview, Financial*, Products & Services, Strategy, and Developments)
11.1 Introduction
11.2 Exxonmobil Corp.
11.3 Fuchs Petolub AG
11.4 Total S.A.
11.5 BP PLC
11.6 Chevron Corp.
11.7 Houghton International Inc.
11.8 Idemitsu Kosan Co. Ltd
11.9 Sinopec Ltd.
11.10 Lukoil Oil Co.
11.11 Lubrizol Corp.
*Details Might Not Be Captured in Case of Unlisted Companies
12 Appendix (Page No. - 142)
12.1 Insights From Industry Experts
12.2 Discussion Guide
12.3 Introducing RT: Real-Time Market Intelligence
12.4 Available Customizations
12.5 Related Reports
List of Tables (116 Tables)
Table 1 Metalworking Fluids Market, By Type
Table 2 Metalworking Fluids Market, By Application
Table 3 Metalworking Fluids Market Size, By Type, 2013�2020 (USD Million)
Table 4 Metalworking Fluids Market Size, By Type, 2013�2020 (Kiloton)
Table 5 Removal Fluids Market Size, By Region, 2013�2020 (USD Million)
Table 6 Removal Fluids Market Size, By Region, 2013�2020 (Kiloton)
Table 7 Protecting Fluids Market Size, By Region, 2013 - 2020 (USD Million)
Table 8 Protecting Fluids Market Size, By Region, 2013�2020 (Kiloton)
Table 9 Forming Fluids Market Size, By Region, 2013�2020 (USD Million)
Table 10 Forming Fluids Market Size, By Region, 2013�2020 (Kiloton)
Table 11 Treating Fluids Market Size, By Region, 2013�2020 (USD Million)
Table 12 Treating Fluids Market Size, By Region, 2013�2020 (Kiloton)
Table 13 Metalworking Fluids Market Size, By End-Use Industry,2013�2020 (USD Million)
Table 14 Market Size, By End-Use Industry,2013�2020 (Kiloton)
Table 15 Metalworking Fluids Market Size for Transport Equipment, By Region, 2013�2020 (USD Million)
Table 16 Market Size for Transport Equipment, By Region, 2013�2020 (Kiloton)
Table 17 Metalworking Fluids Market Size for Primary Ferrous, By Region, 2013�2020 (USD Million)
Table 18 Market Size for Primary Ferrous, By Region, 2013�2020 (Kiloton)
Table 19 Metalworking Fluids Market Size for Primary Non-Ferrous, By Region, 2013�2020 (USD Million)
Table 20 Market Size for Primary Non-Ferrous, By Region, 2013�2020 (Kiloton)
Table 21 Metalworking Fluids Market Size for Machinery, By Region,2013�2020 (USD Million)
Table 22 Market Size for Machinery, By Region,2013�2020 (Kiloton)
Table 23 Metalworking Fluids Market Size for Metal Fabrication, By Region, 2013�2020 (USD Million)
Table 24 Market Size for Metal Fabrication, By Region, 2013�2020 (Kiloton)
Table 25 Metalworking Fluids Market Size for Other End-Use Industries,By Region, 2013�2020 (USD Million)
Table 26 Market Size for Other End-Use Industries,By Region, 2013�2020 (Kiloton)
Table 27 Metalworking Fluids Market Size, By Region, 2013�2020 (USD Million)
Table 28 Market Size, By Region, 2013�2020 (Kiloton)
Table 29 North America: Metalworking Fluids Market Size, By Product Type, 2013-2020 (USD Million)
Table 30 North America: Market Size, By Product Type, 2013-2020 (Kiloton)
Table 31 North America: Metalworking Fluids Market Size, By End-Use Industry, 2013-2020 (USD Million)
Table 32 North America: Market Size, By End-Use Industry, 2013-2020 (Kiloton)
Table 33 North America: Metalworking Fluids Market Size, By Country,2013-2020 (USD Million)
Table 34 North America: Market Size, By Country,2013-2020 (Kiloton)
Table 35 U.S.: Metalworking Fluids Market Size, By Product Type,2013-2020 (USD Million)
Table 36 U.S.: Market Size, By Product Type,2013-2020 (Kiloton)
Table 37 Canada: Metalworking Fluids Market Size, By Product Type,2013-2020 (USD Million)
Table 38 Canada: Market Size, By Product Type,2013-2020 (Kiloton)
Table 39 Mexico: Metalworking Fluids Market Size, By Product Type,2013-2020 (USD Million)
Table 40 Mexico: Market Size, By Product Type,2013-2020 (Kiloton)
Table 41 Asia-Pacific: Metalworking Fluids Market Size, By Product Type,2013-2020 (USD Million)
Table 42 Asia-Pacific: Market Size, By Product Type,2013-2020 (Kiloton)
Table 43 Asia-Pacific: Metalworking Fluids Market Size, By End-Use Industry, 2013-2020 (USD Million)
Table 44 Asia-Pacific: Market Size, By End-Use Industry, 2013-2020 (Kiloton)
Table 45 Asia-Pacific: Metalworking Fluids Market Size, By Country,2013-2020 (USD Million)
Table 46 Asia-Pacific: Market Size, By Country,2013-2020 (Kiloton)
Table 47 China: Metalworking Fluids Market Size, By Product Type,2013-2020 (USD Million)
Table 48 China: Market Size, By Product Type,2013-2020 (Kiloton)
Table 49 India: Metalworking Fluids Market Size, By Product Type,2013-2020 (USD Million)
Table 50 India: Market Size, By Product Type,2013-2020 (Kiloton)
Table 51 Japan: Metalworking Fluids Market Size, By Product Type,2013-2020 (USD Million)
Table 52 Japan: Market Size, By Product Type,2013-2020 (Kiloton)
Table 53 Rest of Asia-Pacific: Metalworking Fluids Market Size, By Product Type, 2013-2020 (USD Million)
Table 54 Rest of Asia-Pacific: Market Size, By Product Type, 2013-2020 (Kiloton)
Table 55 Europe: Metalworking Fluids Market Size, By Product Type,2013-2020 (USD Million)
Table 56 Europe: Metalworking Fluids Market Size, By Product Type,2013-2020 (Kiloton)
Table 57 Europe: Metalworking Fluids Market Size, By End-Use Industry,2013-2020 (USD Million)
Table 58 Europe: Metalworking Fluids Market Size, By End-Use Industry,2013-2020 (Kiloton)
Table 59 Europe: Metalworking Fluids Market Size, By Country,2013-2020 (USD Million)
Table 60 Europe: Metalworking Fluids Market Size, By Country,2013-2020 (Kiloton)
Table 61 Russia: Metalworking Fluids Market Size, By Product Type,2013-2020 (USD Million)
Table 62 Russia: Market Size, By Product Type,2013-2020 (Kiloton)
Table 63 Germany: Market Size, By Product Type,2013-2020 (USD Million)
Table 64 Germany: Market Size, By Product Type,2013-2020 (Kiloton)
Table 65 France: Market Size, By Product Type,2013-2020 (USD Million)
Table 66 France: Market Size, By Product Type,2013-2020 (Kiloton)
Table 67 Italy: Metalworking Fluids Market Size, By Product Type,2013-2020 (USD Million)
Table 68 Italy: Metalworking Fluids Market Size, By Product Type,2013-2020 (Kiloton)
Table 69 U.K.: Metalworking Fluids Market Size, By Product Type,2013-2020 (USD Million)
Table 70 U.K.: Metalworking Fluids Market Size, By Product Type,2013-2020 (Kiloton)
Table 71 Spain: Market Size, By Product Type,2013-2020 (USD Million)
Table 72 Spain: Market Size, By Product Type,2013-2020 (Kiloton)
Table 73 Rest of Europe: Market Size, By Product Type, 2013-2020 (USD Million)
Table 74 Rest of Europe: Market Size, By Product Type, 2013-2020 (Kiloton)
Table 75 South America: Metalworking Fluids Market Size, By Product Type, 2013-2020 (USD Million)
Table 76 South America: Metalworking Fluids Market Size, By Product Type, 2013-2020 (Kiloton)
Table 77 South America: Metalworking Fluids Market Size, By End-Use Industry, 2013-2020 (USD Million)
Table 78 South America: Metalworking Fluids Market Size, End-Use Industry, 2013-2020 (Kiloton)
Table 79 South America: Metalworking Fluids Market Size, By Country,2013-2020 (USD Million)
Table 80 South America: Metalworking Fluids Market Size, By Country,2013-2020 (Kiloton)
Table 81 Brazil: Market Size, By Product Type,2013-2020 (USD Million)
Table 82 Brazil: Market Size, By Product Type,2013-2020 (Kiloton)
Table 83 Argentina: Market Size, By Product Type,2013-2020 (USD Million)
Table 84 Argentina: Market Size, By Product Type,2013-2020 (Kiloton)
Table 85 Chile: Market Size, By Product Type,2013-2020 (USD Million)
Table 86 Chile: Market Size, By Product Type,2013-2020 (Kiloton)
Table 87 Rest of South America: Market Size, By Product Type, 2013-2020 (USD Million)
Table 88 Rest of South America: Market Size, By Product Type, 2013-2020 (Kiloton)
Table 89 Middle East & Africa: Metalworking Fluids Market Size, By Product Type, 2013-2020 (USD Million)
Table 90 Middle East & Africa: Metalworking Fluids Market Size, By Product Type, 2013-2020 (Kiloton)
Table 91 Middle East & Africa: Metalworking Fluids Market Size, By End-Use Industry, 2013-2020 (USD Million)
Table 92 Middle East & Africa: Metalworking Fluids Market Size, By End-Use Industry, 2013-2020 (Kiloton)
Table 93 Middle East & Africa: Metalworking Fluids Market Size, By Country, 2013-2020 (USD Million)
Table 94 Middle East & Africa: Market Size, By Country, 2013-2020 (Kiloton)
Table 95 Egypt: Metalworking Fluids Market Size, By Product Type,2013-2020 (USD Million)
Table 96 Egypt: Market Size, By Product Type,2013-2020 (Kiloton)
Table 97 South Africa: Metalworking Fluids Market Size, By Product Type,2013-2020 (USD Million)
Table 98 South Africa: Market Size, By Product Type,2013-2020 (Kiloton)
Table 99 Saudi Arabia: Metalworking Fluids Market Size, By Product Type,2013-2020 (USD Million)
Table 100 Saudi Arabia: Market Size, By Product Type,2013-2020 (Kiloton)
Table 101 Rest of Middle East & Africa: Metalworking Fluids Market Size, By Product Type, 2013-2020 (USD Million)
Table 102 Rest of Middle East & Africa: Market Size, By Product Type, 2013-2020 (Kiloton)
Table 103 Expansions, 2011�2015
Table 104 Acquisitions, 2011�2015
Table 105 New Product Launches, 2011�2015
Table 106 Other Developments, 2011�2015
Table 107 Exxonmobil Corp.: Product Categories and Brands
Table 108 Fuchs Petrolub SE: Product Categories and Their Brands
Table 109 Total S.A.: Product Categories and Their Brands
Table 110 BP PLC.: Product Categories and Their Brands
Table 111 Chevron Corp.: Products and Their Descriptions
Table 112 Houghton International Inc.: Product Categories and Their Descriptions
Table 113 Idemitsu Kosan Co. Ltd: Products and Their Brands
Table 114 Sinopec Ltd.: Products and Their Descriptions
Table 115 Lukoil Oil Co.: Product Brands and Their Descriptions
Table 116 Lubrizol Corp.: Product Categories and Their Descriptions
List of Figures (47 Figures)
Figure 1 Metalworking Fluids: Market Segmentation
Figure 2 Metalworking Fluids Market, Research Design
Figure 3 Breakdown of Primary Interviews, By Company Type, Designation, and Region
Figure 4 Market Size Estimation: Bottom-Up Approach
Figure 5 Market Size Estimation: Top-Down Approach
Figure 6 Market Breakdown and Data Triangulation
Figure 7 Metalworking Fluids Market, By Product Type, Snapshot (2015 Vs.2020)
Figure 8 Removal Fluids to Dominate European Market
Figure 9 Asia-Pacific and South America to Register Highest CAGR Between 2015 and 2020
Figure 10 Transport Equipment to Dominate the Demand for Metalworking Fluids Between 2015 and 2020
Figure 11 Long-Term Sustainability of the Metalworking Fluids Market Between 2015 and 2020
Figure 12 Metalworking Fluids Market: Robust Growth Rate Expected Between 2015 and 2020
Figure 13 Metalworking Fluids Market: Removal Fluids Was the Largest Product Type in 2014
Figure 14 Rapid Industrialization in Asia-Pacific is Expected to Boost the Demand for Metalworking Fluids Between 2015 and 2020
Figure 15 Asia-Pacific Expected to Dominate Metalworking Fluids Market Between 2015 and 2020
Figure 16 Metalworking Fluids Market, By Region
Figure 17 Drivers, Restraints, Opportunities, and Challenges of the Metalworking Fluids Market
Figure 18 Value Chain of Metalworking Fluids Market
Figure 19 Porter�s Five Forces Analysis
Figure 20 Removal Fluids to Dominate the Metalworking Fluids Market Between 2015 and 2020
Figure 21 Asia-Pacific to Boost the Growth of Forming Fluids Between 2015 and 2020
Figure 22 Transport Equipment is Expected to Dominate the Metalworking Fluids Market, 2015�2020
Figure 23 Increasing Demand From Construction Industry to Augment Growth of Metalworking Fluids for Primary Ferrous, 2015�2020
Figure 24 Asia-Pacific is Expected to Dominate Metalworking Fluids Market for Machinery, 2015�2020
Figure 25 Regional Snapshot (2015-2020): Asia-Pacific Countries to Drive the Global Market
Figure 26 Asia-Pacific to Drive Growth of Removal and Protecting Fluids Segments
Figure 27 North American Market Snapshot: U.S. is Home to Many Key Players in the Metalworking Fluids Market
Figure 28 Asia-Pacific Market Snapshot: China to Lead Market Growth Between 2015 and 2020
Figure 29 Europe Metalworking Fluids Market Snapshot: Russia Dominates Metalworking Fluids Market in Europe Between 2015 & 2020
Figure 30 Companies Primarily Adopted Organic Growth Strategies Between 2011 and 2015
Figure 31 Key Growth Strategies in Metalworking Fluids Market, 2011�2015
Figure 32 New Product Launches in North America Made It the Most Active Region
Figure 33 Metalworking Fluids Market in Terms of Developmental Activities, 2011�2015
Figure 34 Geographical Revenue Mix of Top Five Market Player
Figure 35 Exxonmobil Corp.: Company Snapshot
Figure 36 Exxonmobil Corp.: SWOT Analysis
Figure 37 Fuchs Petrolub SE: Company Snapshot
Figure 38 Fuchs Petrolob SE: SWOT Analysis
Figure 39 Total S.A.: Company Snapshot
Figure 40 Total S.A.: SWOT Analysis
Figure 41 BP PLC.: Company Snapshot
Figure 42 BP PLC.: SWOT Analysis
Figure 43 Chevron Corp.: Company Snapshot
Figure 44 Chevron Corp.: SWOT Analysis
Figure 45 Idemitsu Kosan Co. Ltd.: Company Snapshot
Figure 46 Sinopec Ltd.: Company Snapshot
Figure 47 Lukoil Oil Co.: Business Overview


Growth opportunities and latent adjacency in Metalworking Fluids Market