Heat-treated Steel Plates Market by Steel Type (Carbon, Alloy, and Stainless), Treatment (Quenching & Tempering, Normalizing, and Stress Relieving), Application (Construction, Energy, Industrial Machinery), and Region - Global Forecast to 2022


Heat-treated Steel Plates Market Size And Forecast
[194 Pages Report] The market for heat-treated steel plates was valued at USD 99.59 Billion in 2016, and is projected to reach USD 121.77 Billion by 2022, at a CAGR of 3.53% from 2017.
The report aims at estimating the market size and future growth potential of the heat-treated steel plates market across different segments such as steel type, treatment, application, and region. The other objectives include providing detailed information regarding the main factors influencing the growth of the market (drivers, restraints, opportunities, and industry-specific challenges). It also aims to study the individual growth trends, future prospects, and contribution of various segments to the total market. The study also analyzes opportunities in the market for stakeholders and details of the competitive landscape for the market leaders. The study strategically profiles key players and comprehensively analyzes their core competencies.
The research methodology used to estimate and forecast the heat-treated steel plates market begins with capturing data on key vendor revenues through secondary research and associations such as World Steel Association, The European Steel Association (EUROFER), EUROMETAL, and British Stainless Steel Association. The vendor offerings are also taken into consideration to determine the market segmentation. The bottom-up procedure was employed to arrive at the overall size of the global heat-treated steel plates market from the revenues of the key players. After arriving at the overall market size, the total market was split into several segments and sub-segments, which were then verified through primary research by conducting extensive interviews with key people such as CEOs, VPs, directors, and executives. These data triangulation and market breakdown procedures were employed to complete the overall market engineering process and arrive at the exact statistics for all segments and subsegments. The breakdown of profiles of the primary research sources is depicted in the figure below:
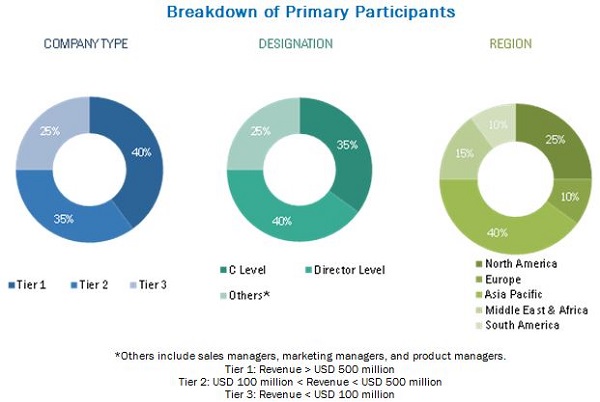
To know about the assumptions considered for the study, download the pdf brochure
The market ecosystem includes various stakeholders involved in the supply chain of the heat-treated steel plates industry starting from raw materials suppliers, research & development, and manufacturing. Post this, the marketing and sales of the products take place, which is only possible if an efficient distribution channel is developed. Finally, the end products are made available to the consumers. The global market for the heat-treated steel plates market is dominated by players such as ArcelorMittal (Luxembourg), Thyssenkrupp AG (Germany), POSCO (South Korea), TATA Steel (India), Baosteel (China), Outokumpu (Finland), JFE Holdings (Japan), Nippon Steel & Sumitomo Metal Corporation (Japan), Novolipetsk Steel (Russia), and Essar Steel (India).
Target audience
- Heat-treated steel plate manufacturers
- Raw material producers and suppliers
- Heat-treated steel plate distributors and traders
- End-use sectors
- Governments and R&D institutions
- Market research and consulting firms
- Associations and industry bodies
Get online access to the report on the World's First Market Intelligence Cloud
Request Sample Scope of the Report

The research report segments the heat-treated steel plates market into the following submarkets:
By Steel Type:
- Carbon steel
- Alloy steel
- Stainless steel
By Treatment:
- Quenching & tempering
- Normalizing
- Spheroidizing
- Stress relieving
By Application:
- Construction
- Industrial machinery
- Automotive & defense vehicles
- Shipbuilding
- Energy & power
By Region:
- North America
- Europe
- Asia Pacific
- Middle East & Africa
- South America
Available Customizations
With the given market data, MarketsandMarkets offers customizations according to client-specific needs. The following customization options are available for the report:
Product Analysis
- Product Matrix, which gives a detailed comparison of product portfolio of each company
Geographic Analysis
- Further analysis of the heat-treated steel plates market for additional countries
Company Information
- Detailed analysis and profiling of additional market players
MarketsandMarkets projects that the heat-treated steel plates market will grow from USD 102.36 Billion in 2017 to USD 121.77 Billion by 2022, at an estimated CAGR of 3.53%. Rise in building & construction activities, large-scale investments in infrastructure & industrial sectors, and rapid urbanization in developing economies are boosting the growth of the heat-treated steel plates market. The construction segment is projected to account for the largest market share and dominate the market from 2017 to 2022. The growth in adoption and development of industrial machinery plays a key role in changing the market; this segment is projected to grow at the second-highest rate during the forecast period.
The segmentation for this report is based on steel type, treatment, application, and region. The energy & power segment is projected to be the fastest-growing segment in the heat-treated steel plates market during the forecast period. There are various heat-treated steel plates used in major boilers, pressure vessels, storage tanks, and other structural parts in the energy & power sector. The power sector requires these plates to withstand adverse conditions, such as high pressure and high temperature.
Heat-treated steel plates are used in construction, energy & power, industrial machinery, automotive & defense vehicles, and shipbuilding. The global market, in terms of application, was dominated by the construction industry in 2016. The rise in disposable incomes of the urban population is leading to the construction of new houses in urban regions, thereby giving rise to an increased demand for heat-treated steel plates. Growth in construction expenditures in the non-residential sector will continue to support the demand for heat-treated steel plates.
The carbon steel type segment dominated the market in 2016, and is projected to be the fastest-growing application in the next five years, as a result of its economical price, easy availability, and wide application areas in manufacturing and construction industries.
Asia Pacific dominated the market for heat-treated steel plates in 2016. China contributes a major market share in the Asia Pacific market. Easy availability of raw materials and cheap labor, coupled with significant domestic demand, makes this market very attractive for industry participants. The growth in middle-class population and the rise in the standards of living of the population are expected to drive the demand for heat-treated steel plates due to the rise in demand for steel across various industries. The market in this region is growing rapidly due to the presence of numerous leading players.
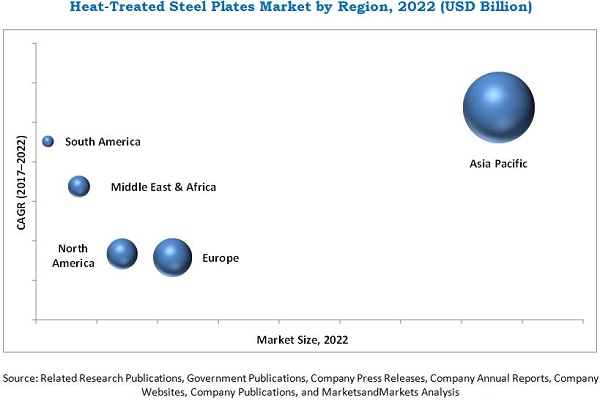
In 2017, Asia Pacific is estimated as the largest consumer of heat-treated steel plates, with China, India, Japan, South Korea, and Australia being the major markets. The Asia Pacific heat-treated steel plates market is projected to register the highest CAGR during the forecast period. The growth of the building & construction industry and economic development in the region have led to the increase in demand for heat-treated steel plates.
Volatile raw material prices and excess supply of steel in some regions pose a challenge to the growth of the heat-treated steel plates market. The global heat-treated steel plates market is dominated by players such as ArcelorMittal (Luxembourg), Thyssenkrupp AG (Germany), POSCO (South Korea), TATA Steel (India), Baosteel (China), Outokumpu (Finland), JFE Holdings (Japan), Nippon Steel & Sumitomo Metal Corporation (Japan), Novolipetsk Steel (Russia), and Essar Steel (India). These players majorly adopted strategies, such as expansions and agreements to meet the demand.
To speak to our analyst for a discussion on the above findings, click Speak to Analyst
Table of Contents
1 Introduction (Page No. - 18)
1.1 Objectives of the Study
1.2 Market Definition
1.3 Study Scope
1.3.1 Regional Scope
1.3.2 Years Considered for the Study
1.4 Currency Considered
1.5 Unit Considered
1.6 Stakeholders
2 Research Methodology (Page No. - 22)
2.1 Research Data
2.1.1 Secondary Data
2.1.1.1 Key Data From Secondary Sources
2.1.3 Primary Data
2.1.3.1 Key Data From Primary Sources
2.1.3.2 Breakdown of Primaries
2.2 Market Size Estimation
2.3 Data Triangulation
2.4 Research Assumptions & Limitations
3 Executive Summary (Page No. - 30)
4 Premium Insights (Page No. - 34)
4.1 Emerging Economies to Register High Growth in Terms of Demand for Heat-Treated Steel Plates
4.2 Heat-Treated Steel Plates Market, By Steel Type
4.3 Heat-Treated Steel Plates Market, By Application
4.4 Heat-Treated Steel Plates Market, By Treatment
4.5 Asia Pacific: Heat-Treated Steel Plates Market, By Application & Country
4.6 Heat-Treated Steel Plates Market: Country Snapshot
5 Market Overview (Page No. - 39)
5.1 Introduction
5.2 Market Dynamics
5.2.1 Drivers
5.2.1.1 Rise in Demand From End-Use Industries
5.2.1.2 Ability to Reduce the Weight of the Structures
5.2.1.3 Growth in Demand From the Asia Pacific Region
5.2.1.4 No Substitutes for Heat-Treated Steel Plates
5.2.2 Restraints
5.2.2.1 Matured Market
5.2.2.2 Impact of Economic Downturn
5.2.3 Opportunities
5.2.3.1 Imposition of Anti-Dumping Duties on Import
5.2.4 Challenges
5.2.4.1 Volatile Raw Material Prices
6 Industry Trends (Page No. - 44)
6.1 Introduction
6.2 Supply Chain Analysis
6.3 Porter’s Five Forces Analysis
6.3.1 Threat of New Entrants
6.3.2 Threat of Substitutes
6.3.3 Bargaining Power of Suppliers
6.3.4 Bargaining Power of Buyers
6.3.5 Intensity of Competitive Rivalry
6.4 Macroeconomic Overview
6.4.1 GDP & Contribution of the Construction Industry, By Country
6.4.2 Global Automotive Industry Outlook
7 Heat-Treated Steel Plates Market, By Steel Type (Page No. - 53)
7.1 Introduction
7.2 Carbon Steel
7.3 Alloy Steel
7.4 Stainless Steel
8 Heat-Treated Steel Plates Market, By Treatment (Page No. - 57)
8.1 Introduction
8.2 Quenching & Tempering
8.3 Normalizing
8.4 Spheroidizing
8.5 Stress Relieving
8.6 Others
9 Heat-Treated Steel Plates Market, By Application (Page No. - 62)
9.1 Introduction
9.2 Construction
9.3 Energy & Power
9.4 Industrial Machinery
9.5 Automotive & Defense Vehicles
9.6 Shipbuilding
9.7 Others
10 Heat-Treated Steel Plates Market, By Region (Page No. - 67)
10.1 Introduction
10.2 North America
10.2.1 US
10.2.2 Canada
10.2.3 Mexico
10.2.4 Rest of North America
10.3 Europe
10.3.1 Germany
10.3.2 Russia
10.3.3 Italy
10.3.4 France
10.3.5 UK
10.3.6 Spain
10.3.7 Rest of Europe
10.4 Asia Pacific
10.4.1 China
10.4.2 India
10.4.3 Japan
10.4.4 South Korea
10.4.5 Australia
10.4.6 Rest of Asia Pacific
10.5 Middle East & Africa
10.5.1 UAE
10.5.2 Turkey
10.5.3 Iran
10.5.4 Saudi Arabia
10.5.5 South Africa
10.5.6 Rest of the Middle East & Africa
10.6 South America
10.6.1 Brazil
10.6.2 Argentina
10.6.3 Rest of South America
11 Competitive Landscape (Page No. - 136)
11.1 Overview
11.2 Market Ranking
11.3 Competitive Scenario
11.3.1 Expansions
11.3.2 Agreements
11.3.3 Acquisitions
11.3.4 Investments
11.3.5 Divestments
11.3.6 New Product Launches
11.3.7 Mergers
11.3.8 Joint Ventures
11.3.9 Partnerships
12 Company Profiles (Page No. - 147)
(Business Overview, Products Offered, Recent Developments, SWOT Analysis & MnM View)*
12.1 Arcelormittal
12.2 Posco
12.3 Nippon Steel & Sumitomo Metal Corporation
12.4 JFE Holdings
12.5 Baosteel
12.6 Thyssenkrupp AG
12.7 Tata Steel
12.8 Outokumpu
12.9 Novolipetsk Steel
12.10 Vitkovice Steel
12.11 Essar Steel
*Details on Business Overview, Products Offered, Recent Developments, SWOT Analysis & MnM View Might Not Be Captured in Case of Unlisted Companies.
12.12 Other Players
12.12.1 Hyundai Steel
12.12.2 Voestalpine
12.12.3 Ansteel
12.12.4 Steel Authority of India Limited
12.12.5 Jiangsu Shagang Group
12.12.6 Jindal Steel & Power
12.12.7 Evraz North America
12.12.8 Simplex Metal & Alloys
12.12.9 Stanch Stainless Steel
12.12.10 Metinvest Holding
12.12.11 Allergheny Technologies
12.12.12 JSW Steel
12.12.13 Triton Alloys
12.12.14 Bisalloy Jigang (Shandong) Steel Plate
13 Appendix (Page No. - 187)
13.1 Discussion Guide
13.2 Knowledge Store: Marketsandmarkets’ Subscription Portal
13.3 Introducing RT: Real-Time Market Intelligence
13.4 Available Customizations
13.5 Related Reports
13.6 Author Details
List of Tables (163 Tables)
Table 1 North America: GDP, By Country, 2015–2022 (USD Billion)
Table 2 North America: Contribution of the Construction Industry, By Country, 2014–2021 (USD Billion)
Table 3 Europe: GDP, By Country, 2015–2022 (USD Billion)
Table 4 Europe: Contribution of the Construction Industry, By Country, 2014–2021 (USD Billion)
Table 5 Asia Pacific: GDP, By Country, 2015–2022 (USD Billion)
Table 6 Asia Pacific: Contribution of the Construction Industry, By Country, 2014–2021 (USD Billion)
Table 7 Middle East & Africa: GDP, By Country, 2015–2022 (USD Billion)
Table 8 Middle East & Africa: Contribution of the Construction Industry, By Country, 2014–2021 (USD Billion)
Table 9 South America: GDP, By Country, 2015–2022 (USD Billion)
Table 10 South America: Contribution of the Construction Industry, By Country, 2014–2021 (USD Billion)
Table 11 Automotive Production, By Country, 2016
Table 12 Heat-Treated Steel Plates Market Size, By Steel Type, 2015–2022 (USD Million)
Table 13 Market Size, By Steel Type, 2015–2022 (Kiloton)
Table 14 Heat-Treated Steel Plates Market Size, By Treatment, 2015–2022 (USD Million)
Table 15 Market Size, By Treatment, 2015–2022 (KT)
Table 16 Heat-Treated Steel Plates Market Size, By Application, 2015–2022 (USD Million)
Table 17 Market Size, By Application, 2015–2022 (KT)
Table 18 Heat-Treated Steel Plates Market Size, By Region, 2015–2022 (USD Million)
Table 19 Market Size, By Region, 2015–2022 (KT)
Table 20 North America: Heat-Treated Steel Plates Market Size, By Country, 2015–2022 (USD Million)
Table 21 North America: Market Size, By Country, 2015–2022 (KT)
Table 22 North America: Market Size, By Steel Type, 2015–2022 (USD Million)
Table 23 North America: Market Size, By Steel Type, 2015–2022 (KT)
Table 24 North America: Market Size, By Application, 2015–2022 (USD Million)
Table 25 North America: Market Size, By Application, 2015–2022 (KT)
Table 26 US: Heat-Treated Steel Plates Market Size, By Steel Type, 2015–2022 (USD Million)
Table 27 US: Market Size, By Steel Type, 2015–2022 (KT)
Table 28 US: Market Size, By Application, 2015–2022 (USD Million)
Table 29 US: Market Size, By Application, 2015–2022 (KT)
Table 30 Canada: Heat-Treated Steel Plates Market Size, By Steel Type, 2015–2022 (USD Million)
Table 31 Canada: Market Size, By Steel Type, 2015–2022 (KT)
Table 32 Canada: Market Size, By Application, 2015–2022 (USD Million)
Table 33 Canada: Market Size, By Application, 2015–2022 (KT)
Table 34 Mexico: Market Size, By Steel Type, 2015–2022 (USD Million)
Table 35 Mexico: Market Size, By Steel Type, 2015–2022 (KT)
Table 36 Mexico: Market Size, By Application, 2015–2022 (USD Million)
Table 37 Mexico: Market Size, By Application, 2015–2022 (KT)
Table 38 Rest of North America: Heat-Treated Steel Plates Market Size, By Steel Type, 2015–2022 (USD Million)
Table 39 Rest of North America: Market Size, By Steel Type, 2015–2022 (KT)
Table 40 Rest of North America: Market Size, By Application, 2015–2022 (USD Million)
Table 41 Rest of North America: Market Size, By Application, 2015–2022 (KT)
Table 42 Europe: Heat-Treated Steel Plates Market Size, By Country, 2015–2022 (USD Million)
Table 43 Europe: Market Size, By Country, 2015–2022 (KT)
Table 44 Europe: Market Size, By Steel Type, 2015–2022 (USD Million)
Table 45 Europe: Market Size, By Steel Type, 2015–2022 (KT)
Table 46 Europe: Market Size, By Application, 2015–2022 (USD Million)
Table 47 Europe: Market Size, By Application, 2015–2022 (KT)
Table 48 Germany: Heat-Treated Steel Plates Market Size, By Steel Type, 2015–2022 (USD Million)
Table 49 Germany: Market Size, By Steel Type, 2015–2022 (KT)
Table 50 Germany: Market Size, By Application, 2015–2022 (USD Million)
Table 51 Germany: Market Size, By Application, 2015–2022 (KT)
Table 52 Russia: Heat-Treated Steel Plates Market Size, By Steel Type, 2015–2022 (USD Million)
Table 53 Russia: Market Size, By Steel Type, 2015–2022 (KT)
Table 54 Russia: Market Size, By Application, 2015–2022 (USD Million)
Table 55 Russia: Market Size, By Application, 2015–2022 (KT)
Table 56 Italy: Heat-Treated Steel Plates Market Size, By Steel Type, 2015–2022 (USD Million)
Table 57 Italy: Market Size, By Steel Type, 2015–2022 (KT)
Table 58 Italy: Market Size, By Application, 2015–2022 (USD Million)
Table 59 Italy: Market Size, By Application, 2015–2022 (KT)
Table 60 France: Heat-Treated Steel Plates Market Size, By Steel Type, 2015–2022 (USD Million)
Table 61 France: Market Size, By Steel Type, 2015–2022 (KT)
Table 62 France: Market Size, By Application, 2015–2022 (USD Million)
Table 63 France: Market Size, By Application, 2015–2022 (KT)
Table 64 UK: Heat-Treated Steel Plates Market Size, By Steel Type, 2015–2022 (USD Million)
Table 65 UK: Market Size, By Steel Type, 2015–2022 (KT)
Table 66 UK: Market Size, By Application, 2015–2022 (USD Million)
Table 67 UK: Market Size, By Application, 2015–2022 (KT)
Table 68 Spain: Heat-Treated Steel Plates Market Size, By Steel Type, 2015–2022 (USD Million)
Table 69 Spain: Market Size, By Steel Type, 2015–2022 (KT)
Table 70 Spain: Market Size, By Application, 2015–2022 (USD Million)
Table 71 Spain: Market Size, By Application, 2015–2022 (KT)
Table 72 Rest of Europe: Heat-Treated Steel Plates Market Size, By Steel Type, 2015–2022 (USD Million)
Table 73 Rest of Europe: Market Size, By Steel Type, 2015–2022 (KT)
Table 74 Rest of Europe: Market Size, By Application, 2015–2022 (USD Million)
Table 75 Rest of Europe: Market Size, By Application, 2015–2022 (KT)
Table 76 Asia Pacific: Heat-Treated Steel Plates Market Size, By Country, 2015–2022 (USD Million)
Table 77 Asia Pacific: Market Size, By Country, 2015–2022 (KT)
Table 78 Asia Pacific: Market Size, By Steel Type, 2015–2022 (USD Million)
Table 79 Asia Pacific: Market Size, By Steel Type, 2015–2022 (KT)
Table 80 Asia Pacific: Market Size, By Application, 2015–2022 (USD Million)
Table 81 Asia Pacific: Market Size, By Application, 2015–2022 (KT)
Table 82 China: Heat-Treated Steel Plates Market Size, By Steel Type, 2015–2022 (USD Million)
Table 83 China: Market Size, By Steel Type, 2015–2022 (KT)
Table 84 China: Market Size, By Application, 2015–2022 (USD Million)
Table 85 China: Market Size, By Application, 2015–2022 (KT)
Table 86 India: Heat-Treated Steel Plates Market Size, By Steel Type, 2015–2022 (USD Million)
Table 87 India: Market Size, By Steel Type, 2015–2022 (KT)
Table 88 India: Market Size, By Application, 2015–2022 (USD Million)
Table 89 India: Market Size, By Application, 2015–2022 (KT)
Table 90 Japan: Heat-Treated Steel Plates Market Size, By Steel Type, 2015–2022 (USD Million)
Table 91 Japan: Market Size, By Steel Type, 2015–2022 (KT)
Table 92 Japan: Market Size, By Application, 2015–2022 (USD Million)
Table 93 Japan: Market Size, By Application, 2015–2022 (KT)
Table 94 South Korea: Heat-Treated Steel Plates Market Size, By Steel Type, 2015–2022 (USD Million)
Table 95 South Korea: Market Size, By Steel Type, 2015–2022 (KT)
Table 96 South Korea: Market Size, By Application, 2015–2022 (USD Million)
Table 97 South Korea: Market Size, By Application, 2015–2022 (KT)
Table 98 Australia: Heat-Treated Steel Plates Market Size, By Steel Type, 2015–2022 (USD Million)
Table 99 Australia: Market Size, By Steel Type, 2015–2022 (KT)
Table 100 Australia: Market Size, By Application, 2015–2022 (USD Million)
Table 101 Australia: Market Size, By Application, 2015–2022 (KT)
Table 102 Rest of Asia Pacific: Heat-Treated Steel Plates Market Size, By Steel Type, 2015–2022 (USD Million)
Table 103 Rest of Asia Pacific: Market Size, By Steel Type, 2015–2022 (KT)
Table 104 Rest of Asia Pacific: Market Size, By Application, 2015–2022 (USD Million)
Table 105 Rest of Asia Pacific: Market Size, By Application, 2015–2022 (KT)
Table 106 Middle East & Africa: Heat-Treated Steel Plates Market Size, By Country, 2015–2022 (USD Million)
Table 107 Middle East & Africa: Market Size, By Country, 2015–2022 (KT)
Table 108 Middle East & Africa: Market Size, By Steel Type, 2015–2022 (USD Million)
Table 109 Middle East & Africa: Market Size, By Steel Type, 2015–2022 (KT)
Table 110 Middle East & Africa: Market Size, By Application, 2015–2022 (USD Million)
Table 111 Middle East & Africa: Market Size, By Application, 2015–2022 (KT)
Table 112 UAE: Heat-Treated Steel Plates Market Size, By Steel Type, 2015–2022 (USD Million)
Table 113 UAE: Market Size, By Steel Type, 2015–2022 (KT)
Table 114 UAE: Market Size, By Application, 2015–2022 (USD Million)
Table 115 UAE: Market Size, By Application, 2015–2022 (KT)
Table 116 Turkey: Heat-Treated Steel Plates Market Size, By Steel Type, 2015–2022 (USD Million)
Table 117 Turkey: Market Size, By Steel Type, 2015–2022 (KT)
Table 118 Turkey: Market Size, By Application, 2015–2022 (USD Million)
Table 119 Turkey: Market Size, By Application, 2015–2022 (KT)
Table 120 Iran: Heat-Treated Steel Plates Market Size, By Steel Type, 2015–2022 (USD Million)
Table 121 Iran: Market Size, By Steel Type, 2015–2022 (KT)
Table 122 Iran: Market Size, By Application, 2015–2022 (USD Million)
Table 123 Iran: Market Size, By Application, 2015–2022 (KT)
Table 124 Saudi Arabia: Heat-Treated Steel Plates Market Size, By Steel Type, 2015–2022 (USD Million)
Table 125 Saudi Arabia: Market Size, By Steel Type, 2015–2022 (KT)
Table 126 Saudi Arabia: Market Size, By Application, 2015–2022 (USD Million)
Table 127 Saudi Arabia: Market Size, By Application, 2015–2022 (KT)
Table 128 South Africa: Heat-Treated Steel Plates Market Size, By Steel Type, 2015–2022 (USD Million)
Table 129 South Africa: Market Size, By Steel Type, 2015–2022 (KT)
Table 130 South Africa: Market Size, By Application, 2015–2022 (USD Million)
Table 131 South Africa: Market Size, By Application, 2015–2022 (KT)
Table 132 Rest of the Middle East & Africa: Heat-Treated Steel Plates Market Size, By Steel Type, 2015–2022 (USD Million)
Table 133 Rest of the Middle East & Africa: Market Size, By Steel Type, 2015–2022 (KT)
Table 134 Rest of the Middle East & Africa: Market Size, By Application, 2015–2022 (USD Million)
Table 135 Rest of the Middle East & Africa: Market Size, By Application, 2015–2022 (KT)
Table 136 South America: Heat-Treated Steel Plates Market Size, By Country, 2015–2022 (USD Million)
Table 137 South America: Market Size, By Country, 2015–2022 (KT)
Table 138 South America: Market Size, By Steel Type, 2015–2022 (USD Million)
Table 139 South America: Market Size, By Steel Type, 2015–2022 (KT)
Table 140 South America: Market Size, By Application, 2015–2022 (USD Million)
Table 141 South America: Market Size, By Application, 2015–2022 (KT)
Table 142 Brazil: Heat-Treated Steel Plates Market Size, By Steel Type, 2015–2022 (USD Million)
Table 143 Brazil: Market Size, By Steel Type, 2015–2022 (KT)
Table 144 Brazil: Market Size, By Application, 2015–2022 (USD Million)
Table 145 Brazil: Market Size, By Application, 2015–2022 (KT)
Table 146 Argentina: Heat-Treated Steel Plates Market Size, By Steel Type, 2015–2022 (USD Million)
Table 147 Argentina: Market Size, By Steel Type, 2015–2022 (KT)
Table 148 Argentina: Market Size, By Application, 2015–2022 (USD Million)
Table 149 Argentina: Market Size, By Application, 2015–2022 (KT)
Table 150 Rest of South America: Heat-Treated Steel Plates Market Size, By Steel Type, 2015–2022 (USD Million)
Table 151 Rest of South America: Market Size, By Steel Type, 2015–2022 (KT)
Table 152 Rest of South America: Market Size, By Application, 2015–2022 (USD Million)
Table 153 Rest of South America: Market Size, By Application, 2015–2022 (KT)
Table 154 Market Ranking of Key Players, 2016
Table 155 Expansions, 2016–2017
Table 156 Agreements, 2016–2017
Table 157 Acquisitions, 2016–2017
Table 158 Investments, 2014–2017
Table 159 Divestments, 2015–2017
Table 160 New Product Launches, 2014–2017
Table 161 Mergers, 2013–2016
Table 162 Joint Ventures, 2015–2017
Table 163 Partnerships, 2013–2017
List of Figures (46 Figures)
Figure 1 Heat-Treated Steel Plates Market: Segmentation
Figure 2 Heat-Treated Steel Plates Market: Research Design
Figure 3 Market Size Estimation Methodology: Bottom-Up Approach
Figure 4 Market Size Estimation Methodology: Top-Down Approach
Figure 5 Heat-Treated Steel Plates Market: Data Triangulation
Figure 6 Assumptions of the Research Study
Figure 7 Limitations of the Research Study
Figure 8 Heat-Treated Carbon Steel Plates to Dominate the Market Through 2022
Figure 9 The Quenching & Tempering Segment is Estimated to Account for the Largest Share in the Heat-Treated Steel Plates Market Through 2022
Figure 10 Construction Application to Lead the Market for Heat-Treated Steel Plates Through 2022
Figure 11 Asia Pacific Dominated the Heat-Treated Steel Plates Market in 2016
Figure 12 Market Growth is Attributed to the Recovery of the Construction Industry and Growth of the Energy & Power and Automotive Sectors
Figure 13 Carbon Steel to Lead the Heat-Treated Steel Plates Market Through 2022
Figure 14 Demand for Heat-Treated Steel Plates to Grow at the Highest CAGR in Energy & Power Applications
Figure 15 Quenching & Tempering Was Most Widely Adopted for Heat Treatment of Steel Plates in 2016
Figure 16 Construction Accounted for the Largest Share in Asia Pacific in 2016
Figure 17 Market in China is Projected to Grow at the Highest Rate From 2017 to 2022
Figure 18 Heat-Treated Steel Plates Market: Drivers, Restraints, Opportunities, and Challenges
Figure 19 Coal Price in Northwest Europe, 2010–2016
Figure 20 Supply Chain Analysis
Figure 21 Porter’s Five Forces Analysis
Figure 22 Heat-Treated Steel Plates Market Size, By Steel Type, 2017 vs 2022 (USD Million)
Figure 23 Heat-Treated Steel Plates Market Size, By Treatment, 2017 vs 2022 (USD Million)
Figure 24 Heat-Treated Steel Plates Market Size, By Application, 2017 vs 2022 (USD Million)
Figure 25 Geographic Snapshot (2017–2022): China is Projected to Grow at the Highest Rate, in Terms of Value
Figure 26 Europe: Heat-Treated Steel Plates Market Snapshot
Figure 27 Asia Pacific: Heat-Treated Steel Plates Market Snapshot
Figure 28 Companies Adopted Expansion as the Key Growth Strategy Between 2013 & 2017
Figure 29 Arcelormittal: Company Snapshot
Figure 30 Arcelormittal: SWOT Analysis
Figure 31 Posco: Company Snapshot
Figure 32 Posco: SWOT Analysis
Figure 33 Nippon Steel & Sumitomo Metal Corporation: Company Snapshot
Figure 34 Nippon Steel & Sumitomo Metal Corporation: SWOT Analysis
Figure 35 JFE Holdings: Company Snapshot
Figure 36 JFE Holdings: SWOT Analysis
Figure 37 Baosteel: Company Snapshot
Figure 38 Baosteel: SWOT Analysis
Figure 39 Thyssenkrupp AG: Company Snapshot
Figure 40 Thyssenkrupp: SWOT Analysis
Figure 41 Tata Steel: Company Snapshot
Figure 42 Tata Steel: SWOT Analysis
Figure 43 Outokumpu: Company Snapshot
Figure 44 Outokumpu: SWOT Analysis
Figure 45 Novolipetsk Steel: Company Snapshot
Figure 46 Essar Steel: Company Snapshot


Growth opportunities and latent adjacency in Heat-treated Steel Plates Market