Flue Gas Treatment Systems Market by Pollutant Control System (Particulate Control, FGD, DeNOx, Mercury Control), Business Type (System, Service), End-Use Industry (Power, Cement, Iron & Steel), and Region - Global Forecasts to 2022


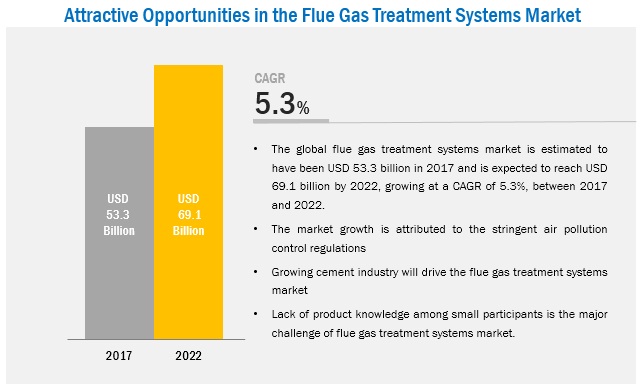
[143 Pages Report] flue gas treatment systems market was valued at USD 50.81 Billion in 2016 and is projected to reach USD 69.11 Billion by 2022, at a CAGR of 5.3% during the forecast period from 2017 to 2022. In this study, 2016 has been considered as the base year while the forecast period that has been considered is from 2017 to 2022.
The main objective of this study is to define, describe, and forecast the flue gas treatment systems market based on business type, pollutant control system, end-use industry, and region. In this report, the flue gas treatment systems market has been studied in North America, Europe, Asia Pacific, the Middle East & Africa, and South America. The report includes detailed information about major factors such as drivers, opportunities, restraints, and industry-specific challenges influencing the growth of the flue gas treatment systems market across the globe. The report strategically analyzes market segments with respect to individual growth trends, future growth prospects, and contribution to the overall flue gas treatment systems market.
In this report, the size of the flue gas treatment systems market and its different segments has been derived from various research methodologies. In the secondary research process, different sources have been referred to identify and collect information for this study on the flue gas treatment systems market. These secondary sources include annual reports, press releases, and investor presentations of companies; associations such as the British Lime Association, the European Commission, the Ministry of Environmental Protection of different countries; and white papers, certified publications, and articles from recognized authors. In the primary research process, sources from both, supply- and demand-side have been interviewed to obtain qualitative and quantitative information regarding the flue gas treatment systems market. Both, bottom-up and top-down approaches have been used to estimate the market size, in terms of value. With the data triangulation procedure and validation of data through primaries, the exact sizes of the overall parent market and individual markets have been determined and confirmed in this study on the flue gas treatment systems market.
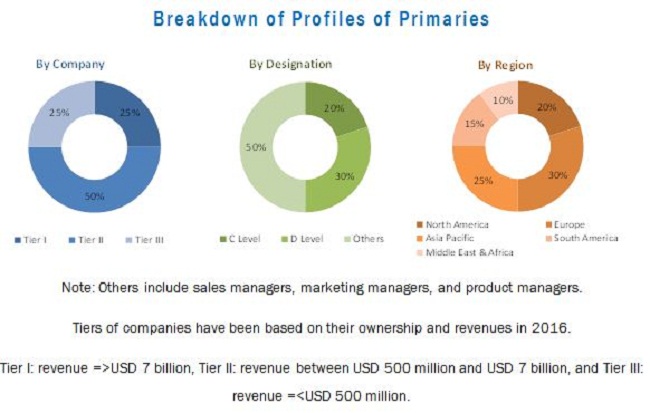
The figure below illustrates the breakdown of profiles of primaries.
To know about the assumptions considered for the study, download the pdf brochure
The flue gas treatment systems market includes raw material suppliers, manufacturers of flue gas treatment systems, and end users. General Electric (US), Babcock & Wilcox Enterprises, Inc. (US), Doosan Lentjes (Germany), Mitsubishi Hitachi Power Systems, Ltd. (Japan), FLSmidth (Denmark), and Thermax Limited (India) are the leading players operating in the flue gas treatment systems market.
The stakeholders in the flue gas treatment systems market are as follows:
- Manufacturers of Flue Gas Treatment Systems
- Traders, Distributors, and Suppliers of Flue Gas Treatment Systems
- Raw Material Suppliers
- Governments and Research Organizations
- Associations and Industrial Bodies
- R&D Institutions
- Environment Support Agencies
Get online access to the report on the World's First Market Intelligence Cloud
- Easy to Download Historical Data & Forecast Numbers
- Company Analysis Dashboard for high growth potential opportunities
- Research Analyst Access for customization & queries
- Competitor Analysis with Interactive dashboard
- Latest News, Updates & Trend analysis

Scope of the Report
This report forecasts the revenue growth of the flue gas treatment systems market and provides an analysis of trends for each subsegment of the market. This research report categorizes the flue gas treatment systems market as follows:
Flue Gas Treatment Systems Market, by Pollutant Control System:
- Particulate Control
- Flue Gas Desulfurization
- DeNOx
- Mercury Control
- Others (Volatile Organic Compounds, Dioxins, and Furans)
Flue Gas Treatment Systems Market, by Business Type:
- System
- Service
Flue Gas Treatment Systems Market, by End-use Industry:
- Power
- Cement
- Iron & Steel
- Non-Ferrous Metal
- Chemical & Petrochemical
- Others (Glass, Pharmaceuticals, and Pulp & Paper)
Flue Gas Treatment Systems Market, by Region:
- North America
- Asia Pacific
- Europe
- Middle East & Africa
- South America
The flue gas treatment systems market in each region has been further studied for the respective key countries.
Available Customizations:
The following customization options are available for this report on the flue gas treatment systems market:
Country Information
- Analysis of the flue gas treatment systems market in various other countries
- Detailed analysis and profiling of additional market players (up to five)
The flue gas treatment systems market is projected to reach USD 69.11 Billion by 2022, at a CAGR of 5.3% from 2017 to 2022. Flue gas treatment systems are used in a wide range of end-use industries such as power, cement, iron & steel, non-ferrous metal, and chemical & petrochemical, among others as they control emissions of various types of pollutants such as sulfur oxide, nitrogen oxide, fly ash, acidic gases, and volatile organic compounds that cause air pollution. Growing number of infrastructure development projects in various emerging economies such as India, China, and Thailand have led to increased demand for cement, thereby leading to its increased production. This increased production of cement is expected to fuel the growth of the flue gas treatment systems market during the forecast period.
Based on pollutant control system, the particulate control segment accounted for the largest share of the flue gas treatment systems market in 2016. This segment of the market is expected to continue its dominance during the forecast period as well. The growth of the particulate control segment of the flue gas treatment systems market can be attributed to the increased consumption of electrostatic precipitators and bag filters in various end-use industries such as power, cement, iron & steel, non-ferrous metal, and chemical & petrochemical, among others to control the particulate matter generated by them. The mercury control segment of the flue gas treatment systems market is projected to grow at highest CAGR during the forecast period. Installation of different systems to control mercury emissions in various countries such as the US, India, and China are also expected to boost the growth of the flue gas treatment systems market during the forecast period.
Among end-use industries, the power segment is projected to lead the flue gas treatment systems market during the forecast period. The growth of this segment of the market can be attributed to rising number of coal-based power plants in various countries such as China, Japan, Poland, and India and increasing adherence to environmental regulations by various industries.
Based on business type, the system segment is projected to lead the flue gas treatment systems market during the forecast period. The growth of this segment of the market can be attributed to the increasing installation of new flue gas treatment systems and upgrading the existing ones in various end-use industries.
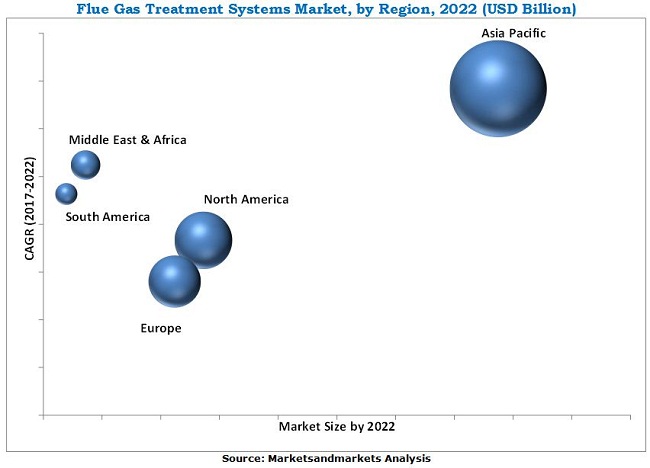
The Asia Pacific region is the largest market for flue gas treatment systems across the globe. The growth of the Asia Pacific flue gas treatment systems market can be attributed to the large industrial base in the region and increased demand for flue gas treatment systems from the cement and power industries of the region. In addition, several initiatives undertaken by governments of different countries of the Asia Pacific region to attract investments from various international companies are also expected to propel the growth of the Asia Pacific flue gas treatment systems market during the forecast period.
Lack of product knowledge among small manufacturers is a major challenge for the growth of the flue gas treatment systems market during the forecast period. General Electric (US), Babcock & Wilcox Enterprises, Inc. (US), Doosan Lentjes (Germany), Mitsubishi Hitachi Power Systems, Ltd. (Japan), FLSmidth (Denmark), and Thermax Limited (India) are the key players operating in the flue gas treatment systems market. These companies have adopted various organic as well as inorganic growth strategies between 2015 and 2017 to strengthen their position in the flue gas treatment systems market. The strategy of contracts & agreements was among the key growth strategies adopted by these leading market players to enhance their regional presence and meet the growing demand for flue gas treatment systems from emerging economies.
To speak to our analyst for a discussion on the above findings, click Speak to Analyst
Table of Contents
1 Introduction (Page No. - 15)
1.1 Objectives of the Study
1.2 Market Definition
1.3 Market Scope
1.3.1 Years Considered for the Study
1.4 Currency
1.5 Stakeholders
2 Research Methodology (Page No. - 18)
2.1 Research Data
2.1.1 Secondary Data
2.1.1.1 Key Data From Secondary Sources
2.1.2 Primary Data
2.1.2.1 Key Data From Primary Sources
2.1.2.2 Key Industry Insights
2.1.2.3 Breakdown of Primary Interviews
2.2 Market Size Estimation
2.3 Data Triangulation
2.4 Assumptions
2.5 Limitations
3 Executive Summary (Page No. - 25)
4 Premium Insights (Page No. - 28)
4.1 Attractive Opportunities in the Flue Gas Treatment Systems Market
4.2 Market Size, By Pollutant Control System
4.3 Market Share, By Region
4.4 Market Size, By End-Use Industry
4.5 APAC Market, By End-Use Industry and Country
5 Market Overview (Page No. - 31)
5.1 Introduction
5.2 Market Dynamics
5.2.1 Drivers
5.2.1.1 Stringent Air Pollution Control Regulations
5.2.1.2 Growing Cement Industry
5.2.1.3 Coal as the Most Reliable Resource for Energy Generation
5.2.1.4 Marketable By-Products
5.2.2 Restraints
5.2.2.1 Emergence of Alternative and Renewable Sources of Energy
5.2.3 Opportunities
5.2.3.1 Implementation of Mercury & Air Toxic Standards (Mats) in the Us
5.2.3.2 Increasing Number of Coal-Fired Plants
5.2.3.3 Commercial Deployment of Post-Combustion Carbon Capture Equipment
5.2.4 Challenges
5.2.4.1 Lack of Product Knowledge Among Small Participants
5.3 Porter�s Five for ces Analysis
5.3.1 Threat of New Entrants
5.3.2 Threat of Substitutes
5.3.3 Bargaining Power of Suppliers
5.3.4 Bargaining Power of Buyers
5.3.5 Intensity of Competitive Rivalry
6 Macroeconomic Overview (Page No. - 39)
6.1 Introduction
6.2 Power Generation
6.3 Cement
6.4 Regulations for Flue Gas Emissions
6.4.1 APAC
6.4.1.1 India
6.4.1.2 China
6.4.2 Europe
6.4.2.1 Germany
6.4.3 North America
6.4.3.1 US
7 Flue Gas Treatment Systems Market, By Pollutant Control System (Page No. - 46)
7.1 Introduction
7.2 Flue Gas Desulfurization (FGD) Systems
7.2.1 Wet FGD Systems
7.2.2 Dry FGD Systems
7.3 Denox Systems
7.3.1 SCR
7.3.2 Sncr
7.4 Particulate Control Systems
7.4.1 ESP
7.4.2 Fabric Filters
7.5 Mercury Control Systems
7.6 Other Pollutant Control Systems
8 Flue Gas Treatment Systems, By Business Type (Page No. - 54)
8.1 Introduction
8.2 System
8.2.1 New Projects
8.2.2 Retrofits and Upgrades
8.3 Service
9 Flue Gas Treatment Systems Market, By End-Use Industry (Page No. - 59)
9.1 Introduction
9.2 Power
9.3 Chemical & Petrochemical
9.4 Iron & Steel
9.5 Non-Ferrous Metal
9.6 Cement
9.7 Others
9.7.1 Pulp & Paper
9.7.2 Pharmaceutical
9.7.3 Glass
9.7.4 Oil & Gas
10 Flue Gas Treatment Systems Market, By Region (Page No. - 67)
10.1 Introduction
10.2 APAC
10.2.1 China
10.2.2 Japan
10.2.3 India
10.2.4 South Korea
10.2.5 Australia
10.2.6 Indonesia
10.2.7 Rest of APAC
10.3 North America
10.3.1 US
10.3.2 Canada
10.3.3 Mexico
10.4 Europe
10.4.1 Germany
10.4.2 Russia
10.4.3 Poland
10.4.4 UK
10.4.5 France
10.4.6 Italy
10.4.7 Spain
10.4.8 Rest of Europe
10.5 Middle East & Africa
10.5.1 South Africa
10.5.2 Turkey
10.5.3 Saudi Arabia
10.5.4 Rest of the Middle East & Africa
10.6 South America
10.6.1 Brazil
10.6.2 Chile
10.6.3 Rest of South America
11 Competitive Landscape (Page No. - 103)
11.1 Overview
11.2 Market Ranking of Key Players
11.3 Competitive Scenario
11.3.1 Acquisitions
11.3.2 Expansions
11.3.3 Contracts & Agreements
12 Company Profiles (Page No. - 110)
12.1 General Electric
12.2 Mitsubishi Hitachi Power Systems
12.3 Doosan Lentjes
12.4 Babcock & Wilcox Enterprises
12.5 Siemens
12.6 AMEC Foster Wheeler (John Wood Group Plc)
12.7 Clyde Bergemann Power Group
12.8 FLSmidth
12.9 Marsulex Environmental Technologies
12.10 Thermax
12.11 Other Key Players
12.11.1 Andritz
12.11.2 Aecom
12.11.3 Burns & Mcdonnell, Inc.
12.11.4 Beijing Guodian Longyuan Environmental Engineering
12.11.5 Bilfinger Engineering & Technologies Gmbh
12.11.6 Chiyoda Corporation
12.11.7 China Boqi Environmental (Holding)
12.11.8 China Everbright International
12.11.9 Ducon Technologies
12.11.10 Fuel Tech Inc.
12.11.11 Guodian Technology & Environment Group
12.11.12 Hamon Corporation
12.11.13 Haldor Topse A/S
12.11.14 Kawasaki Heavy Industries
12.11.15 Lonjing Environment Technology
12.11.16 LAB
12.11.17 Macrotek
12.11.18 Ppel-Power Plant Engineers
12.11.19 Rafako
12.11.20 Steinm�ller Babcock Environment Gmbh
12.11.21 Valmet
13 Appendix (Page No. - 134)
13.1 Insights From Industry Experts
13.2 Discussion Guide
13.3 Knowledge Store: Marketsandmarkets Subscription Portal
13.4 Introducing RT: Real-Time Market Intelligence
13.5 Available Customizations
13.6 Related Reports
13.7 Author Details
List of Tables (74 Tables)
Table 1 Power Generation, By Key Country and Source, 2014 (%)
Table 2 Trends and for ecast of Real Gdp Growth Rates From 2016 to 2022
Table 3 Installed CAPACity of Coal Power Plants in Key Countries, 2017
Table 4 Emission Standard (In Milligram Per Cubic Meter), 2016
Table 5 Emission Standards for Coal Power Plants
Table 6 Emission Standards for Air Pollutants From Coal-Fired Power Plants, 2012
Table 7 Emission Standards From Coal-Fired Power Plants in 2016
Table 8 Emission Standards From Coal-Fired Power Plants,2016
Table 9 Market Size, By Pollutant Control Systems, 2015�2022 (USD Million)
Table 10 FGD Systems Market Size, By Region, 2015�2022 (USD Million)
Table 11 Denox Systems Market Size, By Region, 2015�2022 (USD Million)
Table 12 Particulate Control Systems Market Size, By Region, 2015�2022 (USD Million)
Table 13 Mercury Control Systems Market Size, By Region, 2015�2022 (USD Million)
Table 14 Other Pollutant Control Systems Market Size, By Region, 2015�2022 (USD Million)
Table 15 Market Size, By Business Type, 2015�2022 (USD Million)
Table 16 Market Size, By End-Use Industry, 2015�2022 (USD Million)
Table 17 Emission Parameters Set By Moef and Cc in Amended Environment Protection Rules, 1986 (India)
Table 18 Market Size in Power End-Use Industry, By Region, 2015�2022 (USD Million)
Table 19 Pollutant Types and Control Mechanisms
Table 20 Market Size in Chemical & Petrochemical End-Use Industry, By Region, 2015�2022 (USD Million)
Table 21 Market Size in Iron & Steel End-Use Industry, By Region, 2015�2022 (USD Million)
Table 22 Market Size in Non-Ferrous Metal End-Use Industry, By Region, 2015�2022 (USD Million)
Table 23 Market Size in Cement End-Use Industry, By Region, 2015�2022 (USD Million)
Table 24 Market Size in Other End-Use Industry, By Region, 2015�2022 (USD Million)
Table 25 Market Size, By Region, 2015�2022 (USD Million)
Table 26 APAC: Market Size, By Country, 2015�2022 (USD Million)
Table 27 APAC: Market Size, By End-Use Industry, 2015�2022 (USD Million)
Table 28 APAC: Market Size, By Business Type, 2015�2022 (USD Million)
Table 29 APAC: Market Size, By Pollutant Control Systems, 2015�2022 (USD Million)
Table 30 China: Market Size, By End-Use Industry, 2015�2022 (USD Million)
Table 31 Japan: Market Size, By End-Use Industry, 2015�2022 (USD Million)
Table 32 India: Market Size, By End-Use Industry, 2015�2022 (USD Million)
Table 33 South Korea: Market Size, By End-Use Industry, 2015�2022 (USD Million)
Table 34 Australia: Market Size, By End-Use Industry, 2015�2022 (USD Million)
Table 35 Indonesia: Market Size, By End-Use Industry, 2015�2022 (USD Million)
Table 36 Rest of APAC: Market Size, By End-Use Industry, 2015�2022 (USD Million)
Table 37 North America: Market Size, By Country, 2015�2022 (USD Million)
Table 38 North America: Market Size, By Business Type, 2015�2022 (USD Million)
Table 39 North America: Market Size, By Pollutant Control Systems, 2015�2022 (USD Million)
Table 40 North America: Market Size, By End-Use Industry, 2015�2022 (USD Million)
Table 41 US: Market Size, By End-Use Industry, 2015�2022 (USD Million)
Table 42 Canada: Market Size, By End-Use Industry, 2015�2022 (USD Million)
Table 43 Mexico: Market Size, By End-Use Industry, 2015�2022 (USD Million)
Table 44 Air Quality Standard Emission Limits of Eu
Table 45 Europe: Market Size, By Country, 2015�2022 (USD Million)
Table 46 Europe: Market Size, By End-Use Industry, 2015�2022 (USD Million)
Table 47 Europe: Market Size, By Business Type, 2015�2022 (USD Million)
Table 48 Europe: Market Size, By Pollutant Control Systems, 2015�2022 (USD Million)
Table 49 Germany: Market Size, By End-Use Industry, 2015�2022 (USD Million)
Table 50 Russia: Market Size, By End-Use Industry, 2015�2022 (USD Million)
Table 51 Poland: Market Size, By End-Use Industry, 2015�2022 (USD Million)
Table 52 UK: Market Size, By End-Use Industry, 2015�2022 (USD Million)
Table 53 France: Market Size, By End-Use Industry, 2015�2022 (USD Million)
Table 54 Italy: Market Size, By End-Use Industry, 2015�2022 (USD Million)
Table 55 Spain: Market Size, By End-Use Industry, 2015�2022 (USD Million)
Table 56 Rest of Europe: Market Size, By End-Use Industry, 2015�2022 (USD Million)
Table 57 Middle East & Africa: Market Size, By Country, 2015�2022 (USD Million)
Table 58 Middle East & Africa: Market Size, By Business Type, 2015�2022 (USD Million)
Table 59 Middle East & Africa: Market Size, By Pollutant Control System, 2015�2022 (USD Million)
Table 60 Middle East & Africa: Market Size, By End-Use Industry, 2015�2022 (USD Million)
Table 61 South Africa: Market Size, By End-Use Industry, 2015�2022 (USD Million)
Table 62 Turkey: Market Size, By End-Use Industry, 2015�2022 (USD Million)
Table 63 Saudi Arabia: Market Size, By End-Use Industry, 2015�2022 (USD Million)
Table 64 Rest of the Middle East & Africa: Market Size, By End-Use Industry, 2015�2022 (USD Million)
Table 65 South America: Market Size, By Country, 2015�2022 (USD Million)
Table 66 South America: Market Size, By Business Type, 2015�2022 (USD Million)
Table 67 South America: Market Size, By Pollution Control Systems, 2015�2022 (USD Million)
Table 68 South America: Market Size, By End-Use Industry, 2015�2022 (USD Million)
Table 69 Brazil: Market Size, By End-Use Industry, 2015�2022 (USD Million)
Table 70 Chile: Market Size, By End-Use Industry, 2015�2022 (USD Million)
Table 71 Rest of South America: Market Size, By End-Use Industry, 2015�2022 (USD Million)
Table 72 Acquisitions, 2015�2017
Table 73 Expansions, 2015�2017
Table 74 Contracts & Agreements, 2015�2017
List of Figures (35 Figures)
Figure 1 Flue Gas Treatment Systems: Market Segmentation
Figure 2 Market: Research Design
Figure 3 Bottom-Up Approach
Figure 4 Top-Down Approach
Figure 5 Market: Data Triangulation
Figure 6 Power to Be the Largest End-Use Industry of Flue Gas Treatment Systems
Figure 7 System to Be the Leading Business Type of Flue Gas Treatment Systems
Figure 8 Mercury Control to Be the Fastest-Growing Pollutant Control Systems for Flue Gas Treatment
Figure 9 APAC to Be the Fastest-Growing Market for Flue Gas Treatment Systems During the for ecast Period
Figure 10 Significant Growth in the Market Between 2017 and 2022
Figure 11 Mercury Control to Be the Fastest-Growing Pollutant Control Systems for Flue Gas Treatment
Figure 12 APAC Accounted for the Largest Market Share in 2016
Figure 13 Cement to Be the Fastest-Growing End-Use Industry for Flue Gas Treatment Systems
Figure 14 Power Was the Largest End-Use Industry of Flue Gas Treatment Systems Market
Figure 15 Overview of the Factors Governing the Flue Gas Treatment Systems Market
Figure 16 Renewable Electricity Generation CAPACity Growth, By Technology
Figure 17 Porter�s Five for ces Analysis
Figure 18 Global Cement Production in 2016
Figure 19 Contribution of Coal Power Plants to Industrial Emissions
Figure 20 Particulate Control is the Largest Pollutant Control Systems
Figure 21 System to Be the Faster-Growing Business Type of the Market
Figure 22 Cement to Be the Fastest-Growing End-Use Industry of Flue Gas Treatment Systems
Figure 23 India to Register the Highest Cagr in the Market Between 2017 and 2022
Figure 24 APAC Market Snapshot
Figure 25 China Power Generation Mix in 2016
Figure 26 North America Market Snapshot
Figure 27 Germany to Be the Leading Market in Europe
Figure 28 Contracts & Agreements Were Adopted as the Key Growth Strategy By Top Manufacturers
Figure 29 Ranking of Flue Gas Treatment Systems Manufacturers in 2016
Figure 30 General Electric: Company Snapshot
Figure 31 Babcock & Wilcox Enterprises: Company Snapshot
Figure 32 Siemens: Company Snapshot
Figure 33 AMEC Foster Wheeler: Company Snapshot
Figure 34 FLSmidth: Company Snapshot
Figure 35 Thermax: Company Snapshot


Growth opportunities and latent adjacency in Flue Gas Treatment Systems Market
Overview on flue gas treatment systems
Industrial Flue Gas Treatment Systems & Services Market by Pollutant Control System
Market Analysis of Flue Gas Treatment in South East Asia and India
Interested in understanding Flue gas treatment systems and chemicals