Data Quality Tools Market by Data Type (Customer Data, Product Data, Financial Data, Compliance Data, and Supplier Data), Component (Software and Services), Business Function, Deployment Model, Organization Size, Vertical - Global Forecast to 2022


[154 Pages Report] The overall data quality tools market is expected to grow from USD 610.2 Million in 2017 to USD 1,376.7 Million by 2022, at a CAGR of 17.7% from 2017 to 2022. The advent of technology is a major factor resulting in data explosion. Furthermore, the fall in gadget prices, the increasing accessibility of users to smart devices, and powerful computing tools have contributed to this rise in data. The ever-expanding amount of data has led to complex data types and formats, thus understanding and evaluating the information from this collected data for rapid actionable decisions is expected to drive the growth of the data quality tools market. The base year considered for the study is 2016, and the forecast has been provided for the period between 2017 and 2023.
Data Quality Tools Market Dynamics
Drivers
- Increasing volume of business data
- Need for improving bottom-line performance through better customer engagement
- Increasing use of external data sources
- Increasing regulatory pressure and risk to brand reputation
Restraints
- Lack of awareness
Opportunities
- Rise of artificial intelligence for data quality
Challenges
- Complex data structures
- Integration affecting data timeliness
Digitalization and Advent of IoT in healthcare and life sciences industry drives the global data quality tools market
The health and life sciences vertical is expected to grow at the highest CAGR in the data quality tools market during the forecast period. This vertical is expected to leverage the benefits of data quality tools substantially. The vertical has always been overloaded with data, chiefly from patients, clinical, claims, hospital systems, financials, pharmacies, and most recently from wearable technology sources. The vertical is pushing toward generating electronic health records and periodically updating the reporting methods and data storage. The federal government is offering incentives to hospitals to trade off-paper medical charts with electronic health care records. With the records of the patients being captured digitally and stored on-premises or on cloud, any vulnerabilities in the data can be potentially hazardous. Thus, adopting a robust data quality program is vital for this ever-growing vertical.
The following are the major objectives of the study.
- To describe and forecast the data quality tools market, in terms of data types, business functions, components, deployment models, organization sizes, and verticals
- To describe and forecast the market size of the five main regional segments, namely, North America, Europe, Asia Pacific (APAC), Middle East and Africa (MEA), and Latin America
- To provide detailed information regarding major factors influencing market growth (drivers, restraints, opportunities, and challenges)
- To strategically analyze micromarkets with respect to individual growth trends, prospects, and contributions to the overall market
- To analyze opportunities in the market for stakeholders by identifying the high-growth segments of the data quality tools ecosystem
- To strategically profile key players and comprehensively analyze their market position in terms of ranking and core competencies, along with detailing competitive landscape for market leaders
- To analyze strategic approaches such as product launches, acquisitions, contracts, agreements, and partnerships in the market
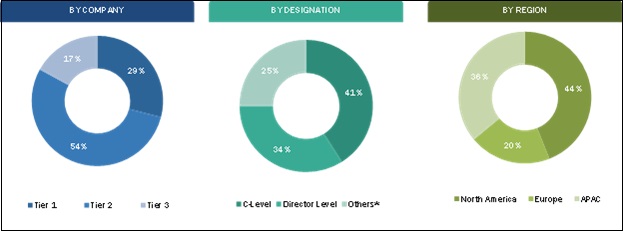
During this research study, major players operating in the data quality tools market in various regions have been identified, and their offerings, regional presence, and distribution channels have been analyzed through in-depth discussions. Top-down and bottom-up approaches have been used to determine the overall market size. Sizes of the other individual markets have been estimated using the percentage splits obtained through secondary sources such as Hoovers, Bloomberg BusinessWeek, and Factiva, along with primary respondents. The entire procedure includes the study of the annual and financial reports of the top market players and extensive interviews with industry experts such as CEOs, VPs, directors, and marketing executives for key insights (both qualitative and quantitative) pertaining to the market. The figure below shows the breakdown of the primaries on the basis of the company type, designation, and region considered during the research study.
BREAKDOWN OF PRIMARY PARTICIPANTS
To know about the assumptions considered for the study, download the pdf brochure
The data quality tools market is led by software and service providers, such as Microsoft Corporation (US), SAP SE (Germany), IBM Corporation (US), SAS Institute Inc. (US), Oracle Corporation (US), Informatics Corporation (US), Experian Data Quality (US), Tamr (US), Pitney Bowes (US), Information Builder (US), Talend (US), Trianz (US) and Syncsort (US). These Data Quality Tools Software Vendors are rated and listed by us on the basis of product quality, reliability, and their business strategy. Please visit 360Quadrants to see the vendor listing of Data Quality Tools Software.
Major Data Quality Tools Market Developments
- In May 2017, Informatica launched Informatica Data Governance & Compliance. This is the industry�s first data governance solution built particularly to strengthen enterprise data governance and compliance. The Informatica Data Governance & Compliance solution will help enterprises in engaging their IT and data security teams for governing all data types, such as cloud, on-premises, and big data.
- In March 2017, Trillium Software, a Syncsort company, launched Trillium Precise, a data-as-a-service solution that offers a single view of customers enabling accurate, verified, and complete real-time data.
- In February 2016, Information Builders launched the iWay Hadoop Data Manager to provide Hadoop-based data integration and management. The solution offers an easy-to-use interface that is instrumental in generating portable and reusable codes for Hadoop�s data integration tasks, such as data ingestion, transformation, and cleansing.
Target Audience:
- Data quality solution providers
- Governance, Risk Management, and Compliance (GRC) solution providers
- Consulting companies
- Government agencies
- Risk assessment service providers
- Investors and venture capitalists
- Value-added resellers
- Small and Medium-Sized Enterprises (SMEs) and large enterprises
- Third-party providers
- Consultants/consultancies/advisory firms
- Support and maintenance service providers
- Technology providers
Report Scope:
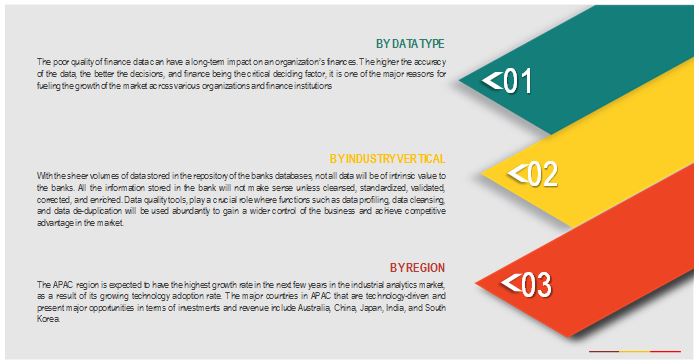
By Data Type:
- Customer data
- Product data
- Financial data
- Compliance data
- Supplier data
By Business Function:
- Marketing
- Sales
- Finance
- Legal
- Human resources
By Component:
- Software
- Services
- Professional services
- Consulting
- Support and maintenance
- Education and training
- Managed services
- Professional services
By Deployment Model:
- On-premises
- On-demand
By Organization Size:
- SMEs
- Large enterprises
By Vertical:
- Banking, Financial Services, and Insurance (BFSI)
- Telecommunications and IT
- Retail and eCommerce
- Healthcare and Life sciences
- Manufacturing
- Government
- Energy and utilities
- Media and entertainment
- Others
By Region:
- North America
- Europe
- MEA
- APAC
- Latin America
- What are new application areas which the data quality tools companies are exploring?
- Which are the key players in the market and how intense is the competition?
Available Customizations:
Based on the given market data, MarketsandMarkets offers customizations in the reports as per the client�s specific requirements. The available customization options are as follows:
Geographic Analysis
- Further breakdown of the North American data quality tools market
- Further breakdown of the European market
- Further breakdown of the APAC market
- Further breakdown of the MEA market
- Further breakdown of the Latin American market
Company Information
- Detailed analysis and profiling of additional market players (Up to 5)
The overall data quality tools market is expected to grow from USD 610.2 Million in 2017 to USD 1,376.7 Million by 2022, at a CAGR of 17.7%. The increasing volume of business data and the need for improving the bottom-line performance through better customer engagement are the key factors driving the growth of this market.
In today�s dynamic business environment, sustainability is the biggest challenge for every enterprise. With the substantial proliferation of data around numerous business functions, such as marketing, sales, operations, and human resources, the need to ascertain the quality of data has increased rapidly. Enterprises are investing heavily to harness benefits from the increasing volumes of data as well as to ensure the quality and continuous affordability to meet the customers� demands. Eventually, these investments are crucial for improving the quality of data using data quality tools. The enterprises are encompassing data quality tools to improve the overall business performance and develop advanced business strategies to optimize the risk exposure to accelerate the growth and profitability. Machine learning has played a vital role in increasing the visibility and has also assisted in managing and improving the data quality. This, in turn, is driving the overall growth of the market.
Data Quality tools market has been segmented, on the basis of data type, into customer data, product data, financial data, compliance data and suppler data. Financial data is expected to grow at the highest CAGR between 2017 and 2022. Financial data comprises sets of information related to the financial operations of a business. These sets of data are used by management to study business performance and identify whether there is need for defining new business strategies.
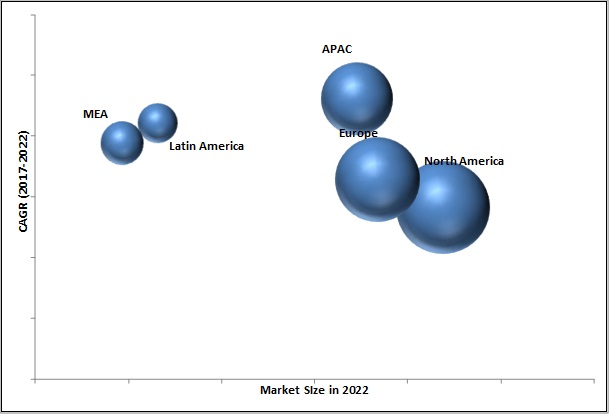
The data quality tools market in APAC is expected to grow at the highest CAGR during the forecast period. The APAC market has shown tremendous growth opportunities, especially in the regions of developing economies, such as China, India, and Bangladesh. With the growth of smart cities and proliferation of IoT devices, the region is expected to witness an ultra-growth in the future. Further, the start-up culture, the flexible government policies, the flourishing eCommerce business, and the spirit to deliver impeccable goods and services to every part of the world cannot be underestimated. Rather, it can only attest the unprecedented adoption of data quality tools and services in this region.
DATA QUALITY TOOLS MARKET, BY REGION, 2023 (USD MILLION)
Healthcare and Life Sciences
The healthcare and life sciences vertical is expected to leverage the benefits of data quality tools substantially. The vertical has always been overloaded with data, chiefly from patient, clinical, claim, hospital system, financial, pharmacy, and most recently from wearable technology sources. The industry is pushing toward generating electronic health records and periodically updating reporting methods and data storage. The federal government is offering incentives to the hospitals to trade off paper medical charts with electronic health care records. With the records of the patients being captured digitally and getting stored on-premises or on cloud, any vulnerabilities in the data can be potentially hazardous, which triggers the growth of adoption of adoption of data quality tools in the market.
Retail and eCommerce
The continuous rise of big data, growth of eCommerce, and increased usage of social media are a few of the drivers boosting the growth and adoption of data quality tools in the retail and eCommerce vertical. The vertical is generating unprecedented amount of data from social media, where consumers are openly sharing ideas and opinions with friends through numerous networking platforms. The data can be captured from these places, integrated together, analyzed, and valuable information can be extracted to meet customer demands, increase sales, improve business performance, and thereby have a differentiating edge over the competitors.
Government
The government sector thrives on a better data quality as well as data integrity programs. The industry is gearing up for advanced analytical applications, which is expected to give this industry real-time insight about the demography of the population. The data can be managed and analyzed effectively by government bodies to prepare effective campaign strategies. Infusing analytics in the application is expected to help the government in fixing the priorities of work and giving them broader insights of the development imitated and carried at the local level.
Telecommunications and IT
Telecom companies worldwide are grappling with the unprecedented challenge of enhancing and maintaining the quality of their data assets to minimize revenue leakages and reduce their process failures. The latest predictions from CFCA 2015 Industry Survey reveals that telecom operators globally incur an average loss of 13% or USD 294 billion due to numerous uncollected revenue and frauds prevailing in this industry. Poor administration of back office database clubbed with inefficient data quality tools are the major reasons for bringing such upheavals in this industry.
Adopting data quality tools could help CSPs to identify, cleanse, and enrich their in-house generated data using data-deduplication tools. Clean and enriched data provides better insights to comprehend customer�s demand which could be capitalized by offering customized services ensuring customer retention and establishes higher brand loyalty.
Critical questions the report answers:
- Where will all these developments take the industry in the mid to long term?
- What are the upcoming industry applications for data quality tools?
Lack of awareness is a major factor restraining the growth of the market. Enterprises with a large number of employees have been adopting advanced solutions to enhance their performance, considering the large pool of data available with these enterprises. Enterprises are aware of the poor quality of data and understand that bad data could have a negative impact on their performance, revenue, sales, and profits. However, many organizations still adhere to traditional time-consuming and tedious methodologies, such as manually rectifying the errors present in the data. This can be majorly attributed to the lack of awareness of the availability of new technologies in the market. According to a survey carried out by Experian, almost 53% of the companies prefer manual methods for data cleansing to that of automated methods. This includes reviewing of data manually on Excel. The absence of a centralized strategy for maintaining data quality is another factor restraining the adoption among businesses.
Key players in the market include Experian Data Quality (Experian Plc) (US), Informatica (US), Information Builders (US), IBM (US), Microsoft (US), Oracle (US), Pitney Bowes (US), SAP (Germany), SAS Institute (US), Syncsort (US), Talend (US), Trianz (US), and Tamr (US). These players are increasingly undertaking mergers and acquisitions, and product launches to develop and introduce new technologies and products in the market.
To speak to our analyst for a discussion on the above findings, click Speak to Analyst
Table of Contents
1 Introduction (Page No. - 15)
1.1 Objectives of the Study
1.2 Market Definition
1.3 Market Scope
1.4 Years Considered for the Study
1.5 Currency
1.6 Stakeholders
2 Research Methodology (Page No. - 19)
2.1 Research Data
2.1.1 Secondary Data
2.1.2 Primary Data
2.1.2.1 Breakdown of Primaries
2.1.2.2 Key Industry Insights
2.2 Market Size Estimation
2.3 Microquadrant Research Methodology
2.3.1 Vendor Inclusion Criteria
2.4 Research Assumptions
2.5 Limitations
3 Executive Summary (Page No. - 26)
4 Premium Insights (Page No. - 31)
4.1 Attractive Market Opportunities in the Market
4.2 Data Quality Tools: Market Share Across Various Regions
4.3 Data Quality Tools Market: By Vertical and Region
4.4 Lifecycle Analysis, By Region, 2017
5 Market Overview and Industry Trends (Page No. - 34)
5.1 Market Overview
5.1.1 Introduction
5.1.2 Market Dynamics
5.1.2.1 Drivers
5.1.2.1.1 Increasing Volume of Business Data
5.1.2.1.2 Need for Improving Bottom-Line Performance Through Better Customer Engagement
5.1.2.1.3 Increasing Use of External Data Sources
5.1.2.1.4 Increasing Regulatory Pressure and Risk to Brand Reputation
5.1.2.2 Restraints
5.1.2.2.1 Lack of Awareness
5.1.2.3 Opportunities
5.1.2.3.1 Rise of Artificial Intelligence for Data Quality
5.1.2.4 Challenges
5.1.2.4.1 Complex Data Structures
5.1.2.4.2 Integration Affecting Data Timeliness
5.2 Industry Trends
5.2.1 Technology Overview
5.2.1.1 Normalization Tools
5.2.1.2 Statistical Tools
5.2.1.3 ETL Tools
5.2.2 Data Quality Tools�Use Cases
5.2.2.1 Use Case #1
5.2.2.2 Use Case #2
5.2.2.3 Use Case #3
5.2.2.4 Use Case #4
5.2.2.5 Use Case #5
5.2.3 Data Quality Activities
6 Data Quality Tools Market Analysis By Data Type (Page No. - 43)
6.1 Introduction
6.2 Customer Data
6.3 Product Data
6.4 Financial Data
6.5 Compliance Data
6.6 Supplier Data
7 Data Quality Tools Market Analysis By Business Function (Page No. - 48)
7.1 Introduction
7.2 Marketing
7.3 Sales
7.4 Finance
7.5 Legal
7.6 Operations
7.7 Human Resources
8 Data Quality Tools Market Analysis By Component (Page No. - 55)
8.1 Introduction
8.2 Software
8.3 Services
8.3.1 Professional Services
8.3.1.1 Consulting Services
8.3.1.2 Support and Maintenance
8.3.1.3 Education and Training
8.3.2 Managed Services
9 Data Quality Tools Market Analysis By Deployment Model (Page No. - 62)
9.1 Introduction
9.2 On-Premises
9.3 On-Demand
10 Data Quality Tools Market Analysis By Organization Size (Page No. - 66)
10.1 Introduction
10.2 Large Enterprises
10.3 Small and Medium-Sized Enterprises
11 Data Quality Tools Market Analysis By Vertical (Page No. - 70)
11.1 Introduction
11.2 Banking, Financial Services, and Insurance
11.3 Telecommunications and IT
11.4 Retail and Ecommerce
11.5 Healthcare and Life Sciences
11.6 Manufacturing
11.7 Government
11.8 Energy and Utilities
11.9 Media and Entertainment
11.10 Others
12 Geographic Analysis (Page No. - 80)
12.1 Introduction
12.2 North America
12.3 Europe
12.4 Asia Pacific
12.5 Middle East and Africa
12.6 Latin America
13 Competitive Landscape (Page No. - 102)
13.1 Microquadrant Overview
13.1.1 Visionary Leaders
13.1.2 Innovators
13.1.3 Dynamic Differentiators
13.1.4 Emerging Companies
13.2 Competitive Benchmarking
13.2.1 Strength of Product Portfolio Adopted By Major Players in the Market
13.2.2 Business Strategy Excellence Adopted By Major Players in the Market
14 Company Profiles (Page No. - 106)
Overview, Strength of Product Portfolio, Business Strategy Excellence, Recent Developments, Key Relationships
14.1 International Business Machines Corporation
14.2 Informatica
14.3 Oracle Corporation
14.4 SAP SE
14.5 SAS Institute Inc.
14.6 Talend
14.7 Experian PLC
14.8 Information Builders
14.9 Microsoft Corporation
14.10 Pitney Bowes Inc.
14.11 Syncsort
14.12 Tamr
14.13 Trianz
*Details on Overview, Strength of Product Portfolio, Business Strategy Excellence, Recent Developments Might Not Be Captured in Case of Unlisted Companies.
15 Appendix (Page No. - 144)
15.1 Key Insights
15.2 Discussion Guide
15.3 Knowledge Store: Marketsandmarkets� Subscription Portal
15.4 Introducing RT: Real-Time Market Intelligence
15.5 Available Customization
15.6 Related Reports
15.8 Author Details
List of Tables (76 Tables)
Table 1 United States Dollar Exchange Rate, 2014�2016
Table 2 Evaluation Criteria
Table 3 Data Quality Tools Market Size By Data Type, 2015�2022 (USD Million)
Table 4 Customer Data: Market Size, By Region, 2015�2022 (USD Million)
Table 5 Product Data: Market Size, By Region, 2015�2022 (USD Million)
Table 6 Financial Data: Market Size, By Region, 2015�2022 (USD Million)
Table 7 Compliance Data: Market Size, By Region, 2015�2022 (USD Million)
Table 8 Supplier Data: Market Size, By Region, 2015�2022 (USD Million)
Table 9 Data Quality Tools Market Size By Business Function, 2015�2022 (USD Million)
Table 10 Marketing: Market Size, By Region, 2015�2022 (USD Million)
Table 11 Sales: Market Size, By Region, 2015�2022 (USD Million)
Table 12 Finance: Market Size, By Region, 2015�2022 (USD Million)
Table 13 Legal: Market Size, By Region, 2015�2022 (USD Million)
Table 14 Operations: Market Size, By Region, 2015�2022 (USD Million)
Table 15 Human Resources: Market Size, By Region, 2015�2022 (USD Million)
Table 16 Data Quality Tools Market Size By Component, 2015�2022 (USD Million)
Table 17 Market Size, By Service, 2015�2022 (USD Million)
Table 18 Market Size, By Professional Service, 2015�2022 (USD Million)
Table 19 Professional Services: Market Size, By Region, 2015�2022 (USD Million)
Table 20 Consulting Services Market Size, By Region, 2015�2022 (USD Million)
Table 21 Support and Maintenance Services Market Size, By Region, 2015�2022 (USD Million)
Table 22 Education and Training Market Size, By Region, 2015�2022 (USD Million)
Table 23 Managed Services: Market Size, By Region, 2015�2022 (USD Million)
Table 24 Data Quality Tools Market Size By Deployment Model, 2015�2022 (USD Million)
Table 25 On-Premises: Market Size, By Region, 2015�2022 (USD Million)
Table 26 On-Demand: Market Size, By Region, 2015�2022 (USD Million)
Table 27 Data Quality Tools Market Size By Organization Size, 2015�2022 (USD Million)
Table 28 Large Enterprises: Market Size, By Region, 2015�2022 (USD Million)
Table 29 Small and Medium-Sized Enterprises: Market Size, By Region, 2015�2022 (USD Million)
Table 30 Data Quality Tools Market Size By Vertical, 2015�2022 (USD Million)
Table 31 Banking, Financial Services, and Insurance: Market Size, By Region, 2015�2022 (USD Million)
Table 32 Telecommunications and IT: Market Size, By Region, 2015�2022 (USD Million)
Table 33 Retail and Ecommerce: Market Size, By Region, 2015�2022 (USD Million)
Table 34 Healthcare and Life Sciences: Market Size, By Region, 2015�2022 (USD Million)
Table 35 Manufacturing: Market Size, By Region, 2015�2022 (USD Million)
Table 36 Government: Market Size, By Region, 2015�2022 (USD Million)
Table 37 Energy and Utilities: Market Size, By Region, 2015�2022 (USD Million)
Table 38 Media and Entertainment: Market Size, By Region, 2015�2022 (USD Million)
Table 39 Others: Market Size, By Region, 2015�2022 (USD Million)
Table 40 Data Quality Tools Market Size By Region, 2015�2022 (USD Billion)
Table 41 North America: Market Size By Vertical, 2015�2022 (USD Million)
Table 42 North America: Market Size By Component, 2015�2022 (USD Million)
Table 43 North America: Market Size By Service, 2015�2022 (USD Million)
Table 44 North America: Market Size By Data Type, 2015�2022 (USD Million)
Table 45 North America: Market Size By Business Function, 2015�2022 (USD Million)
Table 46 North America: Market Size By Deployment Model, 2015�2022 (USD Million)
Table 47 North America: Market Size By Organization Size, 2015�2022 (USD Million)
Table 48 Europe: Data Quality Tools Market Size By Vertical, 2015�2022 (USD Million)
Table 49 Europe: Market Size By Component, 2015�2022 (USD Million)
Table 50 Europe: Market Size By Service, 2015�2022 (USD Million)
Table 51 Europe: Market Size By Data Type, 2015�2022 (USD Million)
Table 52 Europe: Market Size By Business Function, 2015�2022 (USD Million)
Table 53 Europe: Market Size By Deployment Model, 2015�2022 (USD Million)
Table 54 Europe: Market Size By Organization Size , 2015�2022 (USD Million)
Table 55 Asia Pacific: Data Quality Tools Market Size By Vertical, 2015�2022 (USD Million)
Table 56 Asia Pacific: Market Size By Component, 2015�2022 (USD Million)
Table 57 Asia Pacific: Market Size By Service, 2015�2022 (USD Million)
Table 58 Asia Pacific: Market Size By Data Type, 2015�2022 (USD Million)
Table 59 Asia Pacific: Market Size By Business Function, 2015�2022 (USD Million)
Table 60 Asia Pacific: Market Size By Deployment Model, 2015�2022 (USD Million)
Table 61 Asia Pacific: Market Size By Organization Size , 2015�2022 (USD Million)
Table 62 Middle East and Africa: Data Quality Tools Market Size By Vertical, 2015�2022 (USD Million)
Table 63 Middle East and Africa: Market Size By Component, 2015�2022 (USD Million)
Table 64 Middle East and Africa: Market Size By Service, 2015�2022 (USD Million)
Table 65 Middle East and Africa: Market Size By Business Function, 2015�2022 (USD Million)
Table 67 Middle East and Africa: Market Size By Deployment Model, 2015�2022 (USD Million)
Table 68 Middle East and Africa: Market Size By Organization Size , 2015�2022 (USD Million)
Table 69 Latin America: Data Quality Tools Market Size By Vertical, 2015�2022 (USD Million)
Table 70 Latin America: Market Size By Component, 2015�2022 (USD Million)
Table 71 Latin America: Market Size By Service, 2015�2022 (USD Million)
Table 72 Latin America: Market Size By Data Type, 2015�2022 (USD Million)
Table 73 Latin America: Market Size By Business Function, 2015�2022 (USD Million)
Table 74 Latin America: Market Size By Deployment Model, 2015�2022 (USD Million)
Table 75 Latin America: Market Size By Organization Size , 2015�2022 (USD Million)
Table 76 Market Ranking for the Data Quality Tools Market, 2017
List of Figures (39 Figures)
Figure 1 Data Quality Tools Market Segmentation
Figure 2 Regional Scope
Figure 3 Data Quality Tools Market: Research Design
Figure 4 Breakdown of Primary Interviews: By Company, Designation, and Region
Figure 5 Data Triangulation
Figure 6 Market Size Estimation Methodology: Bottom-Up Approach
Figure 7 Market Size Estimation Methodology: Top-Down Approach
Figure 8 Data Quality Tools Market: Assumptions
Figure 9 Market: Evolution
Figure 10 Market is Expected to Witness A Significant Growth During the Forecast Period
Figure 11 Market Snapshot, By Data Type (2017�2022)
Figure 12 Market Snapshot, By Business Function (2017�2022)
Figure 13 Market Snapshot, By Component (2017 vs 2022)
Figure 14 Market Snapshot, By Deployment Model (2017�2022)
Figure 15 Market Snapshot, By Organization Size (2017�2022)
Figure 16 Market Snapshot, By Vertical (2017 vs 2022)
Figure 17 Increasing Volume of Business Data is Expected to Drive the Market During the Forecast Period
Figure 18 North America is Expected to Dominate the Global Market in 2017
Figure 19 Banking, Financial Services, and Insurance, and North America are Expected to Have the Largest Market Share in 2017
Figure 20 Asia Pacific is Expected to Enter the Exponential Growth Phase During the Forecast Period
Figure 21 Data Quality Tools Market: Drivers, Restraints, Opportunities, and Challenges
Figure 22 Compliance Data Type is Expected to Have the Largest Market Size During the Forecast Period
Figure 23 Finance Business Function is Expected to Have the Largest Market Size in 2017
Figure 24 Software Component is Estimated to Have the Larger Market Size in 2017
Figure 25 On-Premises Deployment Model is Expected to Have the Larger Market Size During the Forecast Period
Figure 26 Large Enterprises Segment is Expected to Have the Larger Market Size During the Forecast Period
Figure 27 Banking, Financial Services, and Insurance Vertical is Expected to Have the Largest Market Size During the Forecast Period
Figure 28 North America is Expected to Have the Largest Market Size in the Market During the Forecast Period
Figure 29 North America: Market Snapshot
Figure 30 Asia Pacific: Market Snapshot
Figure 31 Data Quality Tools Market (Global), Competitive Leadership Mapping, 2017
Figure 32 International Business Machines Corporation: Company Snapshot
Figure 33 Oracle Corporation: Company Snapshot
Figure 34 SAP SE: Company Snapshot
Figure 35 SAS Institute Inc.: Company Snapshot
Figure 36 Talend: Company Snapshot
Figure 37 Experian PLC: Company Snapshot
Figure 38 Microsoft Corporation: Company Snapshot
Figure 39 Pitney Bowes Inc.: Company Snapshot


Growth opportunities and latent adjacency in Data Quality Tools Market