Methacrylate Monomers Market by Derivative (Methyl, Butyl, Ethyl), Application (Acrylic Sheets, Molding, Paints & Coatings, Additives), End-Use Industry (Automotive, Architetcure & Construction, Electronics), and Region - Global Forecast to 2022


[140 Pages Report] Methacrylate Monomers Market size was valued at USD 8.45 Billion in 2016 and is projected to reach USD 11.26 Billion by 2022, at a CAGR of 4.9% in terms of value. In this study, 2015 has been considered as the historic year, 2016 as the base year, and 2017 to 2022 as the forecast period for estimating the size of the methacrylate monomers market.
Objectives of the Study:
- To analyze and forecast the methacrylate monomers market both in terms of volume and value
- To define, describe, and segment the methacrylate monomers market on the basis of derivative, application, and end-use industry
- To forecast the size of each market segment in five major regions, namely, North America, Europe, Asia Pacific, Middle East & Africa, and South America
- To provide detailed information regarding the key factors, such as drivers, restraints, opportunities, and challenges influencing the growth of the methacrylate monomers market
- To strategically analyze the segmented markets with respect to individual growth trends, prospects, and contribution to the overall methacrylate monomers market
- To identify and analyze opportunities for stakeholders in the methacrylate monomers market
- To analyze competitive developments, such as mergers & acquisitions, expansions, partnerships & collaborations, and new product launches in the methacrylate monomer market
- To strategically profile key players operating in the methacrylate monomer market and comprehensively analyze their core competencies
Research Methodology:
This study estimates the size of the methacrylate monomers market from the demand-side for 2017 and projects its size for 2022. It provides a detailed qualitative and quantitative analysis of the methacrylate monomer market. Various secondary sources, such as Hoovers, Bloomberg, Chemical Weekly, Factiva, Basic Acrylic Monomer Manufacturers, Inc. (BAMM), PubChem, Methacrylate Producers Association Inc., and other government and private websites have been used to identify and collect information useful for this extensive, commercial study of the methacrylate monomer market. Primary sources, such as experts from related industries and suppliers have been interviewed to obtain and verify critical information as well as assess to growth prospects of the methacrylate monomers market during the forecast period.
To know about the assumptions considered for the study, download the pdf brochure
Market Ecosystem:
The market ecosystem for methacrylate monomers starts with raw material manufacturers, comprising ammonia, methanol, benzene, ethylene, and butylene suppliers. These raw materials are procured by methacrylate monomer manufacturers. They manufacture different types of methacrylate monomers such as methyl methacrylate, butyl methacrylate, ethyl methacrylate, and other derivatives using raw materials and then sell them to surface coatings, acrylic resins, sheets, and molding compounds manufacturers.
Some of the major companies involved in the production of methacrylate monomers are Mitsubishi Chemical (Japan), Evonik (Germany), Dow Chemical (US), Sumitomo Chemical (Japan), LG Chem (South Korea), and Arkema (France), among others. These companies focus on increasing their regional presence by undertaking various growth strategies, such as agreements, expansions, joint ventures, and new product launches.
Key Target Audience:
- Manufacturers of Devices & Equipment
- Manufacturers of Methacrylic Acid, Methyl Methacrylate, and other Derivatives
- Traders and Distributors of Methacrylate Monomers
- Regional Manufacturers� Associations and General Methacrylate Monomers Associations
- Government and Regional Agencies and Research Organizations
Get online access to the report on the World's First Market Intelligence Cloud
Request Sample Scope of the Report
:

The methacrylate monomers market has been segmented as follows:
Methacrylate Monomers Market, By Derivative:
- Methyl Methacrylate
- Butyl Methacrylate
- Ethyl Methacrylate
- Others
Methacrylate Monomers Market, By Application:
- Acrylic Sheets
- Molding
- Paints and Coatings
- Additives
- Others
Methacrylate Monomers Market, By End-use Industry:
- Automotive
- Architecture & Construction
- Electronics
- Advertisement & Communication
- Others
Methacrylate Monomers Market, By Region:
- North America
- Europe
- Asia Pacific
- Middle East & Africa
- South America
Available Customizations:
With the given market data, MarketsandMarkets offers customizations according to the specific needs of companies. The following customization options are available for the report:
- Product Analysis
Product matrix that gives a detailed comparison of product portfolio of each company
- Regional Analysis
Further breakdown of the methacrylate monomers market in a particular region to country level
- Company Information
Detailed analysis and profiling of additional market players (up to five)
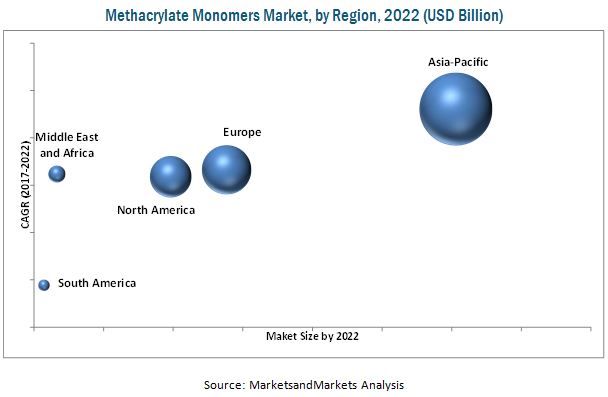
The global methacrylate monomers market is projected to grow from USD 8.85 Billion in 2017 to USD 11.26 Billion by 2022, at a CAGR of 4.9% in terms of value. The growth of the methacrylate monomer market is primarily driven by the huge demand from Asia Pacific and growth in end-use industries such as automotive, architecture & construction, and electronics. The regulations on the use of methacrylate monomer are likely to get flexible in the coming years as there are no direct substitutes available for the end-use industries. Therefore, these regulations are anticipated to have less impact on the growth of this market.
The methacrylate monomers market has been segmented on the basis of derivative, application, end-use industry, and region. Among applications, the molding segment is projected to grow at the highest CAGR during the forecast period. This is due to the increasing demand for acrylic resins in products such as instrument clusters and taillights for cars and trucks. Methacrylate monomers are polymerized into Polymethylmethacrylate (PMMA) in the form of pellets and beads, which are further molded into several end-use products. PMMA can be molded into knobs on the faucets of sinks, contact lenses, and lenses for sunglasses and eyeglasses. PMMA is also used as molds to make lenses used in airport landing lights and glasses for commercial buildings. Increase in the demand for PMMA-based molds by several end-use industries has augmented the growth of the methacrylate monomer market, globally.
On the basis of end-use industry, the methacrylate monomers market has been segmented into automotive, architecture and construction, electronics, advertisement and communication, and others. The automotive segment is projected to grow at the highest CAGR during the forecast period. This is due to the different requirements of manufacturers, such as reduced emissions of Volatile Organic Compounds (VOCs) by methacrylates that play a role in the formation of smog and to achieve durable protective surface coating on vehicles. Methacrylate monomers, such as Methyl Methacrylate (MMA) and butyl methacrylate, are widely used in the automotive industry. In addition, there is a huge demand for methacrylate monomers in other end-use industries such as architecture and construction (construction related materials), electronics (lighting equipment, LED and LCD displays), and advertisement and communication (signboards, displays).
The Asia Pacific, Europe, and North American regions are the major markets for methacrylate monomers. The Asia Pacific methacrylate monomers market is projected to grow at the highest CAGR during the forecast period. Many methacrylate monomers manufacturers are setting up or expanding their manufacturing bases in Asia Pacific to capitalize on the low manufacturing costs. The huge demand from signs & displays, architectural and construction, and automotive industries is driving the growth of the methacrylate monomer market in Asia Pacific. This growth is mainly attributed to the growth in population and economy of major countries such as China and India. China, India, South Korea, and Japan are the leading consumers of methacrylate monomers in the region.
Volatility in raw material costs poses a risk for methacrylate monomers manufacturers and is expected to bring down the profit margins. The methacrylate monomer market is also affected by the high transport costs driven by the rising fuel prices and high manufacturing costs resulting from the increasing energy costs.
Mitsubishi Chemical (Japan), Evonik (Germany), BASF (Germany), Dow Chemical (US), LG Chem (South Korea), Sumitomo Chemical (Japan), and Arkema (France), among others, are the leading companies operating in the market for methacrylate monomers. These companies are expected to account for significant shares of the methacrylate monomer market in the near future.
To speak to our analyst for a discussion on the above findings, click Speak to Analyst
Table of Contents
1 Introduction (Page No. - 15)
1.1 Objectives of the Study
1.2 Market Definition
1.3 Market Scope
1.3.1 Years Considered for the Study
1.4 Currency
1.5 Unit Considered
1.6 Stakeholders
2 Research Methodology (Page No. - 18)
2.1 Research Data
2.1.1 Secondary Data
2.1.1.1 Key Data From Secondary Sources
2.1.2 Primary Data
2.1.2.1 Key Data From Primary Sources
2.1.2.2 Key Industry Insights
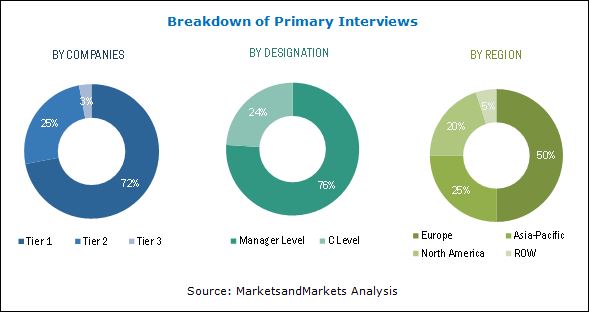
2.1.2.3 Breakdown of Primary Interviews
2.2 Market Size Estimation
2.2.1 Bottom-Up Approach
2.2.2 Top-Down Approach
2.3 Market Data Triangulation
2.4 Assumptions
2.5 Limitations
3 Executive Summary (Page No. - 27)
4 Premium Insights (Page No. - 31)
4.1 Attractive Opportunities in the Methacrylate Monomers Market
4.2 Methacrylate Monomer Market, By Region
4.3 Methacrylate Monomers Market, By Country and Application
4.4 Methacrylate Monomer Market Share, By Region, 2016
4.5 Methacrylate Monomers Market, By Application
5 Market Overview (Page No. - 34)
5.1 Introduction
5.1.1 Drivers
5.1.1.1 Growing Demand for Methacrylate Monomers in Manufacturing LCD and LED Flat Screens
5.1.1.2 High R&D Activity By Methacrylate Monomers Manufacturers
5.1.1.3 Increasing Demand for Methacrylate Monomers in Automotive, Architectural and Construction, Solar, Other End-Use Industries
5.1.2 Restraints
5.1.2.1 Volatility in Raw Material Prices
5.1.3 Opportunities
5.1.3.1 Bio-Based Methacrylate Monomers
5.1.3.2 Commissioning of the World�s Largest Methacrylate Monomers Plant in Saudi Arabia
5.1.4 Challenges
5.1.4.1 Significant Reduction in the Import of Methacrylate Monomers in Europe and the Middle East & Africa
5.2 Porter�s Five Forces Analysis
5.2.1 Threat of New Entrants
5.2.2 Bargaining Power of Suppliers
5.2.3 Threat of Substitutes
5.2.4 Bargaining Power of Buyers
5.2.5 Intensity of Rivalry
5.3 Macroeconomic Overview and Key Drivers
5.3.1 Trends and Forecast of GDP
5.4 Automotive Industry and Economic Outlook
6 Methacrylate Monomers Market, By Derivatives (Page No. - 42)
6.1 Introduction
6.2 Methyl Methacrylate
6.3 Butyl Methacrylate
6.4 Ethyl Methacrylate
6.5 2-Hydroxyethyl Methacrylate
6.6 Allyl Methacrylate
6.7 Glycidyl Methacrylate
6.8 Cyclohexyl Methacrylate
6.9 Stearyl Methacrylate
6.10 Lauryl Methacrylate
7 Methacrylate Monomers Market, By Application (Page No. - 44)
7.1 Introduction
7.2 Acrylic Sheets
7.2.1 Extruded Sheets
7.2.2 Cell Cast and Blocks
7.3 Molding
7.4 Paints & Coatings
7.5 Additives
7.6 Others
8 Methacrylate Monomers Market, By End-Use Industry (Page No. - 52)
8.1 Introduction
8.2 Automotive
8.3 Architecture & Construction
8.4 Electronics
8.5 Advertisement & Communication
8.6 Others
9 Methacrylate Monomers Market, By Region (Page No. - 60)
9.1 Introduction
9.2 North America
9.2.1 US.
9.2.2 Canada
9.2.3 Mexico
9.3 Europe
9.3.1 Germany
9.3.2 Spain
9.3.3 Italy
9.3.4 France
9.3.5 U.K.
9.3.6 Netherlands
9.3.7 Sweden
9.3.8 Rest of Europe
9.4 Asia-Pacific
9.4.1 China
9.4.2 Japan
9.4.3 South Korea
9.4.4 India
9.4.5 Taiwan
9.4.6 Indonesia
9.4.7 Rest of Asia-Pacific
9.5 Middle East & Africa
9.5.1 Saudi Arabia
9.5.2 Egypt
9.5.3 UAE
9.5.4 Rest of Middle East & Africa
9.6 South America
9.6.1 Brazil
9.6.2 Argentina
9.6.3 Rest of South America
10 Competitive Landscape (Page No. - 103)
10.1 Introduction
10.2 Market Share Analysis
10.3 Competitive Scenario
10.3.1 Agreements
10.3.2 Expansions
11 Company Profiles (Page No. - 107)
Business Overview, Products Offered, Recent Developments, SWOT Analysis, MnM View
11.1 Mitsubishi Chemical
11.2 Evonik Industries
11.3 The DOW Chemical Company
11.4 Sumitomo Chemical
11.5 LG Chem
11.6 Arkema
11.7 BASF
11.8 Eastman Chemical Company
11.9 Nippon Shokubai
*Details Might Not Be Captured in Case of Unlisted Companies.
11.10 Other Key Players
11.10.1 Estron Chemical
11.10.2 Esstech
11.10.3 Miwon Specialty Chemical
11.10.4 Fushun Anxin Chemical
11.10.5 Gelest
11.10.6 Kuraray
11.10.7 Chi Mei Corporation
11.10.8 Gantrade Corporation
11.10.9 Ted Pella
11.10.10 Asahi Kasei
11.10.11 Hitachi Chemical
11.10.12 Gujarat State Fertilizers and Chemicals
12 Appendix (Page No. - 132)
12.1 Insights From Industry Experts
12.2 Discussion Guide
12.3 Knowledge Store: Marketsandmarkets� Subscription Portal
12.4 Introducing RT: Real-Time Market Intelligence
12.5 Available RT Snapshot
12.6 Related Reports
12.7 Author Details
List of Tables (110 Tables)
Table 1 Methacrylate Monomers Market to Register High Growth Between 2017 and 2022
Table 2 Methacrylate Monomers Market Trends and Forecast of GDP Growth, (2017�2022)
Table 3 Market Size, By Application, 2015�2022 (Kiloton)
Table 4 Market Size, By Application, 2015�2022 (USD Million)
Table 5 Market Size in Acrylic Sheets Application, By Region, 2015�2022 (Kiloton)
Table 6 Market Size in Acrylic Sheets Application, By Region, 2015�2022 (USD Million)
Table 7 Market Size in Molding Application, By Region, 2015�2022 (Kiloton)
Table 8 Market Size in Molding Application, By Region, 2015�2022 (USD Million)
Table 9 Market Size in Paints & Coatings Application, By Region, 2015�2022 (Kiloton)
Table 10 Market Size in Paints & Coatings Application, By Region, 2015�2022 (USD Million)
Table 11 Market Size in Additives Application, By Region, 2015�2022 (Kiloton)
Table 12 Market Size in Additives Application, By Region, 2015�2022 (USD Million)
Table 13 Market Size in Other Applications, By Region, 2015�2022 (Kiloton)
Table 14 Market Size in Other Applications, By Region, 2015�2022 (USD Million)
Table 15 Market Size, By End-Use Industry, 2015�2022 (Kiloton)
Table 16 Market Size, By End-Use Industry, 2015�2022 (USD Million)
Table 17 Market Size in Automotive Industry, By Region, 2015�2022 (Kiloton)
Table 18 Market Size in Automotive Industry, By Region, 2015�2022 (USD Million)
Table 19 Market Size in Architecture & Construction Industry, By Region, 2015�2022 (Kiloton)
Table 20 Market Size in Architecture & Construction Industry, By Region, 2015�2022 (USD Million)
Table 21 By Market Size in Electronic Industry, By Region, 2015�2022 (Kiloton)
Table 22 By Market Size in Electronic Industry, By Region, 2015�2022 (USD Million)
Table 23 By Market Size in Advertisement & Communication Industry, By Region, 2015�2022 (Kiloton)
Table 24 By Market Size in Advertisement & Communication Industry, By Region, 2015�2022 (USD Million)
Table 25 By Market Size in Other Industries, By Region, 2015�2022 (Kiloton)
Table 26 By Market Size in Other Industries, By Region, 2015�2022 (USD Million)
Table 27 By Market Size, By Region, 2015�2022 (Kiloton)
Table 28 By Market Size, By Region, 2015�2022 (USD Million)
Table 29 North America: By Market Size, By Country, 2015�2022 (Kiloton)
Table 30 North America: By Market Size, By Country, 2015�2022 (USD Million)
Table 31 North America: By Market Size, By Application, 2015�2022 (Kiloton)
Table 32 North America: By Market Size, By Application, 2015�2022 (USD Million)
Table 33 North America: By Market Size, By End-Use Industry, 2015�2022 (Kiloton)
Table 34 North America: By Market Size, By End-Use Industry, 2015�2022 (USD Million)
Table 35 U.S.: By Market Size, By End-Use Industry, 2015�2022 (Kiloton)
Table 36 U.S.: By Market Size, By End-Use Industry, 2015�2022 (USD Million)
Table 37 Canada: By Market Size, By End-Use Industry, 2015�2022 (Kiloton)
Table 38 Canada: By Market Size, By End-Use Industry, 2015�2022 (USD Million)
Table 39 Mexico: By Market Size, By End-Use Industry, 2015�2022 (Kiloton)
Table 40 Mexico: By Market Size, By End-Use Industry, 2015�2022 (USD Million)
Table 41 Europe: By Market Size, By Country, 2015�2022 (Kiloton)
Table 42 Europe: By Market Size, By Country, 2015�2022 (USD Million)
Table 43 Europe: By Market Size, By Application, 2014�2022 (Kiloton)
Table 44 Europe: By Market Size, By Application, 2014�2022 (USD Million)
Table 45 Europe: By Market Size, By End-Use Industry, 2015�2022 (Kiloton)
Table 46 Europe: By Market Size, By End-Use Industry, 2015�2022 (USD Million)
Table 47 Germany: By Market Size, By End-Use Industry, 2015�2022 (Kiloton)
Table 48 Germany: By Market Size, By End-Use Industry, 2015�2022 (USD Million)
Table 49 Spain: By Market Size, By End-Use Industry, 2015�2022 (Kiloton)
Table 50 Spain: By Market Size, By End-Use Industry, 2015�2022 (USD Million)
Table 51 Italy: By Market Size, By End-Use Industry, 2015�2022 (Kiloton)
Table 52 Italy: By Market Size, By End-Use Industry, 2015�2022 (USD Million)
Table 53 France: By Market Size, By End-Use Industry, 2015�2022 (Kiloton)
Table 54 France: By Market Size, By End-Use Industry, 2015�2022 (USD Million)
Table 55 U.K.: By Market Size, By End-Use Industry, 2015�2022 (Kiloton)
Table 56 U.K.: By Market Size, By End-Use Industry, 2015�2022 (USD Million)
Table 57 Netherlands: By Market Size, By End-Use Industry, 2015�2022 (Kiloton)
Table 58 Netherlands: By Market Size, By End-Use Industry, 2015�2022 (USD Million)
Table 59 Sweden: By Market Size, By End-Use Industry, 2015�2022 (Kiloton)
Table 60 Sweden: By Market Size, By End-Use Industry, 2015�2022 (USD Million)
Table 61 Rest of Europe: By Market Size, By End-Use Industry, 2015�2022 (Kiloton)
Table 62 Rest of Europe: By Market Size, By End-Use Industry, 2015�2022 (USD Million)
Table 63 Asia-Pacific: By Market Size, By Country, 2015�2022 (Kiloton)
Table 64 Asia-Pacific: By Market Size, By Country, 2015�2022 (USD Million)
Table 65 Asia-Pacific: By Market Size, By Application, 2015�2022 (Kiloton)
Table 66 Asia-Pacific: By Market Size, By Application, 20152022 (USD Million)
Table 67 Asia-Pacific: By Market Size, By End-Use Industry, 2015�2022 (Kiloton)
Table 68 Asia-Pacific: By Market Size, By End-Use Industry, 2015�2022 (USD Million)
Table 69 China: By Market Size, By End-Use Industry, 2015�2022 (Kiloton)
Table 70 China: By Market Size, By End-Use Industry, 2015�2022 (USD Million)
Table 71 Japan: By Market Size, By End-Use Industry, 2015�2022 (Kiloton)
Table 72 Japan: By Market Size, By End-Use Industry, 2015�2022 (USD Million)
Table 73 South Korea: By Market Size, By End-Use Industry, 2015�2022 (Kiloton)
Table 74 South Korea: By Market Size, By End-Use Industry, 2015�2022 (USD Million)
Table 75 India: By Market Size, By End-Use Industry, 2015�2022 (Kiloton)
Table 76 India: By Market Size, By End-Use Industry, 2015�2022 (USD Million)
Table 77 Taiwan: By Market Size, By End-Use Industry, 2015�2022 (Kiloton)
Table 78 Taiwan: By Market Size, By End-Use Industry, 2015�2022 (USD Million)
Table 79 Indonesia: By Market Size, By End-Use Industry, 2015�2022 (Kiloton)
Table 80 Indonesia: By Market Size, By End-Use Industry, 2015�2022 (USD Million)
Table 81 Rest of Asia-Pacific: By Market Size, By End-Use Industry, 2015�2022 (Kiloton)
Table 82 Rest of Asia-Pacific: By Market Size, By End-Use Industry, 2015�2022 (USD Million)
Table 83 Middle East & Africa: By Market Size, By Country, 2015�2022 (Kiloton)
Table 84 Middle East and Africa: By Market Size, By Country, 2015�2022 (USD Million)
Table 85 Middle East and Africa: By Market Size, By Application, 2015�2022 (Kiloton)
Table 86 Middle East and Africa: By Market Size, By Application, 2015�2022 (USD Million)
Table 87 Middle East and Africa: By Market Size, By End-Use Industry, 2015�2022 (Kiloton)
Table 88 Middle East and Africa: By Market Size, By End-Use Industry, 2015�2022 (USD Million)
Table 89 Saudi Arabia: By Market Size, By End-Use Industry, 2015�2022 (Kiloton)
Table 90 Saudi Arabia: By Market Size, By End-Use Industry, 2015�2022 (USD Million)
Table 91 Egypt: By Market Size, By End-Use Industry, 2015�2022 (Kiloton)
Table 92 Egypt: By Market Size, By End-Use Industry, 2015�2022 (USD Million)
Table 93 UAE: By Market Size, By End-Use Industry, 2015�2022 (Kiloton)
Table 94 UAE: By Market Size, By End-Use Industry, 2015�2022 (USD Million)
Table 95 Rest of Middle East & Africa: By Market Size, By End-Use Industry, 2015�2022 (Kiloton)
Table 96 Rest of Middle East & Africa: By Market Size, By End-Use Industry, 2015�2022 (USD Million)
Table 97 South America: By Market Size, By Country, 2015�2022 (Kiloton)
Table 98 South America: By Market Size, By Country, 2015�2022 (USD Million)
Table 99 South America: By Market Size, By Application, 2015�2022 (Kiloton)
Table 100 South America: By Market Size, By Application, 2015�2022 (USD Million)
Table 101 South America: By Market Size, By End-Use Industry, 2015�2022 (Kiloton)
Table 102 South America: By Market Size, By End-Use Industry, 2015�2022 (USD Million)
Table 103 Brazil: By Market Size, By End-Use Industry, 2015�2022 (Kiloton)
Table 104 Brazil: By Market Size, By End-Use Industry, 2015�2022 (USD Million)
Table 105 Argentina: By Market Size, By End-Use Industry, 2015�2022 (Kiloton)
Table 106 Argentina: By Market Size, By End-Use Industry, 2015�2022 (USD Million)
Table 107 Rest of South America: By Market Size, By End-Use Industry, 2015�2022 (Kiloton)
Table 108 Rest of South America: By Market Size, By End-Use Industry, 2015�2022 (USD Million)
Table 109 Agreements, 2014�2017
Table 110 Expansions, 2014�2017
List of Figures (34 Figures)
Figure 1 Methacrylate Monomers Market: Research Design
Figure 2 Data Triangulation: Methacrylate Monomer Market
Figure 3 The Molding Segment to Register the Highest Growth Between 2017 and 2022
Figure 4 The Electronics Segment to Register the Highest Growth Between 2017 and 2022
Figure 5 Asia-Pacific Dominated the Market in 2016
Figure 6 Demand From End-Use Industries to Drive Methacrylate Monomer Market During the Forecast Period
Figure 7 Asia-Pacific to Register the Highest Growth Rate
Figure 8 China Accounted for the Largest Share of the Market in 2016
Figure 9 US Accounted for the Second-Largest Share in the Methacrylate Monomer Market
Figure 10 The Molding Segment Accounted for the Largest Share in the Market
Figure 11 Factors Governing the Methacrylate Monomer Market
Figure 12 Fluctuations in the Price of Crude Oil Between 2013 and 2017
Figure 13 The Molding Segment to Dominate the Market Between 2017 and 2022
Figure 14 The Automotive Segment to Dominate the Methacrylate Monomer Market Between 2017 and 2022
Figure 15 China and India to Register Highest Growth in Market During Forecast Period
Figure 16 North America Methacrylate Monomer Market Snapshot : US to Continue Leading North America Market
Figure 17 Asia-Pacific Methacrylate Monomer Market Snapshot : China to Continue Leading Asia-Pacific Market
Figure 18 Agreements Was the Most Preferred Growth Strategy of the Key Players Between 2014 and 2016
Figure 19 Market Share Analysis of Major Players in 2016
Figure 20 Agreements Were the Most Adopted Strategy Between 2014 and 2017
Figure 21 Mitsubishi Chemical: Company Snapshot
Figure 22 Evonik Industries: Company Snapshot
Figure 23 Evonik Industries: SWOT Analysis
Figure 24 The DOW Chemical Company: Company Snapshot
Figure 25 DOW Chemical: SWOT Analysis
Figure 26 Sumitomo Chemical: Company Snapshot
Figure 27 LG Chem: Company Snapshot
Figure 28 Arkema: Company Snapshot
Figure 29 Arkema: SWOT Analysis
Figure 30 BASF : Company Snapshot
Figure 31 BASF SE: SWOT Analysis
Figure 32 Eastman Chemical Company: Company Snapshot
Figure 33 Nippon Shokubai: Company Snapshot
Figure 34 BASF SE: SWOT Analysis


Growth opportunities and latent adjacency in Methacrylate Monomers Market