Ammunition Handling System Market by Platform (Land, Airborne, Naval), Weapon Type (Cannons, Gatling Guns, Machine Guns, Main Guns, Launchers), Feeding Mechanism (Linked, Linkless), Component, Mode of Operation, and Region - Global Forecast to 2022


[177 Pages Report] The ammunition handling system market was valued at USD 2.11 Billion in 2016 and is projected to reach USD 3.50 Billion by 2022, at a CAGR of 8.75% from 2017 to 2022. This report provides a forecast of the ammunition handling system market over the next 5 years while recognizing market application gaps, recent developments, and high potential countries. The ammunition handling system market has been segmented on the basis of platform (land, naval, and airborne), mode of operation (automatic and semi-automatic), component (loading systems, drive assembly, ammunition storage units, auxiliary power units, and others), weapon type (cannons, Gatling guns, machine guns, main guns, and launchers), feeding mechanism (linked and linkless), and region (North America, Europe, Asia Pacific, Middle East, and RoW). The base year considered for the study is 2016 and the forecast period is from 2017 to 2022.
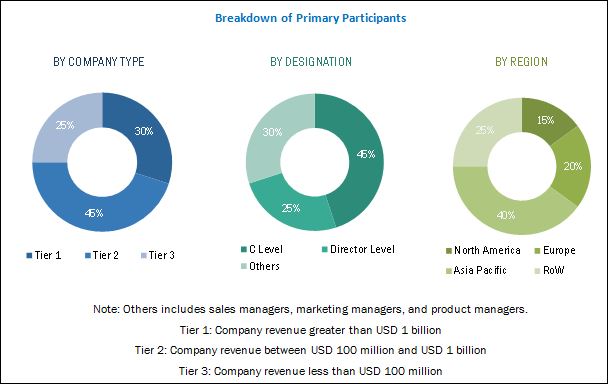
The research methodology used to estimate and forecast the ammunition handling system market began with capturing data on key ammunition handling systems through secondary sources, such as the US Department of Defense (DoD), the US Air Force website, company websites, and corporate filings that include annual reports, investor presentations, and paid databases. Different types of ammunition handling systems were taken into consideration to determine the market segmentation. The bottom-up procedure was employed to arrive at the overall size of the ammunition handling system market by estimating the revenue of key players in the market. After arriving at the overall market size, the total market was split into several segments and subsegments, which were then verified through primary research by conducting extensive interviews with key experts, such as chief executive officers, vice presidents, directors, and executives of leading companies in the ammunition handling system market. Data triangulation and market breakdown procedures were employed to complete the overall market engineering process and arrive at the exact statistics for all segments and subsegments of the ammunition handling system market. The breakdown of profiles of primaries was depicted in the figure given below:
To know about the assumptions considered for the study, download the pdf brochure
The ecosystem of the ammunition handling system market comprises OEMs, integrators, and end users. The defense sector is a major end user of the market. Technology providers in the ammunition handling system market are Curtiss-Wright (US), Nobles Worldwide (US), McNally Industries (US), and GSI International (US).
�The study answers several questions for stakeholders, primarily, which segments to focus on over the next five years for prioritizing efforts and investments.�
Target Audience
- Original Equipment Manufacturers (OEMs)
- Component Suppliers
- Military Organizations
- Upgradation Service Providers
Scope of the report:
This research report categorizes the ammunition handling system market into the following segments and subsegments:
Ammunition Handling System Market, By Platform
- Land
- Artillery
- Howitzer
- Mortar
- Infantry
- Tanks
- Infantry Fighting Vehicles (IFVs)
- Armored Personnel Carriers (APCs)
- Mine Resistant Ambush Protected (MRAP)
- Others
- Air Defense Platform
- Unmanned Ground Vehicles (UGVs)
- Handheld
- Artillery
- Naval
- Carrier Battle Ground Ships
- Frigates
- Corvettes
- Destroyers
- Coastal/Littoral Ships
- Offshore Patrol Vessel (OPVs)
- Unmanned Surface Vehicles (USVs)
- Carrier Battle Ground Ships
- Airborne
- Fighter Aircraft
- Helicopters
- Combat Support Aircraft
- Unmanned Aerial Vehicles (UAVs)
Ammunition Handling System Market, By Weapon Type
- Cannons
- Automatic
- Semi-automatic
- Gatling Guns
- Automatic
- Semi-automatic
- Machine Guns
- Automatic
- Semi-automatic
- Main Guns
- Automatic
- Semi-automatic
- Launchers
- Automatic
- Semi-automatic
Ammunition Handling System Market, By Component
- Loading Systems
- Drive Assembly
- Ammunition Storage Units
- Auxiliary Power Units
- Others
Ammunition Handling System Market, By Feeding Mechanism
- Linked
- Linkless
Ammunition Handling System Market, By Mode of Operation
- Automatic
- Semi-automatic
Ammunition Handling System Market, By Region
- North America
- US
- Canada
- Europe
- UK
- France
- Germany
- Russia
- Rest of Europe
- Asia Pacific
- India
- China
- Japan
- South Korea
- Rest of Asia Pacific
- Middle East
- Turkey
- Israel
- Saudi Arabia
- Rest of Middle East
- Rest of the World
- Africa
- Latin America
Customizations available for the report
Along with the market data, MarketsandMarkets offers customizations as per the specific needs of a company. The following customization options are available for the report:
- Country-level Analysis
- Comprehensive market projections for countries covered under North America, Europe, Asia Pacific, the Middle East, and the Rest of the World (RoW)
- Country-level analysis of weapon type, feeding mechanism and platform segments and their subsegments
- Company Information
- Detailed analysis and profiling of additional market players
The ammunition handling system market is projected to grow from USD 2.30 Billion in 2017 to USD 3.50 Billion by 2022, at a CAGR of 8.75% during the forecast period. The increasing demand for remote weapon stations and gun turret systems from military forces worldwide, overhauling of the existing warfare platforms, and increasing military modernization programs in various countries across the globe are key factors expected to drive the growth of the ammunition handling system market during the forecast period.
Based on platform, the ammunition handling system market has been segmented into land, naval, and airborne. The land platform segment of the ammunition handling systems market is projected to grow at the highest CAGR during the forecast period. This growth can be attributed to the increased adoption of land warfare vehicles, such as tanks, Armored Personnel Carriers (APCs), Mine Resistant Ambush Protected (MRAP) vehicles, and Infantry Fighting Vehicles (IFVs). In addition, the demand for ammunition handling systems in the defense sector has increased considerably over the past few years, owing to the significant rise in manufacturing of linear linkless ammunition feed systems.
Based on weapon type, the machine guns segment is projected to lead the ammunition handling systems market from 2017 to 2022. However, the Gatling gun segment of the ammunition handling systems market is expected to grow at the highest CAGR during the forecast period. This growth can be attributed to the increased adoption of Gatling guns by military forces worldwide to carry out anti-air operations.
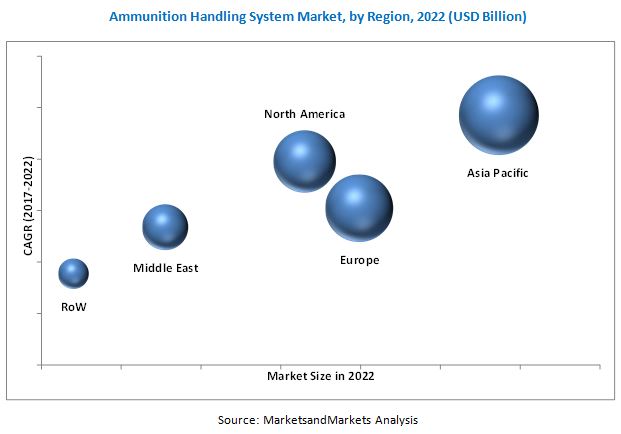
The ammunition handling systems market in the Asia Pacific region is expected to grow at the highest CAGR during the forecast period. The upgrade of warfare platforms by military forces of various countries in the Asia Pacific region is projected to drive the growth of the ammunition handling system market in this region. China, India, and South Korea are major countries investing in the procurement of ammunition handling systems and related technologies.
The high cost of composite linkless ammunition feed systems and integration of ammunition handling systems with a wide range of platforms are key challenges to the growth of the ammunition handling system market.
Key players operating in the ammunition handling systems market include Meggitt Defense Systems (US), General Dynamics (US), Nobles Worldwide (US), McNally Industries (US), Standard Armament (US), Curtiss-Wright (US), BAE Systems (UK), and Dillon Aero (US). Leading market players are focused on the adoption of contracts as their key growth strategy to strengthen their foothold in the ammunition handling system market.
To speak to our analyst for a discussion on the above findings, click Speak to Analyst
Table of Contents
1 Introduction (Page No. - 18)
1.1 Objectives of the Study
1.2 Market Definition
1.3 Study Scope
1.3.1 Markets Covered
1.3.2 Regional Scope
1.3.3 Years Considered for the Study
1.4 Currency & Pricing
1.5 Limitations
1.6 Market Stakeholders
2 Research Methodology (Page No. - 22)
2.1 Research Data
2.1.1 Secondary Data
2.1.1.1 Key Data From Secondary Sources
2.1.2 Primary Data
2.1.2.1 Key Data From Primary Sources
2.1.2.2 Breakdown of Primaries
2.2 Market Size Estimation
2.2.1 Bottom-Up Approach
2.2.2 Top-Down Approach
2.3 Market Breakdown & Data Triangulation
3 Executive Summary (Page No. - 31)
4 Premium Insights (Page No. - 35)
4.1 Attractive Opportunities in the Ammunition Handling Systems Market
4.2 Airborne Platform Market Size, By Type
4.3 Land Platform Market Size, By Type
4.4 Naval Platform Market Size, By Type
4.5 Ammunition Handling Systems Market Share, By Feeding Mechanism
4.6 Asia Pacific Ammunition Handling Systems Market Size, By Country and Component
5 Market Overview (Page No. - 39)
5.1 Introduction
5.2 Market Dynamics
5.2.1 Drivers
5.2.1.1 Increasing Demand for Ammunition Handling Systems for Military Applications Owing to the Rising Incidences of Conflicts
5.2.1.2 Enhancing Firepower of Gun Systems
5.2.1.3 Overhauling of Existing Warfare Platforms With Linkless Ammunition Handling Systems
5.2.2 Opportunities
5.2.2.1 Increasing Ammo Storage Capacity
5.2.2.2 Growing Demand for Remote Weapon Stations and Gun Turret Systems in Various Countries Across the Globe
5.2.3 Challenges
5.2.3.1 Integration of Ammunition Handling Systems With A Wide Range of Platforms
5.2.3.2 High Cost of Composite Linkless Ammunition Feed Systems
5.2.3.3 Occurrence of Mechanical Failures in Linked Ammunition Handling Systems
5.2.3.4 Complexities Involved in Ammunition Handling Systems for Naval Platforms
6 Industry Trends (Page No. - 44)
6.1 Introduction
6.2 Technology Trends
6.2.1 Programmable Ammunition
6.2.2 Linkless Feed System
6.2.3 Improved Load Carrying Capability
6.2.4 Composite Technology for Feed Chutes
6.2.5 Advanced Autoloaders
6.3 Innovation & Patent Registrations
7 Ammunition Handling System Market, By Platform (Page No. - 48)
7.1 Introduction
7.2 Land
7.2.1 Artillery
7.2.1.1 Howitzer
7.2.1.2 Mortar
7.2.2 Infantry
7.2.2.1 Tanks
7.2.2.2 Infantry Fighting Vehicles (IFVS)
7.2.2.3 Armored Personnel Carriers (APCS)
7.2.2.4 Mine-Resistant Ambush Protect (MRAPS)
7.2.3 Others
7.2.3.1 Air Defense Platforms
7.2.3.2 Handheld
7.2.3.3 Unmanned Ground Vehicles (UGVS)
7.3 Naval
7.3.1 Coastal/Littoral Ships
7.3.1.1 Offshore Patrol Vessels (OPV)
7.3.1.2 Unmanned Surface Vehicles
7.3.2 Carrier Battle Group (CVBG) Ships
7.3.2.1 Frigates
7.3.2.2 Corvettes
7.3.2.3 Destroyers
7.4 Airborne
7.4.1 Fighter Aircraft
7.4.2 Helicopters
7.4.3 Combat Support Aircraft
7.4.4 Unmanned Aerial Vehicles (UAVS)
8 Ammunition Handling System Market, By Weapon Type (Page No. - 58)
8.1 Introduction
8.2 Cannons
8.2.1 Automatic
8.2.2 Semi-Automatic
8.3 Gatling Guns
8.3.1 Automatic
8.3.2 Semi-Automatic
8.4 Main Guns
8.4.1 Automatic
8.4.2 Semi-Automatic
8.5 Machine Guns
8.5.1 Automatic
8.5.2 Semi-Automatic
8.6 Launchers
8.6.1 Automatic
8.6.2 Semi-Automatic
9 Ammunition Handling System Market, By Component (Page No. - 68)
9.1 Introduction
9.2 Loading Systems
9.2.1 Ammunition Hoist
9.2.2 Feeder
9.3 Drive Assembly
9.4 Ammunition Storage Units
9.5 Auxiliary Power Units (APU)
9.6 Others
10 Ammunition Handling System Market, By Feeding Mechanism (Page No. - 71)
10.1 Introduction
10.2 Linked
10.3 Linkless
11 Ammunition Handling System Market, By Mode of Operation (Page No. - 75)
11.1 Introduction
11.2 Automatic
11.3 Semi-Automatic
12 Ammunition Handling System Market, By Region (Page No. - 79)
12.1 Introduction
12.2 North America
12.2.1 US
12.2.2 Canada
12.3 Europe
12.3.1 Russia
12.3.2 Germany
12.3.3 UK
12.3.4 France
12.3.5 Rest of Europe
12.4 Asia Pacific
12.4.1 China
12.4.2 India
12.4.3 Japan
12.4.4 South Korea
12.4.5 Rest of Asia Pacific
12.5 Middle East
12.5.1 Saudi Arabia
12.5.2 Israel
12.5.3 Turkey
12.5.4 Rest of Middle East
12.6 Rest of the World (RoW)
12.6.1 Africa
12.6.2 Latin America
13 Competitive Landscape (Page No. - 139)
13.1 Overview
13.2 Ammunition Handling Systems Market Ranking Analysis, 2016
13.3 Competitive Situations and Trends
13.3.1 New Product Launches
13.3.2 Contracts
14 Company Profiles (Page No. - 144)
(Overview, Products and Services, Financials, Strategy & Development)*
14.1 Introduction
14.2 Meggitt
14.3 General Dynamics
14.4 Nobles Worldwide
14.5 Mcnally Industries
14.6 Curtiss-Wright
14.7 Standard Armament
14.8 Moog
14.9 BAE Systems
14.10 Thales Group
14.11 Calzoni
14.12 Dillon Aero
14.13 GSI International
*Details on Overview, Products and Services, Financials, Strategy & Development Might Not Be Captured in Case of Unlisted Companies
15 Appendix (Page No. - 169)
15.1 Discussion Guide
15.2 Knowledge Store: Marketsandmarkets� Subscription Portal
15.3 Introducing RT: Real-Time Market Intelligence
15.4 Available Customization
15.4.1 Country-Level Analysis
15.4.2 Additional Company Profiles (Up to 5)
15.5 Related Reports
15.6 Author Details
List of Tables (168 Tables)
Table 1 Procurement Plans for Remote Weapon Stations By Various Countries, 2013-2020
Table 2 Important Innovation & Patent Registrations, 2003-2014
Table 3 Ammunition Handling Systems Market Size, By Platform, 2015-2022 (USD Million)
Table 4 Land Platform, By Type, 2015-2022 (USD Million)
Table 5 Land Platform, By Region, 2015-2022 (USD Million)
Table 6 Artillery Segment, By Type, 2015-2022 (USD Million)
Table 7 Infantry Segment, By Type, 2015-2022 (USD Million)
Table 8 Others Segment, By Type, 2015-2022 (USD Million)
Table 9 Naval Platform, By Type, 2015-2022 (USD Million)
Table 10 Naval Platform, By Region, 2015-2022 (USD Million)
Table 11 Coastal/Littoral Ships Segment, By Type, 2015-2022 (USD Million)
Table 12 Carrier Battle Group Ships Segment, By Type, 2015-2022 (USD Million)
Table 13 Airborne Platform, By Type, 2015-2022 (USD Million)
Table 14 Airborne Platform, By Region, 2015-2022 (USD Million)
Table 15 Ammunition Handling Systems Market Size, By Weapon Type, 2015-2022 (USD Million)
Table 16 Cannons Segment, By Region, 2015-2022 (USD Million)
Table 17 Gatling Guns Segment, By Region, 2015-2022 (USD Million)
Table 18 Main Guns Segment, By Region, 2015-2022 (USD Million)
Table 19 Machine Guns Segment, By Region, 2015-2022 (USD Million)
Table 20 Launchers Segment, By Region, 2015-2022 (USD Million)
Table 21 Market Size, By Component, 2015-2022 (USD Million)
Table 22 Market Size, By Feeding Mechanism, 2015-2022 (USD Million)
Table 23 Linked Market Size, By Region, 2015-2022 (USD Million)
Table 24 Linkless Market Size, By Region, 2015-2022 (USD Million)
Table 25 Market Size, By Mode of Operation, 2015-2022 (USD Million)
Table 26 Automatic Market Size, By Region, 2017-2022 (USD Million)
Table 27 Semi-Automatic Market Size, By Region, 2017-2022 (USD Million)
Table 28 Market Size, By Region, 2015�2022 (USD Million)
Table 29 North America Market Size, By Platform, 2015�2022 (USD Million)
Table 30 North America Market Size for Land Segment, By Type, 2015�2022 (USD Million)
Table 31 North America Market Size for Artillery Segment, By Type, 2015�2022 (USD Million)
Table 32 North America Market Size for Infantry Segment, By Type, 2015�2022 (USD Million)
Table 33 North America Market Size for Naval Segment, By Type, 2015�2022 (USD Million)
Table 34 North America Market Size for Carrier Battle Group Segment, By Type, 2015�2022 (USD Million)
Table 35 North America Market Size for Coastal/Littoral Ships Segment, By Type, 2015�2022 (USD Million)
Table 36 North America Market Size for Airborne Segment, By Type, 2015�2022 (USD Million)
Table 37 North America Market Size, By Weapon Type, 2015�2022 (USD Million)
Table 38 North America Market Size, By Component, 2015�2022 (USD Million)
Table 39 North America Market Size, By Feeding Mechanism, 2015�2022 (USD Million)
Table 40 North America Market Size, By Mode of Operation, 2015�2022 (USD Million)
Table 41 North America Market Size, By Country, 2015-2022 (USD Million)
Table 42 US Market Size, By Platform, 2015�2022 (USD Million)
Table 43 US Market Size for Land Segment, By Type, 2015�2022 (USD Million)
Table 44 US Market Size for Naval Segment, By Type, 2015�2022 (USD Million)
Table 45 US Market Size, By Mode of Operation, 2015�2022 (USD Million)
Table 46 Canada Market Size, By Platform, 2015�2022 (USD Million)
Table 47 Canada Market Size for Land Segment, By Type, 2015�2022 (USD Million)
Table 48 Canada Market Size for Naval Segment, By Type, 2015�2022 (USD Million)
Table 49 Canada Market Size, By Mode of Operation, 2015�2022 (USD Million)
Table 50 Europe Market Size, By Platform, 2015�2022 (USD Million)
Table 51 Europe Market Size for Land Segment, By Type, 2015�2022 (USD Million)
Table 52 Europe Market Size for Artillery Segment, By Type, 2015�2022 (USD Million)
Table 53 Europe Market Size for Infantry Segment, By Type, 2015�2022 (USD Million)
Table 54 Europe Market Size for Naval Segment, By Type, 2015�2022 (USD Million)
Table 55 Europe Market Size for Carrier Battle Group Segment, By Type, 2015�2022 (USD Million)
Table 56 Europe Market Size for Coastal/Littoral Ships Segment, By Type, 2015�2022 (USD Million)
Table 57 Europe Market Size for Airborne Segment, By Type, 2015�2022 (USD Million)
Table 58 Europe Market Size, By Weapon Type, 2015�2022 (USD Million)
Table 59 Europe Market Size, By Component, 2015�2022 (USD Million)
Table 60 Europe Market Size, By Feeding Mechanism, 2015�2022 (USD Million)
Table 61 Europe Market Size, By Mode of Operation, 2015�2022 (USD Million)
Table 62 Europe Market Size, By Country, 2015-2022 (USD Million)
Table 63 Russia Market Size, By Platform, 2015�2022 (USD Million)
Table 64 Russia Market Size for Land Segment, By Type, 2015�2022 (USD Million)
Table 65 Russia Market Size for Naval Segment, By Type, 2015�2022 (USD Million)
Table 66 Russia Market Size, By Mode of Operation, 2015�2022 (USD Million)
Table 67 Germany Market Size, By Platform, 2015�2022 (USD Million)
Table 68 Germany Market Size for Land Segment, By Type, 2015�2022 (USD Million)
Table 69 Germany Market Size for Naval Segment, By Type, 2015�2022 (USD Million)
Table 70 Germany Market Size, By Mode of Operation, 2015�2022 (USD Million)
Table 71 UK Market Size, By Platform, 2015�2022 (USD Million)
Table 72 UK Market Size for Land Segment, By Type, 2015�2022 (USD Million)
Table 73 UK Market Size for Naval Segment, By Type, 2015�2022 (USD Million)
Table 74 UK Market Size, By Mode of Operation, 2015�2022 (USD Million)
Table 75 France Market Size, By Platform, 2015�2022 (USD Million)
Table 76 France Market Size for Land Segment, By Type, 2015�2022 (USD Million)
Table 77 France Market Size for Naval Segment, By Type, 2015�2022 (USD Million)
Table 78 France Market Size, By Mode of Operation, 2015�2022 (USD Million)
Table 79 Rest of Europe Market Size, By Platform, 2015�2022 (USD Million)
Table 80 Rest of Europe Market Size for Land Segment, By Type, 2015�2022 (USD Million)
Table 81 Rest of Europe Market Size for Naval Segment, By Type, 2015�2022 (USD Million)
Table 82 Rest of Europe Market Size, By Mode of Operation, 2015�2022 (USD Million)
Table 83 Asia Pacific Market Size, By Platform, 2015�2022 (USD Million)
Table 84 Asia Pacific Market Size for Land Segment, By Type, 2015�2022 (USD Million)
Table 85 Asia Pacific Market Size for Artillery Segment, By Type, 2015�2022 (USD Million)
Table 86 Asia Pacific Market Size for Infantry Segment, By Type, 2015�2022 (USD Million)
Table 87 Asia Pacific Market Size for Naval Segment, By Type, 2015�2022 (USD Million)
Table 88 Asia Pacific Market Size for Carrier Battle Group Segment, By Type, 2015�2022 (USD Million)
Table 89 Asia Pacific Market Size for Coastal/Littoral Ships Segment, By Type, 2015�2022 (USD Million)
Table 90 Asia Pacific Market Size for Airborne Segment, By Type, 2015�2022 (USD Million)
Table 91 Asia Pacific Market Size, By Weapon Type, 2015�2022 (USD Million)
Table 92 Asia Pacific Market Size, By Component, 2015�2022 (USD Million)
Table 93 Asia Pacific Market Size, By Feeding Mechanism, 2015�2022 (USD Million)
Table 94 Asia Pacific Ammunition Handling System industry Size, By Mode of Operation, 2015�2022 (USD Million)
Table 95 Asia Pacific Ammunition Handling System industry Size, By Country, 2015-2022 (USD Million)
Table 96 China Ammunition Handling System industry Size, By Platform, 2015�2022 (USD Million)
Table 97 China Ammunition Handling System industry Size for Land Segment, By Type, 2015�2022 (USD Million)
Table 98 China Ammunition Handling System industry Size for Naval Segment, By Type, 2015�2022 (USD Million)
Table 99 China Ammunition Handling System industry Size, By Mode of Operation, 2015�2022 (USD Million)
Table 100 India Ammunition Handling System industry Size, By Platform, 2015�2022 (USD Million)
Table 101 India Ammunition Handling System industry Size for Land Segment, By Type, 2015�2022 (USD Million)
Table 102 India Ammunition Handling System industry Size for Naval Segment, By Type, 2015�2022 (USD Million)
Table 103 India Ammunition Handling System industry Size, By Mode of Operation, 2015�2022 (USD Million)
Table 104 Japan Ammunition Handling System industry Size, By Platform, 2015�2022 (USD Million)
Table 105 Japan Ammunition Handling System industry Size for Land Segment, By Type, 2015�2022 (USD Million)
Table 106 Japan Ammunition Handling System industry Size for Naval Segment, By Type, 2015�2022 (USD Million)
Table 107 Japan Ammunition Handling System industry Size, By Mode of Operation, 2015�2022 (USD Million)
Table 108 South Korea Ammunition Handling System industry Size, By Platform, 2015�2022 (USD Million)
Table 109 South Korea Ammunition Handling System industry Size for Land Segment, By Type, 2015�2022 (USD Million)
Table 110 South Korea Ammunition Handling System industry Size for Naval Segment, By Type, 2015�2022 (USD Million)
Table 111 South Korea Ammunition Handling System industry Size, By Mode of Operation, 2015�2022 (USD Million)
Table 112 Rest of Asia Pacific Ammunition Handling System industry Size, By Platform, 2015�2022 (USD Million)
Table 113 Rest of Asia Pacific Ammunition Handling System industry Size for Land Segment, By Type, 2015�2022 (USD Million)
Table 114 Rest of Asia Pacific Ammunition Handling System industry Size for Naval Segment, By Type, 2015�2022 (USD Million)
Table 115 Rest of Asia Pacific Market Size, By Mode of Operation, 2015�2022 (USD Million)
Table 116 Middle East Market Size, By Platform, 2015�2022 (USD Million)
Table 117 Middle East Market Size for Land Segment, By Type, 2015�2022 (USD Million)
Table 118 Middle East Market Size for Artillery Segment, By Type, 2015�2022 (USD Million)
Table 119 Middle East Market Size for Infantry Segment, By Type, 2015�2022 (USD Million)
Table 120 Middle East Market Size for Naval Segment, By Type, 2015�2022 (USD Million)
Table 121 Middle East Market Size for Carrier Battle Group Segment, By Type, 2015�2022 (USD Million)
Table 122 Middle East Market Size for Coastal/Littoral Ships Segment, By Type, 2015�2022 (USD Million)
Table 123 Middle East Market Size for Airborne Segment, By Type, 2015�2022 (USD Million)
Table 124 Middle East Market Size, By Weapon Type, 2015�2022 (USD Million)
Table 125 Middle East Market Size, By Component, 2015�2022 (USD Million)
Table 126 Middle East Market Size, By Feeding Mechanism, 2015�2022 (USD Million)
Table 127 Middle East Market Size, By Mode of Operation, 2015�2022 (USD Million)
Table 128 Middle East Market Size, By Country, 2015-2022 (USD Million)
Table 129 Saudi Arabia Market Size, By Platform, 2015�2022 (USD Million)
Table 130 Saudi Arabia Market Size for Land Segment, By Type, 2015�2022 (USD Million)
Table 131 Saudi Arabia Market Size for Naval Segment, By Type, 2015�2022 (USD Million)
Table 132 Saudi Arabia Market Size, By Mode of Operation, 2015�2022 (USD Million)
Table 133 Israel Market Size, By Platform, 2015�2022 (USD Million)
Table 134 Israel Market Size for Land Segment, By Type, 2015�2022 (USD Million)
Table 135 Israel Market Size for Naval Segment, By Type, 2015�2022 (USD Million)
Table 136 Israel Market Size, By Mode of Operation, 2015�2022 (USD Million)
Table 137 Turkey Market Size, By Platform, 2015�2022 (USD Million)
Table 138 Turkey Market Size for Land Segment, By Type, 2015�2022 (USD Million)
Table 139 Turkey Market Size for Naval Segment, By Type, 2015�2022 (USD Million)
Table 140 Turkey Market Size, By Mode of Operation, 2015�2022 (USD Million)
Table 141 Rest of Middle East Market Size, By Platform, 2015�2022 (USD Million)
Table 142 Rest of Middle East Market Size for Land Segment, By Type, 2015�2022 (USD Million)
Table 143 Rest of Middle East Market Size for Naval Segment, By Type, 2015�2022 (USD Million)
Table 144 Rest of Middle East Market Size, By Mode of Operation, 2015�2022 (USD Million)
Table 145 Rest of the World Market Size, By Platform, 2015�2022 (USD Million)
Table 146 Rest of the World Market Size for Land Segment, By Type, 2015�2022 (USD Million)
Table 147 Rest of the World Market Size for Artillery Segment, By Type, 2015�2022 (USD Million)
Table 148 Rest of the World Market Size for Infantry Segment, By Type, 2015�2022 (USD Million)
Table 149 Rest of the World Market Size for Naval Segment, By Type, 2015�2022 (USD Million)
Table 150 Rest of the World Market Size for Carrier Battle Group Segment, By Type, 2015�2022 (USD Million)
Table 151 Rest of the World Market Size for Coastal/Littoral Ships Segment, By Type, 2015�2022 (USD Million)
Table 152 Rest of the World Ammunition Handling System industry Size for Airborne Segment, By Type, 2015�2022 (USD Million)
Table 153 Rest of the World Ammunition Handling System industry Size, By Weapon Type, 2015�2022 (USD Million)
Table 154 Rest of the World Ammunition Handling System industry Size, By Component, 2015�2022 (USD Million)
Table 155 Rest of the World Ammunition Handling System industry Size, By Feeding Mechanism, 2015�2022 (USD Million)
Table 156 Rest of the World Ammunition Handling System industry Size, By Mode of Operation, 2015�2022 (USD Million)
Table 157 Rest of the World Ammunition Handling System industry Size, By Region, 2015-2022 (USD Million)
Table 158 Africa Ammunition Handling System industry Size, By Platform, 2015�2022 (USD Million)
Table 159 Africa Ammunition Handling System industry Size for Land Segment, By Type, 2015�2022 (USD Million)
Table 160 Africa Ammunition Handling System industry Size for Naval Segment, By Type, 2015�2022 (USD Million)
Table 161 Africa Ammunition Handling System industry Size, By Mode of Operation, 2015�2022 (USD Million)
Table 162 Latin America Ammunition Handling System industry Size, By Platform, 2015�2022 (USD Million)
Table 163 Latin America Ammunition Handling System industry Size for Land Segment, By Type, 2015�2022 (USD Million)
Table 164 Latin America Ammunition Handling System industry Size for Naval Segment, By Type, 2015�2022 (USD Million)
Table 165 Latin America Ammunition Handling System industry Size, By Mode of Operation, 2015�2022 (USD Million)
Table 166 Rank Analysis of the Key Players in the Market in 2017
Table 167 New Product Launches, 2014-2017
Table 168 Contracts, 2014-2017
List of Figures (56 Figures)
Figure 1 Ammunition Handling Systems Market: Market Segmentation
Figure 2 Ammunition Handling Systems Market: Research Flow
Figure 3 Ammunition Handling Systems Market: Research Design
Figure 4 Breakdown of Primary Interviews: By Company Type, Designation, and Region
Figure 5 Market Size Estimation Methodology: Bottom-Up Approach
Figure 6 Market Size Estimation Methodology: Top-Down Approach
Figure 7 Data Triangulation
Figure 8 Assumptions of the Research Study
Figure 9 Ammunition Handling Systems Market, By Platform, 2017-2022 (USD Billion)
Figure 10 Ammunition Handling Systems Market, By Weapon Type, 2017-2022 (USD Billion)
Figure 11 Ammunition Handling Systems Market, By Mode of Operation, 2017-2022 (USD Billion)
Figure 12 Ammunition Handling Systems Market, By Component, 2017-2022 (USD Billion)
Figure 13 The Ammunition Handling Systems Market in Asia Pacific is Projected to Grow at the Highest CAGR During the Forecast Period
Figure 14 Increased Investments to Procure Automatic Ammunition Handling Systems are Expected to Drive the Growth of the Market During the Forecast Period
Figure 15 The Unmanned Aerial Vehicles Segment is Expected to Grow at the Highest CAGR During the Forecast Period
Figure 16 The Infantry Segment is Projected to Grow at the Highest CAGR During the Forecast Period
Figure 17 The Coastal/Littoral Ships Segment is Projected to Lead the Naval Platform Market During the Forecast Period
Figure 18 The Linkless Feeding Mechanism Segment is Estimated to Account for the Largest Share of the Ammunition Handling Systems Market in 2017
Figure 19 China is Estimated to Account for the Largest Share of the Asia Pacific Ammunition Handling Systems Market in 2017
Figure 20 Advantages of Ammunition Handling Systems
Figure 21 Increasing Demand From Militaries is Driving the Ammunition Handling Systems Market
Figure 22 Causes of Mechanical Failures in Ammunition Handling Systems
Figure 23 Technology Trends in Ammunition Handling Systems Market
Figure 24 Benefits of Hybrid Power Systems
Figure 25 Advanced Properties of Autoloaders
Figure 26 The Airborne Platform is Projected to Grow at the Highest CAGR During the Forecast Period
Figure 27 The Gatling Guns Segment is Projected to Grow at the Highest CAGR During the Forecast Period
Figure 28 Automatic Cannons Segment, By Weapon Type, 2015-2022 (USD Million)
Figure 29 Semi-Automatic Cannons Segment, By Weapon Type, 2015-2022 (USD Million)
Figure 30 Automatic Gatling Guns Segment, By Weapon Type, 2015-2022 (USD Million)
Figure 31 Semi-Automatic Gatling Guns Segment, By Weapon Type, 2015-2022 (USD Million)
Figure 32 Automatic Main Guns Segment, By Weapon Type, 2015-2022 (USD Million)
Figure 33 Semi-Automatic Main Guns Segment, By Weapon Type, 2015-2022 (USD Million)
Figure 34 Automatic Machine Guns Segment, By Weapon Type, 2015-2022 (USD Million)
Figure 35 Semi-Automatic Machine Guns Segment, By Weapon Type, 2015-2022 (USD Million)
Figure 36 Automatic Launchers Segment, By Weapon Type, 2015-2022 (USD Million)
Figure 37 Semi-Automatic Launchers Segment, By Weapon Type, 2015-2022 (USD Million)
Figure 38 The Loading Systems Segment is Projected to Grow at the Highest CAGR During the Forecast Period
Figure 39 The Linkless Segment is Projected to Grow at the Highest CAGR During the Forecast Period
Figure 40 Automatic Segment Projected to Grow at the Highest CAGR During the Forecast Period
Figure 41 Regional Snapshot
Figure 42 North America Ammunition Handling Systems Market Snapshot
Figure 43 Europe Ammunition Handling Systems Market Snapshot
Figure 44 Asia Pacific Ammunition Handling Systems Market Snapshot
Figure 45 Middle East Ammunition Handling Systems Market Snapshot
Figure 46 Companies Adopted Contract as the Key Growth Strategy Between September 2014 and April 2017
Figure 47 Market Ranking Analysis of Key Players, 2016
Figure 48 Regional Revenue Mix of Top 5 Market Players (2016)
Figure 49 Meggitt: Company Snapshot
Figure 50 General Dynamics: Company Snapshot
Figure 51 Curtiss-Wright: Company Snapshot
Figure 52 Curtiss-Wright Corporation: SWOT Analysis
Figure 53 Moog: Company Snapshot
Figure 54 BAE Systems: Company Snapshot
Figure 55 Thales Group: Company Snapshot
Figure 56 Ammunition Handling Systems Market Segmentation


Growth opportunities and latent adjacency in Ammunition Handling System Market