Metal Casting Market by Process (Gravity, High & Low Pressure, Sand), Application (Body Assembly, Engine, and Transmission), Material (Iron, Al, Mg, Zn), Component, ICE & EV (Passenger Car, LCV, HCV, BEV, HEV & PHEV), and Region - Global Forecast to 2025


Metal Casting Market
Automotive metal casting involves preparing automotive components by pouring hot metal into a metal die or sand mold. Metal casting process offers several benefits such as tighter tolerance, achieving variable thickness for the same component, reduction in scrappage and longer product life compared with other manufacturing processes such as forging and metal extrusion.
Market Drivers:
- Growing stringency in emission & fuel efficiency regulations to drive the demand for aluminium, the key casting material in automotive industry
- Lack of alternative manufacturing process for metal casting
- Rising sales of electric & hybrid vehicles boost the demand for metal casting market
Market Restraints:
- High cost of casting materials such as aluminium & magnesium
- Metal extrusion process versus die casting process
Top 10 Players:
- Nemak: Founded in 1979 and headquartered in Nuevo Leon, Mexico, the company specializes in developing and manufacturing automotive aluminum casting products for powertrain and body structure applications. The company, along with its subsidiaries, produces aluminum components, such as cylinder heads, engine blocks, transmission parts, structural parts, and other components for the automobile industry in North America, Europe, South America, and Asia. The company’s customer base belongs to key automotive OEMs that include Audi AG (Germany), Bayerische Motoren Werke AG (Germany), Mercedes-Benz (Germany), Ford Motor Company (US), and Hyundai Motor Company (South Korea).
- Ryobi Ltd.: Established in 1943 and headquartered in Hiroshima-ken, Japan, the company operates through four segments - die castings, printing equipment, power tools and builder’s hardware, and others. It designs, manufactures, and sells casting products under the die castings division, for the automobile industry. Ryobi Mirasaka Co. (Japan), Ryobi Mitsugi Co. (Japan), Tokyo Light Alloy Co., Ltd. (Japan), Ryobi Die Casting, Inc. (US), Ryobi Aluminium Casting, Limited (UK), Ryobi Die Casting Changzhou Co., Ltd. (China), and RDCM, S. de R.L.de C.V. (Mexico) are some of the key subsidiaries, through which the company provides its components in the global market. The company has its presence in the US, Mexico, China, Thailand, and Japan.
- Rheinmetall Automotive: Rheinmetall Automotive was founded in 1909 and is headquartered in Neckarsulm, Germany. The company has three major business divisions - mechatronics, hardparts, and aftermarket. The company manufactures and sells engine blocks, engine heads, pistons, and other structural casting components under the hardparts division. The company supplies its components for passenger cars, light and heavy commercial vehicles, and off-road vehicles. The company primarily operates in the European market and has an active presence in North America, Asia, and South America.
- GF Automotive: GF Automotive was incorporated in 1802 and is based in Schaffhausen, Switzerland. The company operates through three business segments - passenger cars, trucks, and industrial applications. The company offers die and sand-casting components for passenger cars and trucks. The company has 10 manufacturing plants - 4 in Germany, 3 in Austria, 2 in China, and 1 in the US. It also has multiple manufacturing tie-ups with companies in North America, Japan, and Indonesia. The company has a strong footprint in the European market and significant presence in the Americas and Asia.
- Ahresty Corporation: The company operates through five business segments - Die Castings (Japan), Die Casting (North America), Die Casting (Asia), Aluminum, and Proprietary Products. The company has 10 die casting facilities - 5 in Japan, 2 in China, and 1 each in US, Mexico, and India. The company also has a die manufacturing, machining, and secondary aluminum ingot manufacturing plant. Other than aluminum die casting, the company is involved in processing and assembly of automotive parts.
- Dynacast
- Endurance
- Mino Industrial
- Aisin Automotive Casting
- Gibbs Die Casting
Top Processes:
- HPDC
- Gravity
- LPDC
The global metal casting market size was valued at USD 18.73 billion in 2016 and is expected to reach USD 39.94 billion by 2025, at a CAGR of 8.87% during the forecast period 2017-2025. As per the US Department of Energy, the use of lightweight casting materials such as magnesium and aluminum alloy can reduce the body & chassis weight up to 50%. Hence, in order to meet the stringent emission and fuel efficiency targets of the European Union (EU) and US Environmental Protection Agency (EPA), the use of lightweight materials (Al, Mg, Zn & others) has increased in the automotive industry. Multiple powertrains and body structure related components that are manufactured using these materials follow the casting process. Additionally, rising vehicle production, coupled with growing demand for mid and premium segment vehicles and lack of alternative manufacturing processes, are driving the growth of this market. OEMs are also focusing on the production of electric and hybrid vehicles, which have a higher usage of lightweight materials, resulting in substantial growth in the metal casting industry.
Objectives of the Study:
- To define, describe, and forecast the global metal casting market based on process (gravity, HPDC, LPDC & sand casting), material type (aluminum, cast iron, magnesium, zinc, & others), vehicle type (ICE and electric & hybrid vehicles), and region (Asia Oceania, Europe, North America, and RoW)
- To estimate & forecast the market by application (body assemblies, engine parts, & transmission parts)
- To estimate & forecast the market by components (alloy wheels, battery housing, cross car beam, clutch casing, crank cases, cylinder heads, engine block, differential cover housing, engine mount, flywheel housing, front door frame, exhaust & intake manifold, gearbox housing, ignition & lock housing, oil pan, rear door frame, seat frame, transmission housing & turbocharger housing)
The bottom-up and top-down approaches have been used to estimate and validate the size of the global metal casting market, by vehicle type. To determine the volume of the market, by vehicle type, the regional-level production numbers of each vehicle type (PC, LCV, & HCV) have been multiplied by the number of each component installed per vehicle, which gives the regional-level penetration of each component for each vehicle type in thousand units. Further, the multiplication of regional components market (in thousand units) with the average weight of each component for all vehicle type determines the global market, by vehicle type, in thousand metric tons (TMT). The regional-level and global market sizes, by volume, for each vehicle type are multiplied with the regional-level average selling price of each processed material, which gives the regional-level and global market size in terms of value. The further summation of regional-level market values gives the value of global market, by vehicle type. A similar approach has been followed to derive this market, by application, process, and components.
The top-down approach has been used to estimate and validate the size of the global market, by material type. The global market size, by volume, is multiplied by the regional-level penetration of each material type to get the regional metal casting market, by material type, in terms of volume and value.
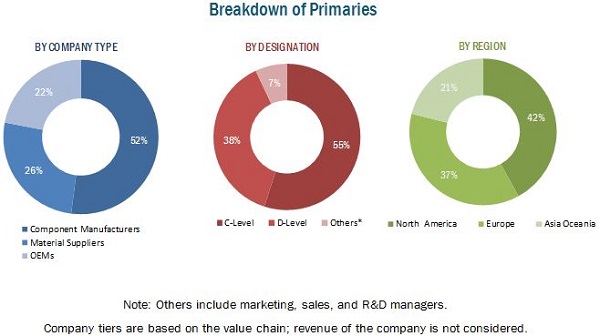
The research methodology involves various secondary sources such as Organisation Internationale des Constructeurs d’Automobiles (OICA), European Automobile Manufacturers Association (ACEA), Canada Automobile Association (CAA), The North American Die Casting Association (NADCA), The Aluminum Association (US), International Magnesium Association (US), Canadian Die Casters Association (CDCA), European Die-Casting Association (EDCA), corporate filings (such as annual reports, investor presentations, and financial statements), and business and industry magazines along with paid databases. The below figure illustrates the break-up of the profile of industry experts who participated in primary discussions.
To know about the assumptions considered for the study, download the pdf brochure
Metal casting market is dominated by a few globally established players such as Nemak (Mexico), Ryobi Limited (Japan), Rheinmetall Automotive (Germany), GF Automotive (Switzerland), Ahresty Corporation (Japan), and Dynacast (US).
Target Audience
- Automotive casting components manufacturers
- Automotive casting component suppliers, traders, and distributors
- Automotive casting materials manufacturers and suppliers
- Automotive OEMs
- Automotive component manufacturing associations
- Government and regulatory authorities
- Research and consulting associations
Get online access to the report on the World's First Market Intelligence Cloud
Request Sample Scope of the Report

-
By Process
- Gravity Casting
- High-Pressure Die Casting (HPDC)
- Low-Pressure Die Casting (LPDC)
- Sand Casting
-
By Material Type
- Aluminum
- Cast iron
- Magnesium
- Zinc
- Others
-
By Application
- Body Assemblies
- Engine Parts
- Transmission Parts
-
By Components
- Alloy Wheels
- Battery Housing
- Cross Car Beam
- Clutch Casing
- Crank Cases
- Cylinder Heads
- Engine Block
- Differential Cover Housing
- Engine Mount
- Flywheel Housing
- Front Door Frame
- Exhaust Manifold
- Intake Manifold
- Gearbox Housing
- Ignition & Lock Housing
- Oil Pan
- Rear Door Frame
- Seat Frame
- Transmission Housing
- Turbocharger housing
-
By Vehicle Type
- Passenger Car
- HCV
-
By Electric & Hybrid Vehicle Type
- BEV
- HEV
- PHEV
-
By Region & Country
-
Asia Oceania
- China
- India
- Japan
- South Korea
-
Europe
- France
- Germany
- Italy
- Spain
- UK
-
North America
- Canada
- Mexico
- US
-
RoW
- Brazil
- Russia
- South Africa
-
Asia Oceania
Available Customizations
With the given market data, MarketsandMarkets offers customizations in accordance with the company’s specific needs.
-
Global Metal Casting Market for Components, By Material Type (TMT)
- Alloy Wheels
- Cross Car Beam
- Crank Cases
- Cylinder Heads
- Differential Cover Housing
- Engine Block
- Engine Mount
- Exhaust Manifold
- Front Door
- Gearbox Housing
- Ignition & Lock Housing
- Intake Manifold
- Seat Frame
- Transmission Housing
- Turbo Charger Housing
(Note: The segment covers the market of above-mentioned components at regional level – Asia Oceania, Europe, North America, & RoW)
-
Global Metal Casting Market for Application, By Vehicle Type
- Body Assemblies
- Engine Parts
- Transmission Parts
(Note: The segment covers the market for vehicle type: passenger cars, LCV and HCV at regional level – Asia Oceania, Europe, North America, & RoW)
- Detailed Analysis and Profiling of Additional Market Players (Up to 3)
The Metal Casting Market is projected to reach USD 39.94 Billion by 2025 from USD 20.23 Billion in 2017, at a CAGR of 8.87% during the forecast period. Structural & design changes, increasing trend of light-weighting in passenger cars (such as increase in use of alloy wheels, lightweight engine blocks, & seat frames etc.) as a result of stringent emission norms, and benefits offered by casting process such as higher precision, accuracy, shorter cycle time, and excellent surface finish are expected to drive the market for metal casting during the forecast period.
Aluminum is estimated to hold the largest share of this Metal Casting Market from 2017 to 2025. Engine downsizing is a key trend that is changing the market dynamics of the automotive industry. The engine is becoming bigger and complex with additional turbo capabilities to generate more power. As per a study published by European Aluminium Association, the average aluminum content in a passenger car was around 150 kg in 2015. While the engine and transmission parts together contributed 36%, wheels owned 20%. The same study suggests that the aluminum content is expected to reach 180 kg by 2020. The demand for aluminum cast components for powertrain and body assemblies is thus projected to rise in the coming years.
The engine parts application is estimated to lead metal casting market during the forecast period. Cylinder heads, engine block, engine mounts, exhaust manifold, intake manifold, oil pan, and turbochargers are some of the key components considered under this application. With the rising trend of vehicle light-weighting, the casted iron engine block is replaced by aluminum engine block for further weight reduction. BMW, PSA Group, and General Motors among others are offering their vehicle models with aluminum engine blocks. Further, as per the US Department of Energy (US DOE), by using lightweight components, a quarter of US fleet, which is around 240 million (cars and trucks), can save approximately 5 billion gallons of fuel per year by 2030. Furthermore, as per MarketsandMarkets analysis, V6 and V8 engines are preferred in US & Canada owing to higher demand for SUVs. The European and Asia Oceania markets have a higher demand for I4 and I3 & I4 engines, respectively. Thus, as the engines are getting bigger and complex with turbocharging capabilities, the demand for aluminum casted engine parts is expected to rise in the future.
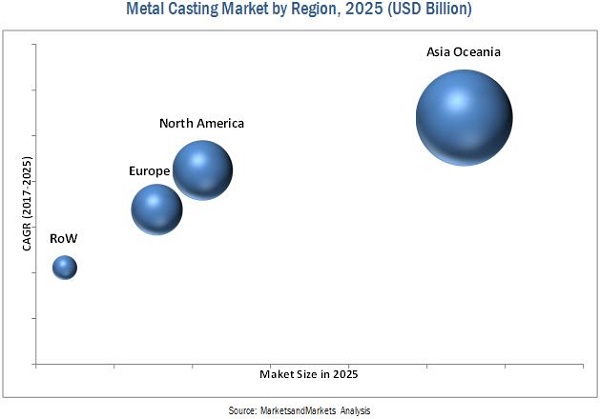
Asia Oceania is projected to be the largest and fastest growing metal casting market, in terms of volume and value during the review period. The Asia Oceania region is anticipated to be the most promising market in the next eight years owing to the increased production of passenger cars as well as electric vehicles. China is the largest automotive hub in the region owing to the presence of many local as well as international OEMs such as Brilliance Auto, JAC Motors, SAIC Motor, Volkswagen, and General Motors. Further, according to OICA, the passenger car production of Japan and India together had grown from 10.1 million units in 2011 to 11.5 million units in 2016, at a CAGR of 15.84%. Also, according to International Energy Agency (IEA), the sales of BEV and PHEV in China climbed by 75% and 30%, respectively from 2015 to 2016. Similarly, BEV sales in Japan jumped by 48% in 2016 from 2015. In addition to high vehicle production and sales, other factors such as increasing GDP, rising per capita income, and low production costs have created growth opportunities in this region. All the factors mentioned above will prompt the tier-1 suppliers to develop lighter metal casted components to enhance the overall vehicle performance.
The high cost of casted materials such as aluminum and magnesium is one of the key restraints for metal casting component manufacturers. Also, the high initial capital requirement for setup becomes a challenge for new entrants. These factors may affect the growth of metal casting market in the near future.
Some of the key metal casting component manufacturers and suppliers include Nemak (Mexico), Ryobi Limited (Japan), Rheinmetall Automotive (Germany), GF Automotive (Switzerland), Ahresty Corporation (Japan), Dynacast (US), Endurance (India), Mino Industrial (Japan), Aisin Automotive Casting (US) (a subsidiary of Aisin Seiki (Japan)), and Gibbs Die Casting (US). Nemak adopted a stable mix of expansion and acquisition strategies to retain its market position, while Ryobi Limited followed the expansion strategy to remain a prominent player in the metal casting market.
To speak to our analyst for a discussion on the above findings, click Speak to Analyst
Table of Contents
1 Introduction (Page No. - 17)
1.1 Objectives of the Study
1.2 Market Definition
1.3 Market Scope
1.3.1 Years Considered for the Study
1.4 Currency
1.5 Package Size
1.6 Limitations
1.7 Stakeholders
2 Research Methodology (Page No. - 21)
2.1 Research Data
2.1.1 Secondary Data
2.1.2 Primary Data
2.1.3 Sampling Techniques and Data Collection Methods
2.1.4 Primary Participants
2.2 Factor Analysis
2.2.1 Demand-Side Analysis
2.2.1.1 Impact of Population on Total Vehicle Sales
2.2.1.2 Growth in Global Premium Vehicle Sales
2.2.2 Supply-Side Analysis
2.2.2.1 Abundant Availability of Raw Material
2.3 Market Estimation
2.3.1 Bottom-Up Approach
2.3.2 Top-Down Approach
2.4 Metal Casting Market Breakdown & Data Triangulation
2.5 Assumptions
3 Executive Summary (Page No. - 31)
4 Premium Insights (Page No. - 37)
4.1 Attractive Opportunities in Global Metal Casting Market
4.2 Market, By Region
4.3 Market, By Process
4.4 Market, By Application
4.5 Market, By Material Type
4.6 Market, By Vehicle Type
4.7 Market, By Electric Vehicle Type
5 Metal Casting Market Overview (Page No. - 43)
5.1 Introduction
5.1.1 Drivers
5.1.1.1 Growing Stringency in Emissions and Fuel Efficiency Regulations to Drive the Demand for Aluminum, the Key Casting Material in the Automotive Industry
5.1.1.2 Lack of Alternative Manufacturing Process for Metal Casting
5.1.2 Restraints
5.1.2.1 High Cost of Casting Materials, Such as Aluminum and Magnesium
5.1.2.2 Metal Extrusion Process Versus Die Casting Process
5.1.3 Opportunities
5.1.3.1 Rising Sales of Electric and Hybrid Vehicles
5.1.4 Challenges
5.1.4.1 High Amount of Capital Investments and Existing Competition
5.2 Macro-Indicator Analysis
5.2.1 Introduction
5.2.1.1 Premium Vehicle Sales as A Percentage of Total Sales
5.2.1.2 GDP (USD Billion)
5.2.1.3 GNI Per Capita, Atlas Method (USD)
5.2.1.4 GDP Per Capita Ppp (USD)
5.2.2 Macro Indicators Influencing the Global Market in Top 3 Countries
5.2.2.1 China
5.2.2.2 Us
5.2.2.3 Japan
6 Metal Casting Market, By Process (Page No. - 55)
6.1 Introduction
6.2 Gravity Casting
6.3 HPDC
6.4 LPDC
6.5 Sand Casting
7 Metal Casting Market, By Material Type (Page No. - 62)
7.1 Introduction
7.2 Aluminum Casting
7.3 Cast Iron
7.4 Magnesium Casting
7.5 Zinc Casting
7.6 Others
8 Metal Casting Market, By Application (Page No. - 71)
8.1 Introduction
8.2 Body Assemblies
8.3 Engine Parts
8.4 Transmission Parts
9 Metal Casting Market, By Component (Page No. - 77)
9.1 Introduction
9.2 Alloy Wheels
9.3 Battery Housing
9.4 Clutch Casing
9.5 Cross Car Beam
9.6 Crank Case
9.7 Cylinder Head
9.8 Differential Cover Housing
9.9 Engine Block
9.10 Engine Mount
9.11 Exhaust Manifold
9.12 Flywheel Housing
9.13 Front Door
9.14 Gearbox Housing
9.15 Ignition and Lock Housing
9.16 Intake Manifold
9.17 Oil Pan
9.18 Rear Door Frame
9.19 Seat Frame
9.20 Transmission Housing
9.21 Turbocharger Housing
10 Metal Casting Market, By Vehicle Type (Page No. - 94)
10.1 Introduction
10.2 Passenger Cars
10.3 LCVS
10.4 HCVS
11 Metal Casting Market, By Electric and Hybrid Vehicle Type (Page No. - 100)
11.1 Introduction
11.1.1 BEVS
11.1.2 HEVS
11.1.3 PHEVS
12 Metal Casting Market, By Region (Page No. - 106)
12.1 Introduction
12.2 Asia Oceania
12.2.1 China
12.2.2 India
12.2.3 Japan
12.2.4 South Korea
12.3 Europe
12.3.1 France
12.3.2 Germany
12.3.3 Spain
12.3.4 UK
12.4 North America
12.4.1 Canada
12.4.2 Mexico
12.4.3 US
12.5 RoW
12.5.1 Brazil
12.5.2 Russia
12.5.3 South Africa
13 Competitive Landscape (Page No. - 126)
13.1 Overview
13.2 Metal Casting Market Ranking Analysis
13.2.1 Expansions
13.2.2 Mergers & Acquisitions
13.2.3 Supply Contracts/Partnerships/Joint Ventures
13.2.4 New Product/Technology Developments
13.3 Competititve Scenario
14 Company Profiles (Page No. - 133)
(Overview, Product Offerings, Recent Developments, SWOT Analysis & MnM View)*
14.1 Nemak
14.2 Ryobi Limited
14.3 GF Automotive
14.4 Rheinmetall Automotive
14.5 Ahresty Corporation
14.6 Dynacast
14.7 Endurance
14.8 Mino Industrial
14.9 Aisin Automotive Casting
14.10 Gibbs Die Casting
*Metal Casting Market Details on Overview, Product Offerings, Recent Developments, SWOT Analysis & MnM View Might Not Be Captured in Case of Unlisted Companies.
15 Appendix (Page No. - 156)
15.1 Insights of Industry Experts
15.2 Discussion Guide
15.3 Knowledge Store: Marketsandmarkets’ Subscription Portal
15.4 Introducing RT: Real Time Market Intelligence
15.5 Available Customizations
15.5.1 Metal Casting Market for Components, By Material Type (Tmt)
15.5.1.1 Alloy Wheels
15.5.1.2 Cross Car Beam
15.5.1.3 Crank Cases
15.5.1.4 Cylinder Heads
15.5.1.5 Differential Cover Housing
15.5.1.6 Engine Block
15.5.1.7 Engine Mount
15.5.1.8 Exhaust Manifold
15.5.1.9 Front Door
15.5.1.10 Gearbox Housing
15.5.1.11 Ignition & Lock Housing
15.5.1.12 Intake Manifold
15.5.1.13 Seat Frame
15.5.1.14 Transmission Housing
15.5.1.15 Turbo Charger Housing
15.5.2 Metal Casting Market for Applications, By Vehicle Type
15.5.2.1 Body Assemblies
15.5.2.2 Engine Parts
15.5.2.3 Transmission Parts
15.5.3 Detailed Analysis and Profiling of Additional Market Players (Up to 3)
15.6 Related Reports
15.7 Author Details
List of Tables (120 Tables)
Table 1 Currency Exchange Rates (W.R.T. USD)
Table 2 Body-In-White (BIW) Material Mix for Advanced High Strength Steel (AHSS) and Aluminum
Table 3 US: Future Weight Reduction Targets, By Component, 2025 vs 2050
Table 4 Benefit Analysis of Different Manufacturing Processes
Table 5 Average Material Weight for North American Light Vehicles (Kg/Vehicle), 2016
Table 6 Government Incentives for Electric Vehicles, By Country
Table 7 Comparison of Metal Casting Processes
Table 8 Global Metal Casting Market Size, By Process, 2015–2025 (Thousand Metric Tons)
Table 9 Global Market Size, By Process, 2015–2025 (USD Million)
Table 10 Gravity Casting Market Size, By Region, 2015–2025 (Thousand Metric Tons)
Table 11 Gravity Casting Market Size, By Region, 2015–2025 (USD Million)
Table 12 HPDC Market Size, By Region, 2015–2025 (Thousand Metric Tons)
Table 13 HPDC Market Size, By Region, 2015–2025 (USD Million)
Table 14 LPDC Market Size, By Region, 2015–2025 (Thousand Metric Tons)
Table 15 LPDC Market Size, By Region, 2015–2025 (USD Million)
Table 16 Sand Casting Market Size, By Region, 2015–2025 (Thousand Metric Tons)
Table 17 Sand Casting Market Size, By Region, 2015–2025 (USD Million)
Table 18 ASP Analysis, By Material Type, 2016
Table 19 Global Market Size, By Material Type, 2015–2025 (Thousand Metric Tons)
Table 20 Global Market Size, By Material Type, 2015–2025 (USD Million)
Table 21 Aluminum: Market Size, By Region, 2015–2025 (Thousand Metric Tons)
Table 22 Aluminum: Market Size, By Region, 2015–2025 (USD Million)
Table 23 Cast Iron: Market Size, By Region, 2015–2025 (Thousand Metric Tons)
Table 24 Cast Iron: Market Size, By Region, 2015–2025 (USD Million)
Table 25 Magnesium: Market Size, By Region, 2015–2025 (Thousand Metric Tons)
Table 26 Magnesium: Market Size, By Region, 2015–2025 (USD Million)
Table 27 Zinc: Market Size, By Region, 2015–2025 (Thousand Metric Tons)
Table 28 Zinc: Market Size, By Region, 2015–2025 (USD Million)
Table 29 Other Materials: Market Size, By Region, 2015–2025 (Thousand Metric Tons)
Table 30 Other Materials: Market Size, By Region, 2015–2025 (USD Million)
Table 31 Market Size, By Application, 2015–2025 (Thousand Metric Tons)
Table 32 Market Size, By Application, 2015–2025 (USD Million)
Table 33 Metal Casting Market Size for Body Assemblies, By Region, 2015–2025 (Thousand Metric Tons)
Table 34 Market Size for Body Assemblies, By Region, 2015–2025 (USD Million)
Table 35 Market Size for Engine Parts, By Region, 2015–2025 (Thousand Metric Tons)
Table 36 Market Size for Engine Parts, By Region, 2015–2025 (USD Million)
Table 37 Market Size for Transmission Parts, By Region, 2015–2025 (Thousand Metric Tons)
Table 38 Market Size for Transmission Parts, By Region, 2015–2025 (USD Million)
Table 39 Metal Casting Components Market Size, By Region, 2015–2025 (Thousand Units)
Table 40 Market Size for Alloy Wheels, By Region, 2015–2025 (Thousand Units)
Table 41 Market Size for Battery Housing, By Region, 2015–2025 (Thousand Units)
Table 42 Market Size for Clutch Casing, By Region, 2015–2025 (Thousand Units)
Table 43 Market Size for Cross Car Beam, By Region, 2015–2025 (Thousand Units)
Table 44 Market Size for Crank Case, By Region, 2015–2025 (Thousand Units)
Table 45 Market Size for Cylinder Head, By Region, 2015–2025 (Thousand Units)
Table 46 Market Size for Differential Cover Housing, By Region, 2015–2025 (Thousand Units)
Table 47 Market Size for Engine Block, By Region, 2015–2025 (Thousand Units)
Table 48 Market Size for Engine Mount, By Region, 2015–2025 (Thousand Units)
Table 49 Market Size for Exhaust Manifold, By Region, 2015–2025 (Thousand Units)
Table 50 Metal Casting Market Size for Flywheel Housing, By Region, 2015–2025 (Thousand Units)
Table 51 Market Size for Front Door, By Region, 2015–2025 (Thousand Units)
Table 52 Market Size for Gearbox Housing, By Region, 2015–2025 (Thousand Units)
Table 53 Market Size for Ignition & Lock Housing, By Region, 2015–2025 (Thousand Units)
Table 54 Market Size for Intake Manifold, By Region, 2015–2025 (Thousand Units)
Table 55 Market Size for Oil Pan, By Region, 2015–2025 (Thousand Units)
Table 56 Market Size for Rear Door Frame, By Region, 2015–2025 (Thousand Units)
Table 57 Market Size for Seat Frame, By Region, 2015–2025 (Thousand Units)
Table 58 Market Size for Transmission Housing, By Region, 2015–2025 (Thousand Units)
Table 59 Market Size for Turbocharger Housing, By Region, 2015–2025 (Thousand Units)
Table 60 Market Size, By Vehicle Type, 2015–2025 (Thousand Metric Tons)
Table 61 Market Size, By Vehicle Type, 2015–2025 (USD Million)
Table 62 Passenger Cars: Market Size, By Region, 2015–2025 (Thousand Metric Tons)
Table 63 Passenger Cars: Market Size, By Region, 2015–2025 (USD Million)
Table 64 LCVS: Market Size, By Region, 2015–2025 (Thousand Metric Tons)
Table 65 LCVS: Market Size, By Region, 2015–2025 (USD Million)
Table 66 HCVS: Market Size, By Region, 2015–2025 (Thousand Metric Tons)
Table 67 HCVS: Market Size, By Region, 2015–2025 (USD Million)
Table 68 Global Market Size, By Electric and Hybrid Vehicle Type, 2015–2025 (Thousand Metric Tons)
Table 69 Global Market Size, By Electric and Hybrid Vehicle Type, 2015–2025 (USD Million)
Table 70 Top Selling BEV Models
Table 71 BEV: Market Size, By Material Type, 2015–2025 (Thousand Metric Tons)
Table 72 BEV: Market Size, By Material Type, 2015–2025 (USD Million)
Table 73 HEV: Market Size, By Material Type, 2015–2025 (Thousand Metric Tons)
Table 74 HEV: Market Size, By Material Type, 2015–2025 (USD Million)
Table 75 PHEV: Market Size, By Material Type, 2015–2025 (Thousand Metric Tons)
Table 76 PHEV: Market Size, By Material Type, 2015–2025 (USD Million)
Table 77 Global Market Size, By Region, 2015–2025 (Thousand Metric Tons)
Table 78 Global Market Size, By Region, 2015–2025 (USD Million)
Table 79 Asia Oceania: Market Size, By Application, 2015–2025 (Thousand Metric Tons)
Table 80 Asia Oceania: Market Size, By Application, 2015–2025 (USD Million)
Table 81 China: Market Size, By Application, 2015–2025 (Thousand Metric Tons)
Table 82 China: Market Size, By Application, 2015–2025 (USD Million)
Table 83 India: Market Size, By Application, 2015–2025 (Thousand Metric Tons)
Table 84 India: Market Size, By Application, 2015–2025 (USD Million)
Table 85 Japan: Market Size, By Application, 2015–2025 (Thousand Metric Tons)
Table 86 Japan: Market Size, By Application, 2015–2025 (USD Million)
Table 87 South Korea: Market Size, By Application, 2015–2025 (Thousand Metric Tons)
Table 88 South Korea: Market Size, By Application, 2015–2025 (USD Million)
Table 89 Europe: Market Size, By Application, 2015–2025 (Thousand Metric Tons)
Table 90 Europe: Market Size, By Application, 2015–2025 (USD Million)
Table 91 France: Market Size, By Application, 2015–2025 (Thousand Metric Tons)
Table 92 France: Market Size, By Application, 2015–2025 (USD Million)
Table 93 Germany: Market Size, By Application, 2015–2025 (Thousand Metric Tons)
Table 94 Germany: Market Size, By Application, 2015–2025 (USD Million)
Table 95 Italy: Market Size, By Application, 2015–2025 (Thousand Metric Tons)
Table 96 Italy: Market Size, By Application, 2015–2025 (USD Million)
Table 97 Spain: Market Size, By Application, 2015–2025 (Thousand Metric Tons)
Table 98 Spain: Market Size, By Application, 2015–2025 (USD Million)
Table 99 UK: Market Size, By Application, 2015–2025 (Thousand Metric Tons)
Table 100 UK: Market Size, By Application, 2015–2025 (USD Million)
Table 101 North America: Market Size, By Application, 2015–2025 (Thousand Metric Tons)
Table 102 North America: Market Size, By Application, 2015–2025 (USD Million)
Table 103 Canada: Market Size, By Application, 2015–2025 (Thousand Metric Tons)
Table 104 Canada: Market Size, By Application, 2015–2025 (USD Million)
Table 105 Mexico: Market Size, By Application, 2015–2025 (Thousand Metric Tons)
Table 106 Mexico: Market Size, By Application, 2015–2025 (USD Million)
Table 107 US: Market Size, By Application, 2015–2025 (Thousand Metric Tons)
Table 108 US: Market Size, By Application, 2015–2025 (USD Million)
Table 109 RoW: Market Size, By Application, 2015–2025 (Thousand Metric Tons)
Table 110 RoW: Market Size, By Application, 2015–2025 (USD Million)
Table 111 Brazil: Market Size, By Application, 2015–2025 (Thousand Metric Tons)
Table 112 Brazil: Market Size, By Application, 2015–2025 (USD Million)
Table 113 Russia: Market Size, By Application, 2015–2025 (Thousand Metric Tons)
Table 114 Russia: Market Size, By Application, 2015–2025 (USD Million)
Table 115 South Africa: Market Size, By Application, 2015–2025 (Thousand Metric Tons)
Table 116 South Africa: Market Size, By Application, 2015–2025 (USD Million)
Table 117 Expansions, 2017
Table 118 Mergers & Acquisitions, 2016–2017
Table 119 Supply Contracts/Partnerships/Joint Ventures, 2016–2017
Table 120 New Product/Technology Developments, 2014–2017
List of Figures (48 Figures)
Figure 1 Market Segmentation
Figure 2 Market Research Design
Figure 3 Research Design Model
Figure 4 Breakdown of Primary Interviews: By Company Type, Designation, and Region
Figure 5 Impact of Population on Vehicle Sales, 2014
Figure 6 Global Premium Vehicle Sales Growth Rate, 2011 – 2015
Figure 7 Market Size Estimation Methodology: Bottom-Up Approach
Figure 8 Data Triangulation
Figure 9 Global Metal Casting Market, By Country, 2017 vs 2025 (USD Billion)
Figure 10 Global Market, By Application, 2017 vs 2025 (USD Billion)
Figure 11 Global Market, By Process, 2017 vs 2025 (USD Billion)
Figure 12 Global Market, By Material Type, 2017 vs 2025 (USD Billion)
Figure 13 Global Market, By Vehicle Type, 2017 vs 2025 (USD Billion)
Figure 14 Global Market, By Electric and Hybrid Vehicle Type, 2017 vs 2025 (USD Billion)
Figure 15 Global Market, 2017 vs 2025
Figure 16 Asia Oceania the Leading Region; HPDC the Most Preferred Metal Casting Process, 2017
Figure 17 HPDC Segment to Dominate the Market, 2017 vs 2025 (USD Billion)
Figure 18 Engine Parts Segment to Dominate the Market, 2015–2025 (USD Billion)
Figure 19 Aluminum Segment to Dominate the Market, 2017 vs 2025 (USD Billion)
Figure 20 Passenger Cars Segment to Lead the Market, 2017 vs 2025 (USD Billion)
Figure 21 HEV Segment to Hold the Largest Market Share, 2017 vs 2025 (USD Billion)
Figure 22 Market Dynamics
Figure 23 Future of Emissions Regulations, By Country, 2014–2025
Figure 24 Emissions Norms Comparative Analysis: US vs Euro (NOX & PM)
Figure 25 Global Raw Material Prices for Key Lightweight Materials, 2014–2021 (USD)
Figure 26 Global Top Selling HEV and PHEV Vehicle Models, 2015–2016 (Units)
Figure 27 Global Sales of Electric Vehicles (Thousand Units)
Figure 28 China: Rising PCI and Reviving Financial Markets to Drive Domestic Demand During the Forecast Period
Figure 29 US: Rising GNI Per Capita Expected to Drive Sales of Luxury Vehicles During the Forecast Period
Figure 30 Japan: Rising Debt-GDP Ratio to Be the Most Crucial Indicator, Given Its Excessively Weak Performance in the Recent Past
Figure 31 Metal Casting Market, By Process, 2017 vs 2025 (USD Million)
Figure 32 Market, By Material Type, 2017 vs 2025 (USD Million)
Figure 33 Market, By Application, 2017 vs 2025 (USD Million)
Figure 34 Market for Component, By Region, 2017 vs 2025 (Million Units)
Figure 35 Market, By Vehicle Type, 2017 vs 2025 (USD Million)
Figure 36 Market, By Electric and Hybrid Vehicle Type, 2017 vs 2025 (USD Million)
Figure 37 Global Market, By Region, 2017 vs 2025 (USD Million)
Figure 38 Asia Oceania: Market Snapshot
Figure 39 North America: Market Snapshot
Figure 40 Companies Adopted Expansions as the Key Growth Strategy, 2014 - 2017
Figure 41 Metal Casting: Market Ranking Analysis, 2016
Figure 42 Nemak: Company Snapshot
Figure 43 Ryobi: Company Snapshot
Figure 44 GF Automotive: Company Snapshot
Figure 45 Rheinmetall Automotive: Company Snapshot
Figure 46 Ahresty Corporation: Company Snapshot
Figure 47 Endurance: Company Snapshot
Figure 48 Mino Industrial: Company Snapshot


Growth opportunities and latent adjacency in Metal Casting Market
For industry analysis, we need a detailed report about metal casting and we believe this report will help us a lot.