Managed Application Services Market by Service (Operational Services, Application Infrastructure and Service Desk, Application Security, Disaster Recovery and Hosting), Application Type, Organization Size, Vertical, and Region - Global Forecast to 2022


[129 Pages Report] The managed application services market is expected to grow from USD 1.70 Billion in 2016 to USD 5.54 Billion by 2022, at a Compound Annual Growth Rate (CAGR) of 22.4% during the forecast period. The base year considered for the study is 2016 and the forecast period considered is 2017�2022.
Objectives of the Study
- To define, determine, and forecast the global managed application services market by service, application type, organization size, vertical, and region from 2017 to 2022, and analyze the various macro and microeconomic factors that affect the market growth
- To forecast the size of the market segments with respect to the 5 main regions, namely, North America, Europe, Latin America, Asia Pacific (APAC), and Middle East and Africa (MEA)
- To provide detailed information regarding the major factors influencing the growth of the market (drivers, restraints, opportunities, and challenges)
- To analyze each submarket with respect to individual growth trends, prospects, and contributions to the total market
- To analyze the market opportunities for stakeholders by identifying the high-growth segments in the market
- To profile key market players; provide a comparative analysis based on the business overview, regional presence, product offerings, business strategies, and key financials; and illustrate the competitive landscape of the market
- To track and analyze competitive developments, such as mergers and acquisitions, product developments, partnerships and collaborations, and R&D activities in the market
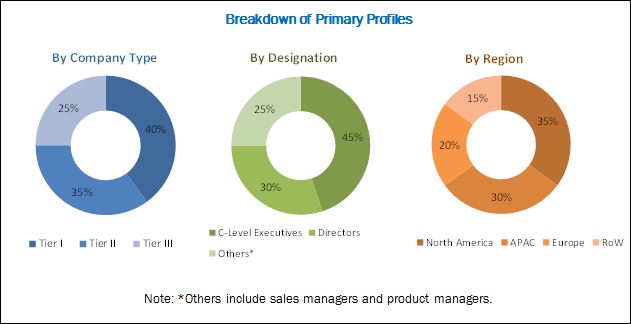
The research methodology used to estimate and forecast the managed application services market began with capturing data from the key vendor revenues and the market size of the individual segments through secondary sources, industry associations, and trade journals, such as the Technology Services Industry Association (TSIA) and the World Information Technology and Services Alliance (WITSA). The bottom-up procedure was employed to arrive at the overall market size of the market from the individual segments. After arriving at the overall market size, the total market was split into several segments and subsegments, which were then verified through primary research by conducting extensive interviews with key industry personnel, such as Chief Executive Officers (CEOs), Vice Presidents (VPs), directors, and executives. The data triangulation and market breakdown procedures were employed to complete the overall market engineering process and arrive at the exact statistics for all the segments and subsegments.
The breakdown of the profiles of the primary discussion participants is depicted in the figure below:
To know about the assumptions considered for the study, download the pdf brochure
The managed application services market ecosystem includes players, such as BMC Software (US), CenturyLink (US), Fujitsu (Japan), HCL (India), IBM (US), SMS Management & Technology (Australia), Unisys (US), Virtustream (US), Wipro (India), YASH Technologies (US), Mindtree (India), and Navisite (US).
Key Target Audience of the Managed Application Services Market
- Managed application service providers
- IT service providers
- Mobile application consumers
- Application and software developers
- Cloud service providers
- Consultants/consultancies/advisory firms
- Training and education service providers
Scope of the Market Research Report
|
Report Metrics |
Details |
|
Market size available for years |
2016�2022 |
|
Base year considered |
2016 |
|
Forecast period |
2017�2022 |
|
Forecast units |
Billion (USD) |
|
Segments covered |
Service (Operational Services, Application Infrastructure and Service Desk, Application Security, Disaster Recovery and Hosting), Application Type, Organization Size, Vertical, and Region |
|
Geographies covered |
North America, Europe, Latin America, Asia Pacific (APAC), and Middle East and Africa (MEA) |
|
Companies covered |
BMC Software (US), CenturyLink (US), Fujitsu (Japan), HCL (India), IBM (US), SMS Management & Technology (Australia), Unisys (US), Virtustream (US), Wipro (India), YASH Technologies (US), Mindtree (India), and Navisite (US) |
The research report categorizes the Managed Application Services Market to forecast the revenues and analyze trends in each of the following subsegments:
By Service
- Operational services
- Application service desk
- Application hosting
- Application security and disaster recovery
- Application infrastructure
By Application Type
- Web-based applications
- Mobile applications
By Organization Size
- Small and Medium-sized Enterprises (SMEs)
- Large enterprises
By Vertical
- Government
- Banking, Financial Services, and Insurance (BFSI)
- Telecom and IT
- Healthcare and life sciences
- Retail and eCommerce
- Manufacturing
- Energy and utilities
- Others (media and entertainment, travel and hospitality, education, and transportation and logistics)
By Region
- North America
- Europe
- APAC
- MEA
- Latin America
Available Customizations
With the given market data, MarketsandMarkets offers customizations as per the company�s specific requirements. The following customization options are available for the report:
Geographic Analysis
- Further country-level breakdown of the North American managed application services market
- Further country-level breakdown of the European market
- Further country-level breakdown of the APAC market
- Further country-level breakdown of the MEA market
- Further country-level breakdown of the Latin American market
Company Information
- Detailed analysis and profiling of additional market players
The managed application services market size is estimated to be USD 2.02 Billion in 2017 and is expected to reach USD 5.54 Billion by 2022, at a Compound Annual Growth Rate (CAGR) of 22.4% during the forecast period. The major factors driving the growth of the market include the increasing demand for end-to-end application hosting services and the rising sophistication level of application infrastructure.
The
Get online access to the report on the World's First Market Intelligence Cloud
- Easy to Download Historical Data & Forecast Numbers
- Company Analysis Dashboard for high growth potential opportunities
- Research Analyst Access for customization & queries
- Competitor Analysis with Interactive dashboard
- Latest News, Updates & Trend analysis

Scope of the Report
covers the managed application services market analysis by service, application type, vertical, organization size, and region. The operational services segment is expected to have the largest market share during the forecast period, as it is important for organizations to run their business applications smoothly. The operational services are responsible for the overall performance and operations of all critical business applications. Additionally, small downtime in organization�s applications can lead to huge losses. Hence, organizations across the globe are investing heavily on operational services.The mobile application type is expected to grow at a higher rate, due to its increasing adoption and deployment of applications in the mobile environment. Organizations are well versed with the business benefits that are generated by mobile applications. Furthermore, the availability of cloud-based, enterprise-grade mobile applications is said to be gaining traction among Small and Medium-sized Enterprises (SMEs), due to their cost-effectiveness and lesser maintenance charges. Hence, in the coming years, the demand for mobile application services is expected to increase.
The large enterprises segment is expected to hold a larger market share during the forecast period, owing to the increasing focus on reducing Capital Expenditure (CAPEX) and Operating Expenditure (OPEX). Large enterprises have very complex application infrastructure that performs day-to-day vital tasks. Managed application services enable large enterprises to offload the application maintenance and development tasks to managed application services market providers and focus on their core business processes.
The Banking, Financial Services, and Insurance (BFSI) vertical is estimated to have the largest market share in 2017 due to the adoption of omnichannel business models. Moreover, the emergence of eWallets, unified payment interfaces, and payment gateways are expanding the business applications coverage of the BFSI vertical.
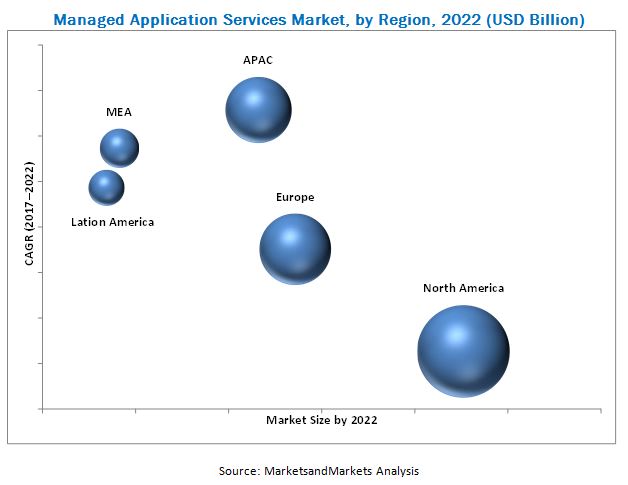
In the global managed application services market, by region, North America is expected to hold the largest market share, due to the high concentration of managed application service providers in this region. Furthermore, the companies in North America are well-versed with the cost benefits and business values that they would get on partnering with managed application service providers. Owing to such factors, enterprises in this region are growing rapidly and have a heavy demand for managed application services. Asia Pacific (APAC) is expected to grow at the highest rate in the market during the forecast period, due to the increased adoption of mobile applications. Furthermore, this region comprises a large number of SMEs that have limited IT budget and IT staff. Governments in this region are also adopting the mobile-first strategy to provide better citizen services that would spur the market of managed application services during the forecast period.
The major factors that are expected to limit the growth of the managed application services market are concerns for application data security and lack of trust on third party service providers. The major vendors profiled in the report include BMC Software (US), CenturyLink (US), Fujitsu (Japan), HCL (India), IBM (US), SMS Management & Technology (Australia), Unisys (US), Virtustream (US), Wipro (India), YASH Technologies (US), Mindtree (India), and Navisite (US).
To speak to our analyst for a discussion on the above findings, click Speak to Analyst
Table of Contents
1 Introduction (Page No. - 14)
1.1 Objectives of the Study
1.2 Market Definition
1.3 Market Scope
1.4 Years Considered for the Study
1.5 Currency
1.6 Stakeholders
2 Research Methodology (Page No. - 17)
2.1 Research Data
2.1.1 Breakdown of Primaries
2.1.2 Key Industry Insights
2.1.3 Data Triangulation
2.2 Market Size Estimation
2.3 Assumptions
2.4 Limitations
3 Executive Summary (Page No. - 23)
4 Premium Insights (Page No. - 27)
4.1 Attractive Market Opportunities in the Global Managed Application Services Market
4.2 Market By Application Type, 2017 vs 2022
4.3 Market By Service, 2017 vs 2022
4.4 Market By Organization Size, 2017 vs 2022
4.5 Market By Vertical, 2015�2022
4.6 Market Share Across Various Regions
4.7 Market Investment Scenario
5 Market Overview and Industry Trends (Page No. - 31)
5.1 Introduction
5.2 Market Dynamics
5.2.1 Drivers
5.2.1.1 Rising Demand for End-To-End Application Hosting Services is Triggering the Strategy of Service Differentiation
5.2.1.2 Increasing Degree of Business Risks Posed By Application Vulnerabilities
5.2.1.3 The Need to Focus More on Core Competencies
5.2.1.4 Cloud Deployment Going Mainstream
5.2.1.5 The Need to Minimize Security Risks Associated With Business Operations
5.2.2 Restraints
5.2.2.1 Lack of Trust in Third-Party Applications and Fear of Losing Control Over Application Data
5.2.3 Opportunities
5.2.3.1 Increasing Adoption of Mobile Devices and the Evolution of Iot
5.2.3.2 Rapid Adoption of Integrated Cloud Application Solutions Among the SMEs
5.2.3.3 The Rapid Digitalization Trend in the Emerging Economies
5.2.4 Challenges
5.2.4.1 Less Awareness About Applications and Low Network Bandwidth in Certain Regions
5.2.4.2 Huge Deployment Costs and the Need to Quickly Deploy Applications to End-Users
5.2.4.3 Lack of New Age IT Infrastructure
5.3 Use Cases
6 Managed Application Services Market, By Service (Page No. - 40)
6.1 Introduction
6.2 Operational Services
6.2.1 Database Management
6.2.2 Application Performance Management
6.3 Application Service Desk
6.3.1 Application Packaging
6.3.2 Image and Patch Management
6.3.3 Application Release Management
6.4 Application Hosting
6.5 Application Security and Disaster Recovery
6.6 Application Infrastructure
6.6.1 Web Server
6.6.2 Middleware
7 Market By Application Type (Page No. - 51)
7.1 Introduction
7.2 Web-Based Applications
7.3 Mobile Applications
8 Market By Organization Size (Page No. - 55)
8.1 Introduction
8.2 Small and Medium-Sized Enterprises
8.3 Large Enterprises
9 Managed Application Services Market, By Vertical (Page No. - 59)
9.1 Introduction
9.2 Banking, Financial Services, and Insurance
9.3 Telecom and IT
9.4 Government
9.5 Retail and Ecommerce
9.6 Healthcare and Life Sciences
9.7 Manufacturing
9.8 Energy and Utilities
9.9 Others
10 Market, By Region (Page No. - 69)
10.1 Introduction
10.2 North America
10.3 Europe
10.4 Asia Pacific
10.5 Middle East and Africa
10.6 Latin America
11 Competitive Landscape (Page No. - 89)
11.1 Overview
11.2 Market Ranking Analysis
11.3 Competitive Scenario
11.3.1 New Product/Service Launches
11.3.2 Business Expansions
11.3.3 Mergers and Acquisitions
11.3.4 Agreements and Partnerships
12 Company Profiles (Page No. - 94)
(Business Overview, Products & Services, Key Insights, Recent Developments, SWOT Analysis, MnM View)*
12.1 IBM
12.2 Fujitsu
12.3 Wipro
12.4 HCL
12.5 Unisys
12.6 BMC Software
12.7 Centurylink
12.8 Sms Management and Technology
12.9 Virtustream
12.10 Yash Technologies
12.11 Key Innovators
12.11.1 Mindtree
12.11.2 Navisite
*Details on Business Overview, Products & Services, Key Insights, Recent Developments, SWOT Analysis, MnM View Might Not Be Captured in Case of Unlisted Companies.
13 Appendix (Page No. - 122)
13.1 Discussion Guide
13.2 Knowledge Store: MarketsandMarkets� Subscription Portal
13.3 Introducing RT: Real-Time Market Intelligence
13.4 Available Customization
13.5 Related Reports
13.6 Author Details
List of Tables (73 Figures)
Table 1 Application Management Services Market: Use Cases
Table 2 Managed Application Services Market Size, By Service, 2015�2022 (USD Million)
Table 3 Operational Services: Market Size, By Region, 2015�2022 (USD Million)
Table 4 Operational Services: Market Size, By Type, 2015�2022 (USD Million)
Table 5 Database Management Market Size, By Region, 2015�2022 (USD Million)
Table 6 Application Performance Management Market Size, By Region, 2015�2022 (USD Million)
Table 7 Application Service Desk: Market Size By Type, 2015�2022 (USD Million)
Table 8 Application Service Desk: Market Size By Region, 2015�2022 (USD Million)
Table 9 Application Packaging Market Size, By Region, 2015�2022 (USD Million)
Table 10 Image and Patch Management Market Size, By Region, 2015�2022 (USD Million)
Table 11 Application Release Management Market Size, By Region, 2015�2022 (USD Million)
Table 12 Application Hosting: Market Size By Region, 2015�2022 (USD Million)
Table 13 Application Security and Disaster Recovery: Market Size By Region, 2015�2022 (USD Million)
Table 14 Application Infrastructure: Market Size By Type, 2015�2022 (USD Million)
Table 15 Application Infrastructure: Market Size By Region, 2015�2022 (USD Million)
Table 16 Web Server Market Size, By Region, 2015�2022 (USD Million)
Table 17 Middleware Market Size, By Region, 2015�2022 (USD Million)
Table 18 Managed Application Services Market Size, By Application Type, 2015�2022 (USD Million)
Table 19 Web-Based Applications: Market Size, By Region, 2015�2022 (USD Million)
Table 20 Mobile Applications: Market Size, By Region, 2015�2022 (USD Million)
Table 21 Market Size, By Organization Size, 2015�2022 (USD Million)
Table 22 Small and Medium-Sized Enterprises: Market Size, By Region, 2015�2022 (USD Million)
Table 23 Large Enterprises: Market Size, By Region, 2015�2022 (USD Million)
Table 24 Market Size By Vertical, 2015�2022 (USD Million)
Table 25 Banking, Financial Services, and Insurance: Market Size By Region, 2015�2022 (USD Million)
Table 26 Telecom and IT: Market Size By Region, 2015�2022 (USD Million)
Table 27 Government: Market Size By Region, 2015�2022 (USD Million)
Table 28 Retail and Ecommerce: Market Size By Region, 2015�2022 (USD Million)
Table 29 Healthcare and Life Sciences: Market Size By Region, 2015�2022 (USD Million)
Table 30 Manufacturing: Market Size By Region, 2015�2022 (USD Million)
Table 31 Energy and Utilities: Market Size By Region, 2015�2022 (USD Million)
Table 32 Others: Market Size By Region, 2015�2022 (USD Million)
Table 33 Managed Application Services Market Size, By Region, 2015�2022 (USD Million)
Table 34 North America: Market Size By Service, 2015�2022 (USD Million)
Table 35 North America: Operational Services Market Size, By Type, 2015�2022 (USD Million)
Table 36 North America: Application Infrastructure Market Size, By Type, 2015�2022 (USD Million)
Table 37 North America: Application Service Desk Market Size, By Type, 2015�2022 (USD Million)
Table 38 North America: Market Size By Application Type, 2015�2022 (USD Million)
Table 39 North America: Market Size By Organization Size, 2015�2022 (USD Million)
Table 40 North America: Market Size By Vertical, 2015�2022 (USD Million)
Table 41 Europe: Managed Application Services Market Size, By Service, 2015�2022 (USD Million)
Table 42 Europe: Operational Services Market Size, By Type, 2015�2022 (USD Million)
Table 43 Europe: Application Infrastructure Market Size, By Type, 2015�2022 (USD Million)
Table 44 Europe: Application Service Desk Market Size, By Type, 2015�2022 (USD Million)
Table 45 Europe: Market Size By Application Type, 2015�2022 (USD Million)
Table 46 Europe: Market Size By Organization Size, 2015�2022 (USD Million)
Table 47 Europe: Market Size By Vertical, 2015�2022 (USD Million)
Table 48 Asia Pacific: Managed Application Services Market Size, By Service, 2015�2022 (USD Million)
Table 49 Asia Pacific: Operational Services Market Size, By Type, 2015�2022 (USD Million)
Table 50 Asia Pacific: Application Infrastructure Market Size, By Type, 2015�2022 (USD Million)
Table 51 Asia Pacific: Application Service Desk Market Size, By Type, 2015�2022 (USD Million)
Table 52 Asia Pacific: Market Size, By Application Type, 2015�2022 (USD Million)
Table 53 Asia Pacific: Market Size, By Organization Size, 2015�2022 (USD Million)
Table 54 Asia Pacific: Market Size, By Vertical, 2015�2022 (USD Million)
Table 55 Middle East and Africa: Managed Application Services Market Size, By Service, 2015�2022 (USD Million)
Table 56 Middle East and Africa: Operational Services Market Size, By Type, 2015�2022 (USD Million)
Table 57 Middle East and Africa: Application Infrastructure Market Size, By Type, 2015�2022 (USD Million)
Table 58 Middle East and Africa: Application Service Desk Market Size, By Type, 2015�2022 (USD Million)
Table 59 Middle East and Africa: Market Size By Application Type, 2015�2022 (USD Million)
Table 60 Middle East and Africa: Market Size By Organization Size, 2015�2022 (USD Million)
Table 61 Middle East and Africa: Market Size By Vertical, 2015�2022 (USD Million)
Table 62 Latin America: Managed Application Services Market Size, By Service, 2015�2022 (USD Million)
Table 63 Latin America: Operational Services Market Size, By Type, 2015�2022 (USD Million)
Table 64 Latin America: Application Infrastructure Services Market Size, By Type, 2015�2022 (USD Million)
Table 65 Latin America: Application Service Desk Market Size, By Type, 2015�2022 (USD Million)
Table 66 Latin America: Market Size By Application Type, 2015�2022 (USD Million)
Table 67 Latin America: Market Size By Organization Size, 2015�2022 (USD Million)
Table 68 Latin America: Market Size By Vertical, 2015�2022 (USD Million)
Table 69 Market Ranking, 2017
Table 70 New Product/Service Launches, 2015�2017
Table 71 Business Expansions, 2015�2017
Table 72 Mergers and Acquisitions, 2015�2017
Table 73 Agreements and Partnerships, 2015�2017
List of Figures (39 Figures)
Figure 1 Global Managed Application Services Market Segmentation
Figure 2 Global Market Research Design
Figure 3 Research Methodology
Figure 4 Market Size Estimation Methodology: Bottom-Up Approach
Figure 5 Market Size Estimation Methodology: Top-Down Approach
Figure 6 Market 2015�2022
Figure 7 Market Analysis
Figure 8 Fastest Growing Segments in the Managed Application Services Market
Figure 9 Increasing Number of Applications is Expected to Drive the Growth of the Market
Figure 10 Mobile Application Type Segment is Expected to Hold A Larger Market Share By 2022
Figure 11 Operational Services Segment is Expected to Hold the Largest Market Share
Figure 12 Large Enterprise Segment is Expected to Hold A Larger Market Share During the Forecast Period
Figure 13 Banking, Financial Services, and Insurance Vertical is Expected to Hold the Largest Market Share By 2022
Figure 14 North America is Estimated to Hold the Largest Market Size in 2017
Figure 15 Market Investment Scenario
Figure 16 Managed Application Services Market: Drivers, Restraints, Opportunities, and Challenges
Figure 17 Number of Smartphone Subscriptions, 2017�2022
Figure 18 Global Network Traffic, 2017 (Exabytes Per Month)
Figure 19 Application Hosting Segment is Expected to Grow at the Highest CAGR During the Forecast Period
Figure 20 Web-Based Applications Segment is Expected to Hold A Larger Market Size During the Forecast Period
Figure 21 Large Enterprises Segment is Expected to Hold A Larger Market Size During the Forecast Period
Figure 22 Retail and Ecommerce Vertical is Expected to Grow at the Highest CAGR During the Forecast Period
Figure 23 Asia Pacific is Expected to Grow at the Highest CAGR During the Forecast Period
Figure 24 North America: Market Snapshot
Figure 25 Asia Pacific: Market Snapshot
Figure 26 Key Developments By Leading Players in the Managed Application Services Market During 2015�2017
Figure 27 Market Evaluation Framework
Figure 28 IBM: Company Snapshot
Figure 29 IBM: SWOT Analysis
Figure 30 Fujitsu: Company Snapshot
Figure 31 Fujitsu: SWOT Analysis
Figure 32 Wipro: Company Snapshot
Figure 33 Wipro: SWOT Analysis
Figure 34 HCL: Company Snapshot
Figure 35 HCL: SWOT Analysis
Figure 36 Unisys: Company Snapshot
Figure 37 Unisys: SWOT Analysis
Figure 38 Centurylink: Company Snapshot
Figure 39 Mindtree: Company Snapshot


Growth opportunities and latent adjacency in Managed Application Services Market