Recloser Control Market by Type (Electric and Hydraulic), Phase Type (Three-Phase, Single-Phase, and Triple-Single Phase), Voltage (Up to 15 Kv, 16 kV–27 Kv, and 28 kV–38 Kv), and Region - Global Forecast to 2022


[129 Pages Report] The global recloser control market reached USD 1.07 Billion in 2016. It is projected to reach USD 1.52 Billion by 2022 growing at a CAGR of 6.22% from 2017 to 2022. Increasing investment in distribution automation for power reliability, expansion of distribution networks, and growth in renewable power generation are some of the factors driving market growth. The recloser control market is segmented on the basis of voltage, phase, type, and region. The years considered for the study are as follows:
- Base Year: 2016
- Estimated Year: 2017
- Projected Year: 2022
- Forecast Period: 2017–2022
The base year considered for company profiles is 2016. Whenever information was unavailable for the base year, the prior year has been considered.
Objectives of the Study
- To define, describe, and forecast the market by voltage, phase, type, and region
- To provide detailed information regarding the major factors influencing the growth of the market (drivers, restraints, opportunities, and industry-specific challenges)
- To strategically analyze the market with respect to individual growth trends, future projections, and the contribution of each segment to the market
- To track and analyze competitive developments such as contracts & agreements, new product launches, expansions & investments, and partnerships & collaborations in the market
- To profile key players and comprehensively analyze their market ranking and core competencies
Research Methodology
This research study involved the use of extensive secondary sources, directories, and databases, such as D&B, Bloomberg Businessweek, and Factiva, to identify and collect information useful for a technical, market-oriented, and commercial study of the recloser control market. Primary sources are mainly industry experts from the core and related industries, preferred suppliers, manufacturers, distributors, service providers, technology developers, standard and certification organizations of companies, and organizations related to all the segments of this industry’s value chain. The points given below explain the research methodology.
- Study of the annual revenue and market developments of major players that provide recloser control
- Assessment of future trends and growth of end-users
- Assessment of the market with respect to the type of technology used for different applications
- Study of contracts and developments related to the market by key players across different regions
- Finalization of overall market sizes by triangulating the supply-side data, which includes product developments, supply chain, and annual revenues of companies supplying recloser control across the globe
After arriving at the overall market size, the total market has been split into several segments and subsegments. The figure given below illustrates the breakdown of primaries conducted during the research study, based on the company type, designation, and region.
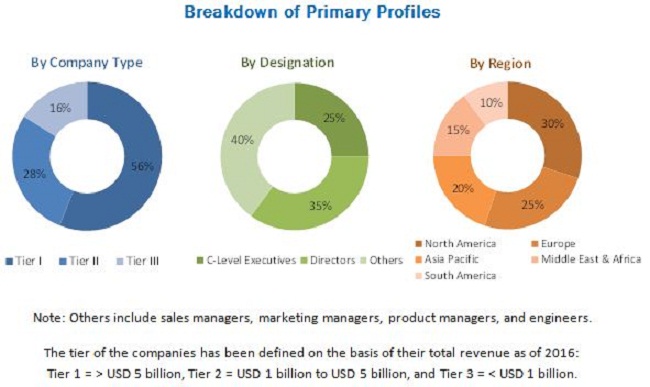
To know about the assumptions considered for the study, download the pdf brochure
Some of the leading global manufacturers of reclosers control are Schneider (France), Eaton (Ireland), ABB (Switzerland), Tavrida (Switzerland), Siemens (Germany), NOJA Power (Australia), and others.
Target Audience:
The report’s target audience includes:
- Transmission and distribution utilities
- State and national regulatory authorities
- Power generation plants
- Consulting companies and associations in the energy and power sector
- Government and research organizations
- Recloser control manufacturers
- Investment banks
- Engineering, procurement, and construction companies in the distribution sector
Scope of the report:
Recloser Control Market:
- By Voltage
- Up to 15 kV
- 16–27 kV
- 28–38 kV
- By Type
- Electric
- Hydraulic
- By Phase
- Single
- Three
- Triple Single
- By Region
- North America
- Europe
- Asia Pacific
- South America
- Middle East
- Africa
Available Customizations:
With the given market data, MarketsandMarkets offers customizations as per the client’s specific needs. The following customization options are available for the report:
Regional Analysis
- Further breakdown of region/country-specific analysis
Company Information
- Detailed analysis and profiling of additional market players (Up to 5)
The global recloser control market is estimated to reach a size of USD 1.12 illion in 2017 and is expected to grow at a CAGR of 6.22% to reach USD 1.52 Billion by 2022. The expansion of distribution networks, increase in use of automated distribution techniques, and rise in the use of power protection equipment to increase reliability and reduce service outages are the main factors driving the market globally.
In this report, the recloser control market is segmented by type into electric and hydraulic recloser controls. The electric recloser control segment is estimated to hold the majority of the market share. These recloser controls are extensively used by utilities in their distribution networks. North America and Europe currently have a market for grid modernization and replacement of old installations and investments in distribution automation across the globe is expected to drive the market.
The recloser control market is further segmented by phase, into single, three, and triple-single. The demand for three-phase recloser control is expected to grow at the highest rate owing to the growth in smart grid infrastructure and an increase in industrialization in developing countries. Three-phase distribution is expected to grow at the highest CAGR in the regions of Asia Pacific and South America, with growth centered in India, China, Brazil, and Argentina.
Based on voltage rating, the market is segmented into to 15 kV, 16–27 kV, and 28–38 kV. Recloser controls with voltage ratings up to 15 kV are expected to grow at the fastest rate during 2017 to 2022. Recloser controls of that voltage capacity are commonly used in distribution lines for residential areas, therefore growing urbanization, increasing investment in smart grids and distribution automation are factors likely to drive this market segment.
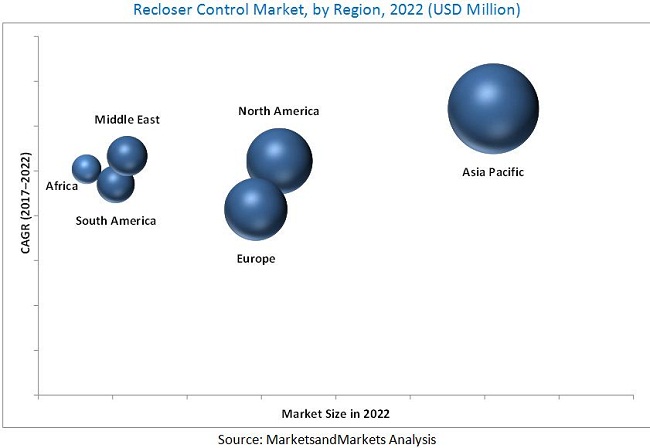
The recloser control market is analyzed with respect to six regions, namely, North America, Europe, Asia Pacific, South America, the Middle East, and Africa. The Asia Pacific region is expected to grow at the highest CAGR during the forecast period due to the increasing demand for electrical energy because of urbanization and industrialization, distribution network upgrades, increasing need for power reliability and distribution automation, as well as large investments in smart grids are expected to drive the market during the forecast period in the region.
The major factor restraining the growth of the recloser control market is the increasing competition from the unorganized sector and the high cost of electric recloser controls. The recloser control industry is very fragmented and offers opportunities for consolidation. This can be seen by the several major mergers and acquisitions (M&A) taking place in the industry.
In this industry, most players are global multinational companies. Some of the leading players in the recloser control market include Eaton (Ireland), Schneider (France), Siemens (Germany), Tavrida (Switzerland), and NOJA Power (Australia). These players have adopted growth strategies such as product launches, contracts & agreements, and expansions to capture a larger share in the market.
To speak to our analyst for a discussion on the above findings, click Speak to Analyst
Table of Contents
1 Introduction (Page No. - 14)
1.1 Objectives of the Study
1.2 Definition
1.3 Market Scope
1.3.1 Market Covered
1.3.2 Regional Scope
1.4 Years Considered for the Study
1.5 Currency
1.6 Stakeholders
2 Research Methodology (Page No. - 17)
2.1 Research Data
2.1.1 Secondary Data
2.1.1.1 Secondary Sources
2.1.2 Primary Data
2.1.2.1 Key Data From Primary Sources
2.1.2.2 Key Industry Insights
2.1.2.3 Breakdown of Primaries
2.2 Market Size Estimation
2.2.1 Bottom-Up Approach
2.2.2 Top-Down Approach
2.3 Market Breakdown & Data Triangulation
2.4 Research Assumptions
3 Executive Summary (Page No. - 25)
4 Premium Insights (Page No. - 29)
4.1 Attractive Opportunities in the Recloser Control Market During the for ecast Period
4.2 Recloser Control Market, By Country
4.3 Asia Pacific Market, By Voltage Rating & Country
4.4 Market, By Type
4.5 Market, By Phase
5 Market Overview (Page No. - 33)
5.1 Introduction
5.2 Market Dynamics
5.2.1 Drivers
5.2.1.1 Increasing Distribution Automation for Power Quality and Reliability
5.2.1.2 Expansion of T&D Networks
5.2.1.3 Growth in Renewable Power Generation
5.2.1.4 Upgradation of Existing Substations and Feeder Line Protection
5.2.2 Restraints
5.2.2.1 High Cost of Recloser Controls
5.2.2.2 Lack of Investments By Governments in Grid Stability
5.2.3 Opportunities
5.2.3.1 Increasing Investments in the Smart Grid Vision
5.2.3.2 Implementation of Performance-Based Incentive Schemes and Guaranteed Service Programs
5.2.4 Challenges
5.2.4.1 Increasing Competition From the Unorganized Sector
6 Market, By Type (Page No. - 39)
6.1 Introduction
6.2 Electric Control
6.3 Hydraulic Control
7 Market, By Phase (Page No. - 43)
7.1 Introduction
7.2 Three-Phase
7.3 Single-Phase
7.4 Triple-Single Phase
8 Market, By Voltage Rating (Page No. - 48)
8.1 Introduction
8.2 Up to 15 Kv
8.3 16–27 Kv
8.4 28–38 Kv
9 Market, By Region (Page No. - 53)
9.1 Introduction
9.2 Asia Pacific
9.2.1 By Phase
9.2.2 By Type
9.2.3 By Voltage Rating
9.2.4 By Country
9.2.5 China
9.2.6 India
9.2.7 Japan
9.2.8 South Korea
9.2.9 Australia
9.2.10 Rest of Asia Pacific
9.3 North America
9.3.1 By Phase
9.3.2 By Type
9.3.3 By Voltage Rating
9.3.4 By Country
9.3.5 US
9.3.6 Canada
9.3.7 Mexico
9.4 Europe
9.4.1 By Phase
9.4.2 By Type
9.4.3 By Voltage Rating
9.4.4 By Country
9.4.5 Russia
9.4.6 UK
9.4.7 France
9.4.8 Germany
9.4.9 Rest of Europe
9.5 Middle East
9.5.1 By Phase
9.5.2 By Type
9.5.3 By Voltage Rating
9.5.4 By Country
9.5.5 Saudi Arabia
9.5.6 UAE
9.5.7 Iran
9.5.8 Rest of the Middle East
9.6 South America
9.6.1 By Phase
9.6.2 By Type
9.6.3 By Voltage Rating
9.6.4 By Country
9.6.5 Brazil
9.6.6 Argentina
9.6.7 Chile
9.6.8 Rest of South America
9.7 Africa
9.7.1 By Phase
9.7.2 By Type
9.7.3 By Voltage Rating
9.7.4 By Country
9.7.5 South Africa
9.7.6 Nigeria
9.7.7 Rest of Africa
10 Competitive Landscape (Page No. - 93)
10.1 Overview
10.2 Ranking of Players and Industry Concentration, 2016
10.3 Competitive Scenario
10.3.1 Contracts & Agreements
10.3.2 New Product Launches
10.3.3 Investments and Expansions
10.3.4 Others
11 Company Profiles (Page No. - 97)
11.1 Benchmarking
11.2 ABB
11.2.1 Business Overview
11.2.2 Products Offered
11.2.3 Recent Developments
11.2.4 Mnm View
11.3 Eaton
11.3.1 Business Overview
11.3.2 Products Offered
11.3.3 Recent Developments
11.3.4 Mnm View
11.4 Schneider Electric
11.4.1 Business Overview
11.4.2 Products Offered
11.4.3 Recent Developments
11.4.4 Mnm View
11.5 Siemens
11.5.1 Business Overview
11.5.2 Products Offered
11.5.3 Mnm View
11.6 Hubbell
11.6.1 Business Overview
11.6.2 Products Offered
11.7 G&W
11.7.1 Business Overview
11.7.2 Products Offered
11.8 GE
11.8.1 Business Overview
11.8.2 Products Offered
11.9 Noja Power
11.9.1 Business Overview
11.9.2 Products Offered
11.9.3 Recent Developments
11.9.4 Mnm View
11.10 Sel
11.10.1 Business Overview
11.10.2 Products Offered
11.10.3 Recent Developments
11.11 Entec
11.11.1 Business Overview
11.11.2 Products Offered
11.12 Tavrida
11.12.1 Business Overview
11.12.2 Products Offered
11.12.3 Recent Developments
11.12.4 Mnm View
11.13 Beckwith Electric
11.13.1 Business Overview
11.13.2 Products Offered
12 Appendix (Page No. - 121)
12.1 Insights of Industry Experts
12.2 Discussion Guide
12.3 Knowledge Store: Marketsandmarkets’ Subscription Portal
12.4 Introducing RT: Real-Time Market Intelligence
12.5 Available Customizations
12.6 Related Reports
12.7 Author Details
List of Tables (64 Tables)
Table 1 Recloser Control Market Snapshot
Table 2 US Smart Grid Investments in 2016
Table 3 Recloser Controls Market, By Type, 2015–2022 (USD Million)
Table 4 Electric Control: Market Size, By Region, 2015–2022 (USD Million)
Table 5 Hydraulic Control: Market Size, By Region, 2015–2022 (USD Million)
Table 6 Recloser Controls Market Size, By Phase Type, 2015–2022 (USD Million)
Table 7 Three-Phase: Market Size, By Region, 2015–2022 (USD Million)
Table 8 Single-Phase: Market Size, By Region, 2015–2022 (USD Million)
Table 9 Triple-Single Phase: Recloser Control Market Size, By Region, 2015–2022 (USD Million)
Table 10 Recloser Controls Market Size, By Voltage Rating, 2015–2022, (USD Million)
Table 11 Up to 15 Kv: Market Size, By Region, 2015–2022 (USD Mllion)
Table 12 16–27 Kv: Market Size, By Region, 2015–2022 (USD Million)
Table 13 28–38 Kv: Market Size, By Region, 2015–2022 (USD Million)
Table 14 Recloser Control Market Size, By Region, 2015–2022 (USD Million)
Table 15 Asia Pacific: Market Size, By Phase, 2015–2022 (USD Million)
Table 16 Asia Pacific: Market Size, By Control Type, 2015–2022 (USD Million)
Table 17 Asia Pacific: Market Size, By Voltage Rating, 2015–2022 (USD Million)
Table 18 Asia Pacific: Market Size, By Country, 2015–2022 (USD Million)
Table 19 China: Market Size, By Type, 2015–2022 (USD Million)
Table 20 India: Market Size, By Type, 2015–2022 (USD Million)
Table 21 Japan: Market Size, By Type, 2015–2022 (USD Million)
Table 22 South Korea: Market Size, By Type, 2015–2022 (USD Million)
Table 23 Australia: Recloser Control Market Size, By Type, 2015–2022 (USD Million)
Table 24 Rest of Asia Pacific: Market Size, By Type, 2015–2022 (USD Million)
Table 25 North America: Market Size, By Phase, 2015–2022 (USD Million)
Table 26 North America: Market Size, By Control Type, 2015–2022 (USD Million)
Table 27 North America: Market Size, By Voltage Rating, 2015–2022 (USD Million)
Table 28 North America: Market Size, By Country, 2015–2022 (USD Million)
Table 29 US: Recloser Control Market Size, By Type, 2015–2022 (USD Million)
Table 30 Canada: Market Size, By Type, 2015–2022 (USD Million)
Table 31 Mexico: Market Size, By Type, 2015–2022 (USD Million)
Table 32 Europe: Market Size, By Phase, 2015–2022 (USD Million)
Table 33 Europe: Market Size, By Control Type, 2015–2022 (USD Million)
Table 34 Europe: Market Size, By Voltage Rating, 2015–2022 (USD Million)
Table 35 Europe: Market Size, By Country, 2015–2022 (USD Million)
Table 36 Russia: Market Size, By Type, 2015–2022 (USD Million)
Table 37 UK: Recloser Control Market Size, By Type, 2015–2022 (USD Million)
Table 38 France: Market Size, By Type, 2015–2022 (USD Million)
Table 39 Germany: Market Size, By Type, 2015–2022 (USD Million)
Table 40 Rest of Europe: Market Size, By Type, 2015–2022 (USD Million)
Table 41 Middle East: Market Size, By Phase, 2015–2022 (USD Million)
Table 42 Middle East: Market Size, By Control Type, 2015–2022 (USD Million)
Table 43 Middle East: Market Size, By Voltage Rating, 2015–2022 (USD Million)
Table 44 Middle East: Recloser Control Market Size, By Country, 2015–2022 (USD Million)
Table 45 Saudi Arabia: Market Size, By Type, 2015–2022 (USD Million)
Table 46 UAE: Market Size, By Type, 2015–2022 (USD Million)
Table 47 Iran: Market Size, By Type, 2015–2022 (USD Million)
Table 48 Rest of the Middle East: Recloser Market Size, By Type, 2015–2022 (USD Million)
Table 49 South America: Recloser Control Market Size, By Phase, 2015–2022 (USD Million)
Table 50 South America: Market Size, By Control Type, 2015–2022 (USD Million)
Table 51 South America: Market Size, By Voltage Rating, 2015–2022 (USD Million)
Table 52 South America: Market Size, By Country, 2015–2022 (USD Million)
Table 53 Brazil: Market Size, By Type, 2015–2022 (USD Million)
Table 54 Argentina: Market Size, By Type, 2015–2022 (USD Million)
Table 55 Chile: Market Size, By Type, 2015–2022 (USD Million)
Table 56 Rest of South America: Market Size, By Type, 2015–2022 (USD Million)
Table 57 Africa: Recloser Control Market Size, By Phase, 2015–2022 (USD Million)
Table 58 Africa: Market Size, By Control Type, 2015–2022 (USD Million)
Table 59 Africa: Market Size, By Voltage Rating, 2015–2022 (USD Million)
Table 60 Africa: Market Size, By Country, 2015–2022 (USD Million)
Table 61 South Africa: Market Size, By Type, 2015–2022 (USD Million)
Table 62 Nigeria: Market Size, By Type, 2015–2022 (USD Million)
Table 63 Rest of Africa: Market Size, By Type, 2015–2022 (USD Million)
Table 64 Noja Power, the Most Active Player in the Recloser Control Market Between the Years 2014 & 2017
List of Figures (34 Figures)
Figure 1 Research Design
Figure 2 Breakdown of Primary Interview: By Company Type, Designation, & Region
Figure 3 Market Size Estimation Methodology: Bottom-Up Approach
Figure 4 Market Size Estimation Methodology: Top-Down Approach
Figure 5 Data Triangulation Methodology
Figure 6 The Electric Segment is Expected to Grow at the Highest Cagr During the for ecast Period
Figure 7 The Three-Phase Segment is Expected to Lead the Recloser Control Market During the for ecast Period
Figure 8 The Up to 15 Kv Segment is Expected to Lead the Market in 2017
Figure 9 Asia Pacific is Expected to Dominate the Market in 2016
Figure 10 Expansion of Distribution Networks & Upgradation of Existing Substations is Driving the Market
Figure 11 The Indian Market is Expected to Grow at the Highest Cagr During the for ecast Period
Figure 12 China & the Up to 15 Kv Segment Dominated the Recloser Control Market in Asia Pacific
Figure 13 The Electric Segment is Expected to Grow at the Highest Cagr During the for ecast Period
Figure 14 The Triple-Single Segment is Expected to Grow at the Highest Cagr During the for ecast Period
Figure 15 Market Dynamics for the Market
Figure 16 Global T&D Investment (2015), By Region
Figure 17 Global Average Annual T&D Investment (New Policies Scenario) 2021–2025, By Country
Figure 18 Renewable Power Generation Capacity (Gw), By Region, 2016–2021
Figure 19 Smart Grid Market By 2022
Figure 20 Electric Segment Dominated the Market in 2016
Figure 21 Three-Phase Recloser Controls Dominated the Recloser Control Market in 2016
Figure 22 The Up to 15 Kv Segment is Expected to Lead the Recloser Control Market During the for ecast Period
Figure 23 Asia Pacific is Expected to Grow at the Highest Cagr During the for ecast Period
Figure 24 Asia Pacific Led the Market in 2016
Figure 25 Asia Pacific: Market Snapshot
Figure 26 North America: Market Snapshot
Figure 27 Key Developments in the Recoser Control Market, 2014–2017
Figure 28 Schneider Electric Led the Market in 2016
Figure 29 ABB: Company Snapshot
Figure 30 Eaton: Company Snapshot
Figure 31 Schneider Electric: Company Snapshot
Figure 32 Siemens: Company Snapshot
Figure 33 Hubbell: Company Snapshot
Figure 34 GE: Company Snapshot 1.1 Objectives of the Study


Growth opportunities and latent adjacency in Recloser Control Market