Top Display Technologies and Devices Market (LED, OLED, Virtual Retinal, Quantum Dot, Flexible Display, Interactive Display, 3D Display and Screenless Display) - Global Forecast to 2022


[182 Pages Report] The top display technologies and devices market is estimated grow at a significant CAGR during the forecast period. The base year used for this study is 2015, and the forecast period considered is between 2016 and 2022.
The objectives of the study are as follows:
- To define, describe, and forecast the display market segmented on the basis of technologies & devices
- To provide market size estimations with respect to four main regions, namely, North America, Europe, Asia-Pacific, and Rest of the World
- To identify and analyze the major factors influencing the growth of the market (drivers, restraints, opportunities, and industry-specific challenges)
- To analyze the key trends that shape and influence the market
- To analyze the market with the technology and market roadmap
- To analyze the opportunities in the market for stakeholders and detail the competitive landscape for the key players
- To strategically profile the key players and comprehensively analyze their market share and core competencies
The research methodology used to estimate and forecast the top display technologies and devices market begins with obtaining data on key vendor revenues through secondary research. Some of the secondary sources used in this research include information from various journals and databases such as IEEE journals, Factiva, Hoover�s, and OneSource. The vendor offerings have also been taken into consideration to determine the market segmentation. The bottom-up procedure has been employed to arrive at the overall size of the top display technologies and devices market from the revenues of the key players in the market. After arriving at the overall market size, the total market has been split into several segments and subsegments, which have then been verified through primary research by conducting extensive interviews of people holding key positions in the industry such as CEOs, VPs, directors, and executives. The market breakdown and data triangulation procedures have been employed to complete the overall market engineering process and arrive at the exact statistics for all segments and subsegments.
The top display technologies and devices ecosystem comprises manufacturers such as LG Display Co., Ltd. (South Korea), Samsung Electronics Co., Ltd. (South Korea), Innolux Corporation (Taiwan), AU Optronics (Taiwan), Avegant Corporation (U.S.), Microvision, Inc. (U.S.), Human Interface Technology Laboratory (U.S.), QD Vision, Inc. (U.S.), Universal Display Corporation (U.S.), Google, Inc. (U.S.) and Panasonic Corporation (Japan) among others. The end users of these display technologies and devices are from a wide range of industries such as consumer, entertainment, industrial, automotive, military & defense and aviation majorly among others.
The Target Audience:
- Semiconductor Product Designers and Fabricators
- Connectivity Providers
- Display Application Providers
- Business Providers
- Display Professional Services/Solutions Providers
- Research Organizations
- Display Technology Standard Organizations, Forums, Alliances, and Associations
- Technology Investors
- Display Materials Manufacturers
- Consultants involved in electronics and display
�The study answers several questions for the target audiences, primarily which market segments to focus on in next two to five years for prioritizing the efforts and investments.�
To know about the assumptions considered for the study, download the pdf brochure
Report Scope:
In this report, the top display technologies and devices market has been segmented into the following categories, which have been detailed below:
Top Display Technologies and Devices Market, by Technology:
- LED
- LED Market, by Application
- LED Market, by Geography
- OLED
- OLED Market, by Type
- OLED Market, by Panel Size
- OLED Market, by Product
- OLED Market, by Geography
- Virtual Retinal Display
- Virtual Retinal Market, by End-user Industry
- Virtual Retinal Market, by Geography
- Quantum Dot Display
- Quantum Dot Market, by Product
- Quantum Dot Market, by Application
- Quantum Dot Market, by Geography
Top Display Technologies and Devices Market, by Device:
- Flexible Display
- Flexible Display Market, by Application
- Flexible Display Market, by Geography
- Interactive Display
- Interactive Display Market, by Product
- Interactive Display Market, by Panel Size
- Interactive Display Market, by Vertical
- Interactive Display Market, by Geography
- 3D Display
- Holographic Display
- Holographic Display Market, by Type
- Holographic Display Market, by Application
- Holographic Display Market, by Geography
- Volumetric Display
- Volumetric Display Market, by Component
- Volumetric Display Market, by Application
- Volumetric Display Market, by Geography
- Holographic Display
- Screenless Display
- Head Mounted Display
- Head Mounted Display Market, by Vertical
- Head Mounted Display Market, by Type
- Head-up Display
- Head Mounted Display
Competitive Landscape: Market Ranking Analysis
Company Profiles: Detailed analysis of the major companies present in the top display technologies and devices market
Available Customizations:
With the given market data, MarketsandMarkets offers customizations according to the company�s specific needs. The following customization options are available for the report:
Company Information
Detailed analysis and profiling of additional market players (up to five)
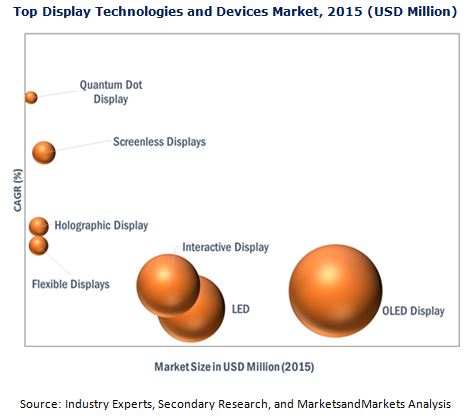
The market for the top technologies and devices market is expected to grow at a significant CAGR during the forecast period. The growth of this market is propelled by the rapid technological advancements and increased need for emerging technologies such as quantum dot and virtual retinal and flexible displays. The scope of this report covers the top display technologies and devices market on the basis of diverse segments such as product, industry, application, and geography.
The market for quantum dot displays is expected to grow at the highest rate during the forecast period. Though the technology is still in the nascent stage, it has a huge potential to grow in the coming years. The growing demand for superior performance and resolution quality as well as cost-effective products is the major driver for the market to grow further in the coming years. On the other hand, the slower adoption of this technology due to lack of awareness is acting as a restraining factor.
Virtual retinal technology is another segment which offers huge opportunities for diverse applications in the current era. The shifting business focus to disruptive technologies, financial advantages, potential applications of VRDs in diverse industries, growing demand for low power consuming portable devices, and increasing acceptance of wearable devices are some of the key factors expected to drive the growth of the virtual retinal display market globally.
In 2015, North America held the largest share of the top display technologies and devices market. In addition, the presence of major industries and companies is driving the demand for signaling devices in the region. The APAC region held the second-largest share of the top display technologies and devices market.
This report describes the drivers, restraints, opportunities, and challenges pertaining to the top display technologies and devices market. In addition, it analyzes the current scenario and forecasts the market size till 2022.
The key manufacturers of top display technologies and devices market include LG Display Co., Ltd. (South Korea), Samsung Electronics Co., Ltd. (South Korea), Innolux Corporation (Taiwan), AU Optronics (Taiwan), Avegant Corporation (U.S.), Microvision, Inc. (U.S.), Human Interface Technology Laboratory (U.S.), QD Vision, Inc. (U.S.), Universal Display Corporation (U.S.), Google, Inc. (U.S.) and Panasonic Corporation (Japan), among others.
To speak to our analyst for a discussion on the above findings, click Speak to Analyst
Table of Contents
1 Introduction (Page No. - 17)
1.1 Objectives of the Study
1.2 Market Definition
1.2.1 Display Technologies
1.2.1.1 LED Display
1.2.1.2 OLED Display
1.2.1.3 Virtual Retinal Display
1.2.1.4 Quantum Dot Display
1.2.2 Display Devices
1.2.2.1 Flexible Display
1.2.2.2 Interactive Display
1.2.2.3 3D Display
1.2.2.3.1 Holographic Display
1.2.2.3.2 Volumetric Display
1.2.2.4 Screenless Display
1.2.2.4.1 Head Mounted Display
1.2.2.4.2 Head-Up Display
1.3 Study Scope
1.3.1 Markets Covered
1.3.2 Years Considered for the Study
1.4 Currency
1.5 Stakeholders
2 Research Methodology (Page No. - 21)
2.1 Research Data
2.1.1 Secondary Data
2.1.1.1 Key Data From Secondary Sources
2.1.2 Primary Data
2.1.2.1 Key Data From Primary Sources
2.2 Market Size Estimation
2.3 Market Breakdown and Data Triangulation
2.4 Assumptions
3 Executive Summary (Page No. - 27)
4 Premium Insights (Page No. - 31)
4.1 Quantum Dot Display Market, By Product
4.2 OLED Display Market, By Type
4.3 Screenless Display Market, By Type
4.4 Volumetric Display Market, By Region
4.5 Interactive Display Market, By Product
4.6 Flexible Display Market, By Application
4.7 Virtual Retinal Display Market, By Region
5 Market Overview (Page No. - 36)
5.1 Introduction
5.2 Value Chain Analysis
5.3 Market Segmentation
5.3.1 Display Market, By Technology
5.3.2 Display Market, By Device
6 Top Display Technologies (Page No. - 40)
6.1 Introduction
6.2 Light Emitting Diode Display (LED)
6.2.1 Overview
6.2.1.1 Conventional LED Display
6.2.1.2 Surface Mounted Display
6.2.2 Market Dynamics
6.2.2.1 Drivers
6.2.2.1.1 High Quality Picture Images
6.2.2.1.2 Power Efficiency
6.2.2.2 Restraints
6.2.2.2.1 Expensive Products
6.2.2.2.2 Shortage of the Metalorganic Chemical Vapor Deposition (Mocvd) Tool
6.2.2.3 Opportunities
6.2.2.3.1 Growing Demand in Backlighting
6.2.2.3.2 Incandescent Bulb Loss is LED�s Gain
6.2.3 LED Display Market, By Application
6.2.4 LED Display Market, By Geography
6.2.5 Competitive Landscape
6.2.5.1 Ranking of Players
6.3 Organic Light Emitting Diode Display (OLED)
6.3.1 Overview
6.3.2 Market Dynamics
6.3.2.1 Drivers
6.3.2.1.1 Adoption of OLED Technology in Smartphones
6.3.2.1.2 Rapid Technological Advancements
6.3.2.1.3 Government Support for OLED Lighting Research
6.3.2.1.4 Increasing Number of Applications
6.3.2.2 Restraints
6.3.2.2.1 Low Market Acceptance for OLED Fixtures
6.3.2.2.2 Complex Value Chain
6.3.2.2.3 High Growth Rate of the LED Lighting Market
6.3.2.3 Opportunities
6.3.2.3.1 Growing Investments in the OLED Market
6.3.2.3.2 Increasing Potential for AMOLED TVs
6.3.2.4 Challenges
6.3.2.4.1 Challenges From Complementary Technologies
6.3.3 OLED Display Market, By Type
6.3.3.1 Pmoled Display
6.3.3.2 AMOLED Display
6.3.4 OLED Display Market, By Panel Size
6.3.4.1 Small-Sized OLED Panels
6.3.4.2 Medium-Sized OLED Panels
6.3.4.3 Large-Sized OLED Panels
6.3.5 OLED Display Market, By Product
6.3.5.1 Smartphones
6.3.5.2 Television
6.3.5.3 Notebooks and Tablets
6.3.5.4 Wearables
6.3.5.5 Automotive Products
6.3.5.6 Others
6.3.6 OLED Display Market, By Geography
6.3.6.1 The Americas
6.3.6.2 Europe
6.3.6.3 Asia�Pacific (APAC)
6.3.6.4 Rest of the World (RoW)
6.3.7 Competitive Landscape
6.3.7.1 Ranking of Players
6.4 Virtual Retinal Display
6.4.1 Overview
6.4.2 Market Dynamics
6.4.2.1 Drivers
6.4.2.1.1 Fast Growing Virtual Reality and Augmented Reality Applications in Gaming, Entertainment, and Other End-User Industries
6.4.2.1.2 Greater Clarity, Low Manufacturing Cost, and Reduced Power Consumption Could Help to Reduce Screen-Based Displays Used By an Individual
6.4.2.2 Restraints
6.4.2.2.1 Potential Hazards of Scanning the Laser Light Directly Onto A Human Eye
6.4.2.2.2 Difficulties in Interpersonal Communication Due to Covered Eyes
6.4.2.3 Opportunities
6.4.2.3.1 Demand for Products That Consume Less Power
6.4.2.3.2 Growing Need of Online Personal Assistance Amongst Smartphone Users
6.4.2.3.3 Reducing the Number of Screens Used By an Individual
6.4.2.4 Challenges
6.4.2.4.1 Development of A Virtual Retinal Display That is Suitable for All Weather Conditions
6.4.3 Virtual Retinal Display Market, By End-User Industry
6.4.3.1 Aviation & Tactical
6.4.3.2 Engineering
6.4.3.3 Medical
6.4.3.4 Gaming & Entertainment
6.4.3.5 Sports
6.4.3.6 Training & Simulation
6.4.3.7 Others
6.4.4 Virtual Retinal Display Market, By Geography
6.4.4.1 North America
6.4.4.2 Europe
6.4.4.3 Asia�Pacific (APAC)
6.4.4.4 Rest of the World (RoW)
6.4.5 Competitive Landscape
6.4.5.1 Ranking of Players
6.5 Quantum Dot Display
6.5.1 Overview
6.5.2 Market Dynamics
6.5.2.1 Drivers
6.5.2.1.1 Growing Demand of Quantum Dots for Superior Performance and Resolution Quality
6.5.2.1.2 Quantum Dot Nanomaterial is Used as an Energy Efficient Technology
6.5.2.1.3 Cost Effective Silicon Dioxide Quantum Dot Based LEDs
6.5.2.1.4 Need of the Ultra-Low Power Vlsi Design
6.5.2.2 Restraints
6.5.2.2.1 Slow Adoption of Technology Due to the Lack of Awareness Among Consumers
6.5.2.2.2 Expensive Products
6.5.2.2.3 Reduced Prices May Impact the Launch of QD Products
6.5.2.3 Opportunities
6.5.2.3.1 Penetration of Quantum Dots Technology in Defense and Security Applications
6.5.2.3.2 High Penetration of QD in Industrial Sector
6.5.2.3.3 Quantum Dot is Preferred By Display and Lighting Industries
6.5.2.4 Challenges
6.5.2.4.1 Raw Material Availability
6.5.2.4.2 Utilization of Heavy Metals as Raw Material
6.5.3 Quantum Dot Market, By Product
6.5.3.1 QD Display
6.5.3.2 QD Medical Devices
6.5.3.3 Others
6.5.4 Quantum Dot Market, By Application
6.5.4.1 Consumer
6.5.4.2 Healthcare
6.5.4.3 Defense
6.5.4.4 Industrial
6.5.5 Quantum Dot Market, By Geography
6.5.5.1 North America
6.5.5.2 Europe
6.5.5.3 Asia�Pacific (APAC)
6.5.5.4 Rest of the World (RoW)
7 Top Display Devices (Page No. - 83)
7.1 Introduction
7.2 Flexible Display
7.2.1 Overview
7.2.2 Market Dynamics
7.2.2.1 Drivers
7.2.2.1.1 Rise in the Consumer Goods Industry
7.2.2.1.2 Distinctive Features of Flexible Display
7.2.2.2 Restraints
7.2.2.2.1 Competing Technologies
7.2.2.2.2 Manufacturing Challenges
7.2.2.3 Opportunities
7.2.2.3.1 Penetration in Multiple Applications
7.2.2.3.2 Increasing Usage in Digital Signage Applications
7.2.2.4 Challenge
7.2.2.4.1 Adoption of an Ideal Manufacturing Process
7.2.3 Flexible Display Market, By Application
7.2.3.1 E-Reader
7.2.3.2 Smartphone
7.2.3.3 Tablet
7.2.3.4 Laptop
7.2.3.5 E-Paper
7.2.3.6 Wearable Display
7.2.3.7 Smart Card
7.2.3.8 Pop/Electronic Shelf Labels (ESL)
7.2.3.9 Television
7.2.4 Flexible Display Market, By Geography
7.2.4.1 The Americas
7.2.4.2 Europe
7.2.4.3 Asia�Pacific (APAC)
7.2.5 Competitive Landscape
7.2.5.1 Ranking of Players
7.3 Interactive Display
7.3.1 Overview
7.3.2 Market Dynamics
7.3.2.1 Drivers
7.3.2.1.1 Assured Roi From Interactive Display Products
7.3.2.1.2 Decreasing Prices and Increasing Panel Size With High Resolution
7.3.2.1.3 Increased Customer Engagement With Hd Displays
7.3.2.1.4 Growing Adoption of Interactive Displays in Retail Sector
7.3.2.1.5 Dynamic Nature of Interactive Displays Leads to Enhanced Customer Experience
7.3.2.2 Restraints
7.3.2.2.1 High Costs Incurred for Customization of Touch Tables
7.3.2.2.2 Low Implementation of Interactive Whiteboards (IWBS) in the Education Sector
7.3.2.3 Opportunities
7.3.2.3.1 Growth Opportunity in Healthcare and Entertainment Applications
7.3.2.3.2 Increasing Trend for Using Interactive Displays in Trade Shows and Events
7.3.2.4 Challenges
7.3.2.4.1 Producing Equipment Suitable for All Weathers in Outdoor Applications
7.3.2.4.2 Lack of Skilled Programmers to Develop Software Applications for Multi-Touch Interactive Displays
7.3.3 Interactive Display Market, By Product
7.3.3.1 Interactive Kiosks
7.3.3.2 Interactive Whiteboard
7.3.3.3 Interactive Table
7.3.3.4 Interactive Video Wall
7.3.3.5 Interactive Monitor
7.3.3.6 Interactive Flat-Panel Display
7.3.4 Interactive Display Market, By Panel Size
7.3.4.1 17� �32� Panel Size
7.3.4.2 32��65� Panel Size
7.3.4.3 65� and Above Panel Size
7.3.5 Interactive Display Market, By Vertical
7.3.5.1 Retail
7.3.5.2 Hospitality
7.3.5.3 Industrial
7.3.5.4 Healthcare
7.3.5.5 Government and Corporate
7.3.5.6 Transportation
7.3.5.7 Education
7.3.5.8 Entertainment
7.3.5.9 Other Verticals
7.3.6 Interactive Display Market, By Geography
7.3.6.1 The Americas
7.3.6.2 Europe
7.3.6.3 Asia�Pacific (APAC)
7.3.6.4 Rest of the World (RoW)
7.3.7 Competitive Landscape
7.3.7.1 Ranking of Players
7.4 3D Display
7.4.1 Introduction
7.4.2 Holographic Display
7.4.2.1 Market Dynamics
7.4.2.1.1 Drivers
7.4.2.1.1.1 Adoption of Holographic Displays in Multiple Industries
7.4.2.1.1.2 Increased Demand of Holographic Displays in Events and Advertisements
7.4.2.1.1.3 Holography for Medical Imaging in the Healthcare Industry
7.4.2.1.2 Restraints
7.4.2.1.2.1 Less Effective Projection Under Sunlight
7.4.2.1.2.2 Cost Affecting the Growth of Holographic Displays
7.4.2.1.3 Opportunities
7.4.2.1.3.1 Advancements in Holographic Displays
7.4.2.1.3.2 Rapidly Advancing Smartphone and Tablet Market
7.4.2.1.4 Challenges
7.4.2.1.4.1 Technological Concerns
7.4.2.1.4.2 Growing Demand of Quantum Dots for Superior Performance and Resolution Quality for Laptops, Tablets, Smart TVs, Cameras, and Mobile Devices
7.4.2.2 Holographic Display Market, By Product Type
7.4.2.2.1 Digital Signage
7.4.2.2.2 Kiosks
7.4.2.2.3 Medical Imaging/Scanners
7.4.2.2.3.1 Computed Tomography (CT) and Magnetic Resonance Imaging (MRI)
7.4.2.2.3.2 Ultrasound
7.4.2.2.4 Smart Tv�s/Holo Tv�s
7.4.2.2.5 Others
7.4.2.2.5.1 Smart Watch
7.4.2.2.5.2 Smart Glasses
7.4.2.2.5.3 Smartphones
7.4.2.3 Holographic Display Market, By Application
7.4.2.3.1 Consumer Applications
7.4.2.3.2 Commercial Applications
7.4.2.3.3 Medical
7.4.2.3.4 Defense
7.4.2.3.5 Industrial Applications
7.4.2.3.6 Other Applications
7.4.2.3.6.1 Education
7.4.2.3.6.2 Automotive
7.4.2.4 Holographic Display Market, By Geography
7.4.2.4.1 North America
7.4.2.4.2 Europe
7.4.2.4.3 Asia�Pacific (APAC)
7.4.2.4.4 Rest of the World (RoW)
7.4.3 Competitive Landscape
7.4.3.1 Key Innovators
7.4.4 Volumetric Display
7.4.4.1 Market Dynamics
7.4.4.1.1 Drivers
7.4.4.1.1.1 Need for Advanced Medical Imaging Devices for Better Treatment Will Drive the Volumetric Display Market
7.4.4.1.1.2 Technological Advancements in 3D Displays
7.4.4.1.2 Restraints
7.4.4.1.2.1 Requirement of Advanced Software and Electronic Components
7.4.4.1.2.2 The Cost Factor Affecting the Growth of Volumetric Displays Market
7.4.4.1.3 Opportunities
7.4.4.1.3.1 Commercialization of the Volumetric Display Market
7.4.4.1.3.2 Potential Application of Volumetric Displays in Telemedicine and Surgery
7.4.4.1.3.3 Advancements in the Volumetric Display Technology for Applications in Consumer Service Sector
7.4.4.1.4 Challenges
7.4.4.1.4.1 Lack of Technological Awareness
7.4.4.2 Volumetric Display Market, By Component
7.4.4.2.1 Projector
7.4.4.2.2 Motor & Position Sensor
7.4.4.2.3 Mirror
7.4.4.2.4 Others
7.4.4.2.4.1 Rendering Software
7.4.4.2.4.2 Rendering Electronics
7.4.4.3 Volumetric Display Market, By Application
7.4.4.3.1 Medical
7.4.4.3.2 Aerospace & Defense
7.4.4.3.3 Automotive
7.4.4.3.4 Oil & Gas
7.4.4.3.5 Others
7.4.4.3.5.1 Education
7.4.4.3.5.2 Entertainment
7.4.4.4 Volumetric Display Market, By Geography
7.4.4.4.1 North America
7.4.4.4.2 Europe
7.4.4.4.3 Asia�Pacific (APAC)
7.4.4.4.4 Rest of the World (RoW)
7.4.5 Competitive Landscape
7.4.5.1 Ranking of Players
7.5 Screenless Display
7.5.1 Overview
7.5.2 Market Dynamics
7.5.2.1 Drivers
7.5.2.1.1 Space Constraint and Portability Issues Related to Screen-Based Displays
7.5.2.1.2 Smart and Attractive Alternative for Screen-Based Displays
7.5.2.1.3 Complete Privacy Can Be Achieved By Using Retinal Direct Form of Screenless Displays
7.5.2.2 Restraints
7.5.2.2.1 Not Yet Fully Commercialized Market. More Advancement and Awareness is Required
7.5.2.2.2 Market Concentration Only in the U.S.
7.5.2.2.3 High Capital Investment Required for the Development of Screenless Displays
7.5.2.3 Opportunities
7.5.2.3.1 Fast Growing Gaming Market
7.5.2.3.2 Demand for Products That Consume Less Power
7.5.2.4 Challenge
7.5.2.4.1 Development of A Screenless Display Suitable in All Weather Conditions
7.5.3 Screenless Display Market, By Application
7.5.3.1 Head Mounted Display
7.5.3.2 Head-Up Display
8 Company Profile (Page No. - 144)
8.1 Introduction
(Business Overview, Products & Services, Key Insights, Recent Developments, SWOT Analysis, Ratio Analysis, MnM View)*
8.2 LG Display Co., Ltd.
8.3 Samsung Electronics Co., Ltd
8.4 Innolux Corp.
8.5 AU Optronics Corp.
8.6 Avegant Corporation
8.7 Microvision, Inc.
8.8 Human Interface Technology Laboratory
8.9 QD Vision, Inc.
8.10 Nanosys, Inc.
8.11 Quantum Material Corporation
8.12 Universal Display Corp.
8.13 Panasonic Corporation
8.14 NEC Display Solutions Ltd.
8.15 E Ink Holginds, Inc.
8.16 3D Icon Corp.
8.17 Vuzix Corporation
8.18 Google, Inc.
8.19 Displair, Inc.
8.20 Zebra Imaging, Inc.
*Details on Business Overview, Products & Services, Key Insights, Recent Developments, SWOT Analysis, MnM View Might Not Be Captured in Case of Unlisted Companies.
9 Appendix (Page No. - 178)
9.1 Knowledge Store: Marketsandmarkets� Subscription Portal
9.2 Introducing RT: Real-Time Market Intelligence
9.3 Available Customizations
9.4 Author Details
List of Tables (33 Tables)
Table 1 LED Display, By Size
Table 2 LED Display Market, By Application, 2013�2022 (USD Million)
Table 3 LED Display Market, By Region, 2013�2022 (USD Million)
Table 4 Ranking Analysis of the Top Players in LED Market, 2015
Table 5 OLED Display Market, By Type, 2013�2022 (USD Million)
Table 6 OLED Display Market, By Panel Size, 2013�2022 (USD Million)
Table 7 OLED Display Market, By Product, 2013�2022 (USD Million)
Table 8 OLED Display Market, By Region, 2013�2022 (USD Million)
Table 9 Ranking Analysis of the Top Players in OLED Market, 2015
Table 10 Virtual Retinal Display Market, By End-User Industry, 2016�2025 (USD Thousand)
Table 11 Virtual Retinal Display Market, By Region, 2016�2025 (USD Thousand)
Table 12 Ranking Analysis of the Top Players in Virtual Retinal Display Market, 2016
Table 13 Quantum Dot Display Market, By Product, 2013-2022 (USD Million)
Table 14 Quantum Dot Display Market, By Application, 2013-2022 (USD Million)
Table 15 Quantum Dot Display Market, By Region, 2013-2022 (USD Million)
Table 16 Flexible Display Market, By Application, 2013�2022 (USD Million)
Table 17 Flexible Display Market, By Region, 2013�2022 (USD Million)
Table 18 Ranking Analysis of the Top Players in Flexible Display Market, 2015
Table 19 Interactive Display Market, By Product, 2013�2022 (USD Million)
Table 20 Interactive Display Market, By Panel Size, 2013�2022 (USD Million)
Table 21 Interactive Display Market, By Vertical, 2013�2022 (USD Million)
Table 22 Interactive Display Market, By Region, 2013�2022 (USD Million)
Table 23 Ranking Analysis of the Top Players in Interactive Display Market, 2015
Table 24 Holographic Display Market, By Product, 2013�2022 (USD Million)
Table 25 Holographic Display Market, By Application, 2013�2022 (USD Million)
Table 26 Holographic Display Market, By Region, 2013 � 2022 (USD Million)
Table 27 Prominent Players in the Holographic Display Market, 2015
Table 28 Volumetric Display Market, By Component, 2013 � 2022 (USD Million)
Table 29 Volumetric Display Market, By Application, 2013 � 2022 (USD Million)
Table 30 Volumetric Display Market, By Region, 2013 � 2022 (USD Million)
Table 31 Ranking Analysis of the Top Players in Volumetric Display Market, 2015
Table 32 Head Mounted Screenless Display Market, By Vertical, 2014�2022 (USD Thousand)
Table 33 Head Mounted Screenless Display Market, By Type, 2014�2022 (USD Thousand)
List of Figures (61 Figures)
Figure 1 Research Methodology
Figure 2 Bottom-Up Approach
Figure 3 Top-Down Approach
Figure 4 Data Triangulation
Figure 5 Quantum Dot Displays Expected to Witness the Highest Growth Rate Between 2016 and 2022
Figure 6 QD Display Device Products to Hold the Leading Position Between 2016 and 2022
Figure 7 AMOLED Display Technology to Continue to Lead the OLED Technology Market Between 2016 and 2022
Figure 8 Visual Image Screenless Display Held the Largest Market Share During the Forecast Period
Figure 9 North America Expected to Grow at A Significant Rate Between 2016 and 2022
Figure 10 Interactive Flat Panel Displays is Expected to Grow at Highest CAGR During the Forecast Period
Figure 11 Smartphone Application is Expected to Grow at A Fastest Rate Between 2016 and 2022
Figure 12 North America Expected to Lead the Virtual Retinal Display Market Throughout the Forecast Period
Figure 13 Value Chain Analysis: Major Value is Added During Manufacturing and Assembly Phases, 2015
Figure 14 Major Display Technologies
Figure 15 LED Display Market Classification, By Type
Figure 16 Drivers, Restraints & Opportunities for the LED Market
Figure 17 Drivers, Restraints, Opportunities & Challenges for the OLED Market
Figure 18 AMOLED Display Held the Largest Size of the OLED Display Market in 2016
Figure 19 Small-Sized Panel Held the Largest Size of the OLED Display Market in 2016
Figure 20 Smartphones Held the Largest Size of the OLED Display Market in 2016
Figure 21 OLED Display Market in Europe Expected to Grow at the Highest Rate Between 2016 and 2022
Figure 22 Drivers, Restraints, Opportunities & Challenges of Virtual Retinal Display Market
Figure 23 VRD Market By End-User Industry
Figure 24 Year of Adoption of VRD Technology By End-User Industries and Potential Driving Factors
Figure 25 Drivers, Restraints, Opportunities & Challenges of Quantum Dot Display Market
Figure 26 Quantum Dot Market Segmentation, By Product
Figure 27 Quantum Dots Market Segmentation, By Application
Figure 28 Major Display Devices
Figure 29 Drivers, Restraints, Opportunities & Challenges for the Flexible Display Market
Figure 30 Flexible Display Market Segmentation, By Application
Figure 31 Americas to Lead the Flexible Display Market Size Between 2016 and 2022
Figure 32 Drivers, Restraints, Opportunities & Challenges for Interactive Display Market
Figure 33 Interactive Display Market Segmentation, By Product
Figure 34 Flat-Panel Display to Hold the Largest Size in the Interactive Display Market Between 2016 and 2022
Figure 35 Interactive Display Market, By Panel Size
Figure 36 Interactive Display With Panel Size 32�� 65� to Hold the Largest Size Between 2016 and 2022
Figure 37 Interactive Display Market Segmentation, By Vertical
Figure 38 Education Vertical to Hold the Largest Size of the Interactive Display Market Between 2016 and 2022
Figure 39 China Expected to Be Amongst the Fastest-Growing Markets for Interactive Display Between 2016 and 2022
Figure 40 Attractive Growth Opportunities in the Healthcare Vertical During the Forecast Period
Figure 41 3D Displays Market Segmentation
Figure 42 Drivers, Restraints, Opportunities & Challenges of Holographic Display Market
Figure 43 Holographic Display Market Segmentation, By Product Type
Figure 44 Holographic Display Market Segmentation, By Application
Figure 45 Geographic Snapshot (2014)- the Rapidly Growing Markets are Emerging as New Hot Spots
Figure 46 Country-Wise Growth for the Holographic Display Applications Segment
Figure 47 Drivers, Restraints, Opportunities & Challenges for the Volumetric Display Market
Figure 48 Volumetric Display Market Segmentation, By Component
Figure 49 Volumetric Display Market Segmentation, By Application
Figure 50 Drivers, Restraints, Opportunities & Challenges for the Screenless Display Market
Figure 51 Screenless Display Market Segmentation, By Application
Figure 52 LG Display Co., Ltd.: Company Snapshot
Figure 53 Samsung Electronics Co., Ltd.: Company Snapshot
Figure 54 Innolux Corp.: Company Snapshot
Figure 55 AU Optronics Corp.: Company Snapshot
Figure 56 Microvision Inc.: Company Snapshot
Figure 57 Universal Display Corp.: Company Snapshot
Figure 58 Panasonic Corporation: Company Snapshot
Figure 59 E Ink Holgings, Inc.: Company Snapshot
Figure 60 Vuzix Corporation: Company Snapshot
Figure 61 Google Inc.: Company Snapshot


Growth opportunities and latent adjacency in Top Display Technologies and Devices Market