Solid Oxide Fuel Cell Market

Solid Oxide Fuel Cell Market by Type (Planar, Tubular), Component (Stack, BOP), Application (Stationary, Portable, Transport), End User (Commercial & Industrial, Data Centers, Military & Defense, Residential) & Region - Global Trends & Forecasts to 2028

Report Code: EP 2467 Oct, 2023, by marketsandmarkets.com

Solid Oxide Fuel Cell Market Size, Share, Growth Report & Forecast

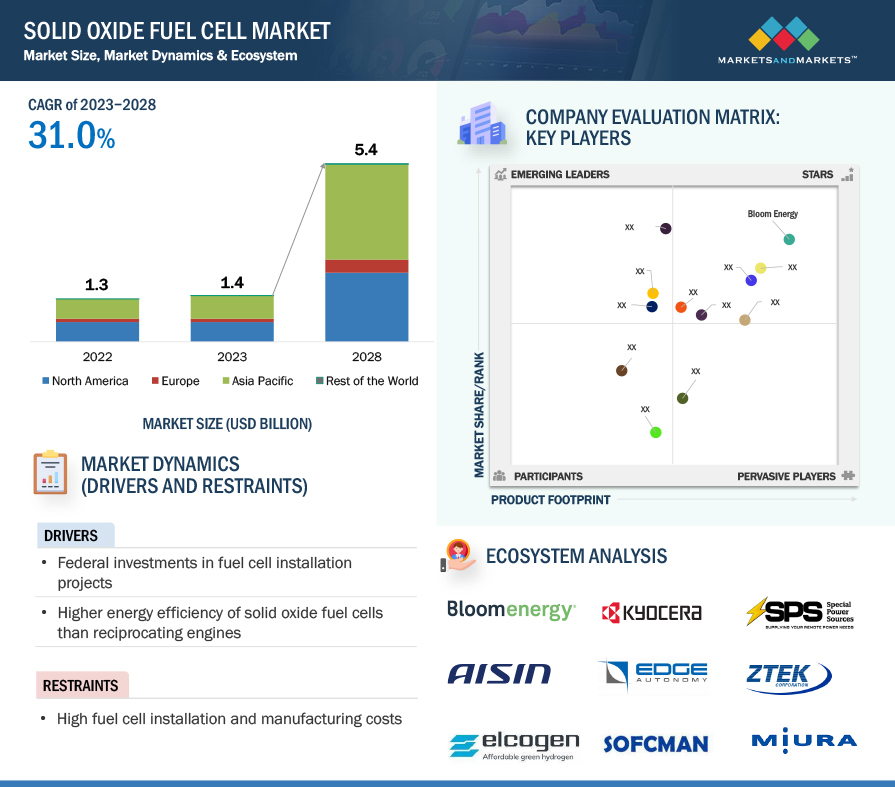
[239 Pages Report] The global Solid oxide fuel cell market is estimated to grow from USD 1.4 billion in 2023 to USD 5.4 billion by 2028; it is expected to record a CAGR of 31.0% during the forecast period. The supportive government policies and subsidies for R&D and applications such as power generation play a vital role in the growth of solid oxide fuel cell market. Furthermore, Japan and South Korea are the prime country-level markets in Asia Pacific owing to the large commercialization of SOFC in the regions.
Solid Oxide Fuel Cell Market

To know about the assumptions considered for the study, Request for Free Sample Report
Solid Oxide Fuel Cell Market

To know about the assumptions considered for the study, download the pdf brochure

Solid Oxide Fuel Cell Market Growth Dynamics

Driver: Introduction of stringent carbon emission norms

SOFC is a clean technology incorporating conventional fuels, such as natural gas. They have a negligible level of carbon emissions than other types of natural gas-fired technologies used typically for power generation. This is due to the direct conversion of chemical energy into electrical energy without a combustion process. One of the key drivers for the demand for low-emission technologies, such as SOFC, is stringent carbon emission norms prevalent across multiple regions. North America, Europe, and Asia Pacific have formulated several strict regulations to limit carbon emissions from power generation operations. Such regulations also specify the permissible diesel generator noise levels to reduce noise pollution caused by diesel genset operations. Different countries/regions have their own set of regulations and policies.

For instance, the European Union has set a target of reducing carbon emissions and related pollution by 20% by 2030. In the US, stringent norms for carbon emissions have been a driver for the growth of SOFCs. In addition, the growing awareness regarding the impact of carbon emissions on climate change has influenced end users to incorporate clean energy sources into their energy mix. Electricity and heat generation accounted for the absolute rise in emissions in 2022. Emissions from the combined heat and power (CHP) sectors increased by 1.8% (or 261 Mt), hitting an all-time high of 14.6 Gt. Gas-to-coal conversion was the primary driver of this expansion in many regions: CO2 emissions from coal-fired power generation increased by 2.1%, especially in emerging and developing nations. Natural gas emissions in the power sector stayed close to 2021 levels. The rapid deployment of renewables across all regions resulted in a continued drop in carbon intensity, with renewables meeting 90% of worldwide growth in energy demand. Solar PV and wind generation grew by about 275 TWh, resulting in an estimated 465 Mt reduction in power sector emissions. Thus, stringent norms for carbon emissions have been a driver for the growth of SOFCs.

Restraint: Availability of alternatives

SOFCs have a smaller market share in the overall fuel cell market due to the limited number of end-use applications they can cater to. The market is dominated by proton exchange membrane fuel cells (PEMFC), which have at least 65% of the global market share because of their versatile usage in various end-use segments. PEMFC and direct methanol fuel cells (DMFC) are better suited for military applications, especially in portable and unmanned systems, as they operate at lower temperatures. Other technologies, such as molten carbonate fuel cells (MCFC) and phosphoric acid fuel cells (PAFC), compete with SOFC technology in the US, Japan, and South Korea. MCFC technology is in stiff competition with SOFC regarding installation cost per kilowatt and applications, such as combined heat and power (CHP) and power.

Opportunities:  Increasing electricity consumption in data centers

Data centers and commercial & industrial sectors are among the fastest-growing end users of power generation solutions in the US. Data centers are highly power-consuming and power-intensive. Additionally, data centers require uninterrupted power to minimize the loss of valuable data.

According to the International Energy Agency (IEA), electricity consumption from data centers in 2022 was estimated to be approximately 240–340 TWh, or almost 1–1.3% of the demand for electricity worldwide. Due to the high power consumption, data centers opt for cost reductions by adopting distributed power generation, particularly fuel cells. Fuel cells, including SOFCs, have previously seen tremendous growth in the US. Its adoption for data centers by Google (US), IBM (US), and Equinix (US) has stimulated growth at the fastest rate. Currently, the overall SOFC adoption by data centers is still minuscule with respect to the total data centers in the US, making it one of the most lucrative businesses. In the military sector, stationary and portable power generation by SOFCs is on the rise. Additionally, the need for noiseless and efficient power generation for military applications creates an opportunity for SOFCs in this segment. Military & defense end users are increasingly adopting SOFC-powered devices for portable applications.

Challenges: Fuel cell degradation and carbon dusting

Many challenges are associated with solid oxide fuel cells as they operate at high temperatures of around 1,000°C. Maintaining the temperature is directly related to performance, and the possibility of material degradation poses a significant challenge. The difference in oxygen partial pressures creates the need for different materials for the anode and cathode, making material stability crucial. Maintaining the stability of solid electrolytes in low-oxygen partial pressures and minimizing the chances of electrolytes reacting with other components are also areas of concern. The possibility of degradation, caused by changes in the size and shape of nickel particles due to sintering and morphological changes in the anode, creates stress and leads to fuel impurities and cracking during redox cycling.

Also, maintaining stability in interconnects in oxidizing and reducing environments, as they are exposed to anode and cathode, is challenging. Ceramic interconnects provide higher stability than metallic interconnects but at a higher cost. One of the concerns while using ceramic interconnects is carbon dusting. Finally, ensuring the matching of the coefficient of thermal expansion of sealant with other SOFC components is also crucial. These material challenges associated with solid oxide fuel cells will likely pose a significant challenge for the SOFC market.

Solid oxide fuel cell Market Ecosystem

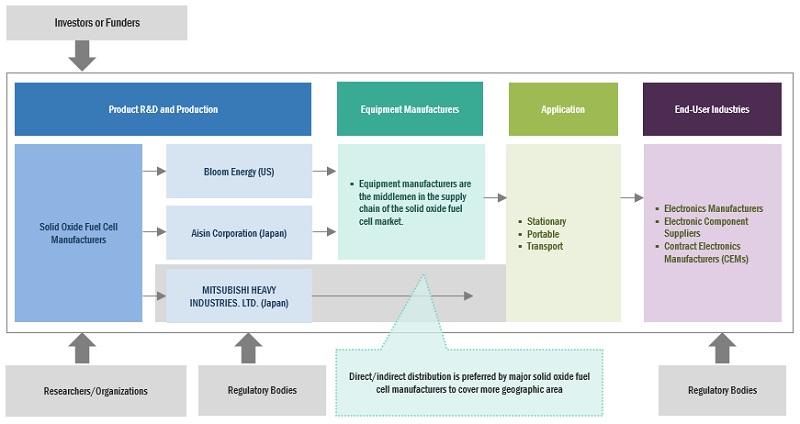
Prominent companies in this market include well-established, financially stable solid oxide fuel cell manufacturers. These companies have been operating in the market for several years and possess a diversified product portfolio, state-of-the-art technologies, and strong global sales and marketing networks. Prominent companies in this market include Bloom Energy (US), AISIN CORPORATION (Japan), KYOCERA Corporation (Japan), MITSUBISHI HEAVY INDUSTRIES, LTD. (Japan), and MIURA CO., LTD. (Japan).
Solid Oxide Fuel Cell Market

The planar, by type, is expected to be the largest segment during the forecast period.

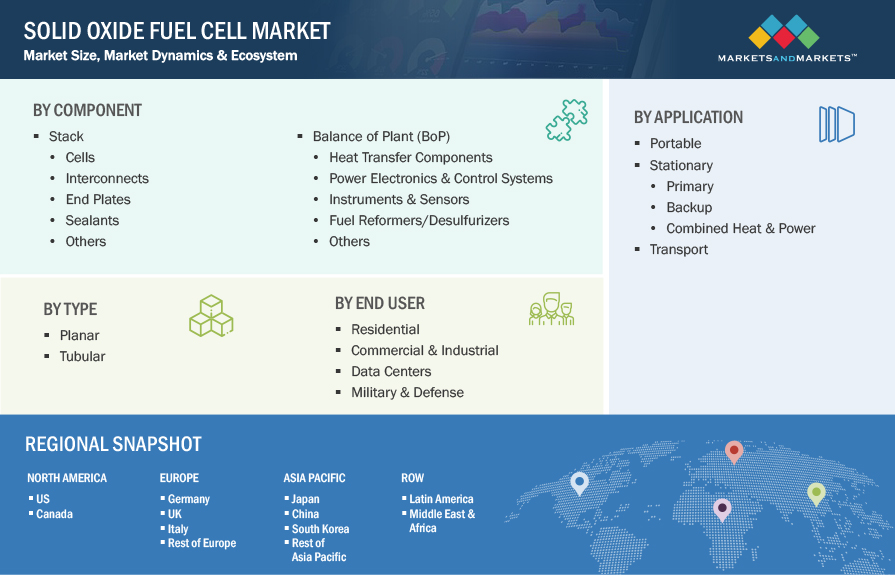
This report segments the solid oxide fuel cell market based on type into two types: planar and tubular. The planar segment is expected to be the largest segment during the forecast period. Because of its compact structure, the planar solid oxide fuel cell demand is likely to be significant. As its construction is relatively simple, it is the most commonly used solid oxide fuel cell type. Planar SOFCs are extensively used in stationary power applications due to superior power densities and heavy system designs. The key players that manufacture SOFCs with planar geometry include Bloom Energy (US), Sunfire GmbH (US), SOLIDpower S.p.A. (Italy), and Convion Ltd. (Finland).

By end user, the data centers is expected to be the fastest growing during the forecast period

This report segments the solid oxide fuel cell market based on end user into three segments: residential, commercial & industrial, data centers and military & defense. The data centers is expected to grow at the fastest rate during the forecast period.  The market for solid oxide fuel cell the data centers sector is primarily driven by growing demand of reliable, and high efficiency power. Owing to the emerging need to decrease carbon emissions, various manufacturers are continuously investing in the solid oxide fuel cell market

"Asia Pacific": The largest in the solid oxide fuel cell market"

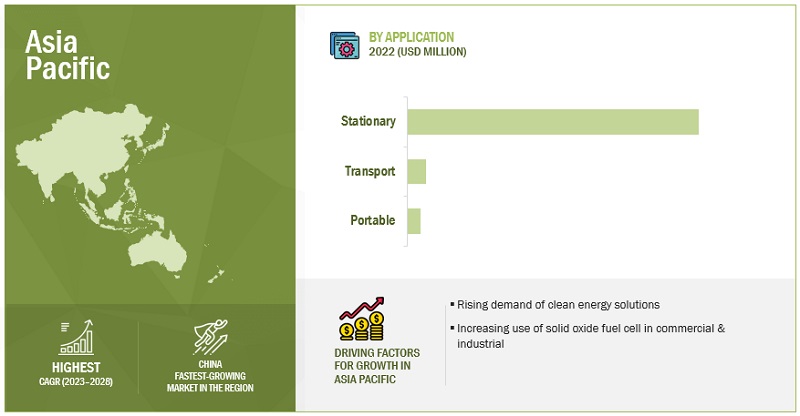
Asia Pacific is expected to have the largest market share in the solid oxide fuel cell market between 2023–2028, followed by North America and Europe. Urbanization and population growth have resulted in the need for vast infrastructure development, which has propelled the electricity demand across the region. As per the Indian Electrical and Electronics Manufacturers’ Association (IEEMA), the electricity generation capacity in India is expected to increase from 200 GW in 2010 to over 800 GW by 2032 to fulfill the increasing demand for power. Thus, there is a need for a huge investment of approximately USD 300 billion in the next 3–4 years in power equipment manufacturing, which will increase the demand for solid oxide fuel cell.  
Solid Oxide Fuel Cell Market Size, and Share

Key Market Players

The solid oxide fuel cell market is dominated by a few major players that have a wide regional presence. The major players in the solid oxide fuel cell market include Bloom Energy (US), AISIN CORPORATION (Japan), KYOCERA Corporation (Japan), MITSUBISHI HEAVY INDUSTRIES, LTD. (Japan), and MIURA CO., LTD. (Japan). Between 2018 and 2023, these companies followed strategies such as contracts, agreements, partnerships, mergers, acquisitions, and expansions to capture a larger share of the solid oxide fuel cell market.

Get online access to the report on the World's First Market Intelligence Cloud

  • Easy to Download Historical Data & Forecast Numbers
  • Company Analysis Dashboard for high growth potential opportunities
  • Research Analyst Access for customization & queries
  • Competitor Analysis with Interactive dashboard
  • Latest News, Updates & Trend analysis
Request Sample

Scope of the Report

Report Metric

Details

Market size available for years

2020–2028

Base year considered

2022

Forecast period

2023–2028

Forecast units

Value (USD Million/USD Thousand)

Segments covered

Solid oxide fuel cell market by type, component, application, end user and region.

Geographies covered

Asia Pacific, North America, Europe, and Rest of the World

Companies covered

Bloom Energy (US), Mitsubishi Power (Japan), AISIN CORPORATION (Japan), Hitachi Zosen Corporation (Japan), Ceres (US), MIURA CO., LTD. (Japan), KYOCERA Corporation (Japan), Convion Ltd. (Finland), Elcogen AS (Estonia), SolydEra SpA (Italy), Watt Fuel Cell Corporation (US), h2e Power (India), Upstart Power, Inc. (US), FuelCell Energy, Inc. (US), Ningbo Suofuren Energy Technology Co., Ltd. (SOFCMAN) (China), WEICHAI POWER CO., LTD (China), Sunfire GmbH (Germany), ZTEK Corporation, Inc. (US), Special Power Sources (US), ADELAN (UK), Edge Autonomy (US), Robert Bosch GmbH (Germany), Doosan Fuel Cell Co., Ltd. (South Korea), POSCO ENERGY (South Korea), Cummins Inc. (US), Clara Venture Labs  (Norway)

This research report categorizes the solid oxide fuel cell market by type, component, application, end user and region.

On the basis of type:
  • Planar
  • Tubular
On the basis of component:
  • Stack
  • Balance of plant
On the basis of application:
  • Commercial & Industrial
  • Residential
  • Military & Defense
  • Data Centers
On the basis of region:
  • Asia Pacific
  • Europe
  • North America
  • Rest of the World

Recent Developments

  • In June 2023, Bloom Energy signed an agreement with Perenco, an independent oil & gas company, to deploy 2.5 megawatts (MW) of Bloom’s solid oxide fuel cell technology in England.
  • In February 2023, WEICHAI POWER CO., LTD., a leading company of SOFC systems based in China, launched a stationary power SOFC system using Ceres technology. The newly launched SOFC system passed the EU CE certification.
  • In January 2023, Elcogen AS signed an MOU with Korea Shipbuilding and Offshore Engineering (KSOE) and Fraunhofer Institute for Ceramic Technologies and Systems (IKTS) for developing green hydrogen production and emission-free power generation systems. As per the partnership, Elcogen AS will supply its solid oxide fuel cell (SOFC) and solid oxide electrolyzer cell (SOEC) technology.
  • In July 2022, Aisin Corporation declared to acquire SBT Certification, an organization that sets Science Based Targets (SBTs). SBTs embody greenhouse gas emission-reduction goals that align with the scientifically established target outlined in the Paris Agreement.
  • In June 2022, Bloom Energy installed a new 1 MW solid oxide fuel cell plant at the Maranello facilities of Ferrari, a sports car manufacturer. This plant provides 5% of the energy required for Ferrari’s production activities. This contributed to Ferrari’s aim of achieving carbon neutrality by 2030.
  • In June 2022, Mitsubishi Power signed a contract with the gas- und Wärme-Institut Essen e.V. (GWI), a research institute working on heat and energy technology, under which it received an order to provide the first SOFC in Europe. The company laid the foundation of the SOFC system in 2021 and commenced its commercialization in June 2022.

Frequently Asked Questions (FAQ):

To speak to our analyst for a discussion on the above findings, click Speak to Analyst

TABLE OF CONTENTS
 
1 INTRODUCTION (Page No. - 31)
    1.1 STUDY OBJECTIVES 
    1.2 MARKET DEFINITION 
    1.3 STUDY SCOPE 
           1.3.1 INCLUSIONS AND EXCLUSIONS
           1.3.2 MARKETS COVERED
                    FIGURE 1 SOLID OXIDE FUEL CELL MARKET SEGMENTATION
           1.3.3 REGIONAL SCOPE
           1.3.4 YEARS CONSIDERED
           1.3.5 CURRENCY CONSIDERED
    1.4 LIMITATIONS 
    1.5 STAKEHOLDERS 
    1.6 SUMMARY OF CHANGES 
    1.7 IMPACT OF RECESSION 
 
2 RESEARCH METHODOLOGY (Page No. - 37)
    2.1 RESEARCH DATA 
           FIGURE 2 MARKET: RESEARCH DESIGN
           2.1.1 PRIMARY AND SECONDARY RESEARCH
                    2.1.1.1 Primary data
                               2.1.1.1.1 Key data from primary sources
                               2.1.1.1.2 Breakdown of primaries
                    2.1.1.2 Secondary data
                               2.1.1.2.1 Key data from secondary sources
    2.2 MARKET BREAKDOWN AND DATA TRIANGULATION 
           FIGURE 3 MARKET: DATA TRIANGULATION
    2.3 MARKET SIZE ESTIMATION METHODOLOGY 
           2.3.1 BOTTOM-UP APPROACH
                    FIGURE 4 MARKET: BOTTOM-UP ANALYSIS
           2.3.2 TOP-DOWN APPROACH
                    FIGURE 5 MARKET: TOP-DOWN ANALYSIS
           2.3.3 DEMAND-SIDE ANALYSIS
                    FIGURE 6 KEY METRICS CONSIDERED TO ANALYZE DEMAND FOR SOLID OXIDE FUEL CELLS
                    2.3.3.1 Regional analysis
                    2.3.3.2 Country analysis
                    2.3.3.3 Demand-side assumptions
                    2.3.3.4 Demand-side calculations
           2.3.4 SUPPLY-SIDE ANALYSIS
                    FIGURE 7 KEY METRICS CONSIDERED TO ANALYZE SUPPLY OF SOLID OXIDE FUEL CELLS
                    FIGURE 8 MARKET: SUPPLY-SIDE ANALYSIS
                    2.3.4.1 Supply-side calculations
                    2.3.4.2 Supply-side assumptions
                               FIGURE 9 MARKET: MARKET SHARE ANALYSIS, 2022
    2.4 FORECAST 
    2.5 RECESSION IMPACT 
 
3 EXECUTIVE SUMMARY (Page No. - 50)
    TABLE 1 SOLID OXIDE FUEL CELL MARKET SNAPSHOT 
    FIGURE 10 ASIA PACIFIC HELD LARGEST SHARE OF MARKET IN 2022 
    FIGURE 11 PLANAR SEGMENT TO DOMINATE MARKET DURING FORECAST PERIOD 
    FIGURE 12 BALANCE OF PLANT (BOP) SEGMENT TO ACCOUNT FOR LARGER MARKET SHARE IN 2028 
    FIGURE 13 STATIONARY SEGMENT TO DEPICT HIGHEST CAGR IN MARKET FROM 2023 TO 2028 
    FIGURE 14 COMMERCIAL & INDUSTRIAL SEGMENT TO HOLD LARGEST SHARE OF MARKET IN 2023 
 
4 PREMIUM INSIGHTS (Page No. - 54)
    4.1 ATTRACTIVE OPPORTUNITIES FOR PLAYERS IN SOLID OXIDE FUEL CELL MARKET 
           FIGURE 15 INCREASING FOCUS ON CLEAN POWER GENERATION TO BOOST MARKET GROWTH FROM 2023 TO 2028
    4.2 MARKET, BY REGION 
           FIGURE 16 ASIA PACIFIC MARKET TO EXHIBIT HIGHEST CAGR DURING FORECAST PERIOD
    4.3 ASIA PACIFIC MARKET, BY APPLICATION AND COUNTRY 
           FIGURE 17 STATIONARY SEGMENT AND CHINA HELD LARGEST SHARES OF SOLID OXIDE FUEL CELL MARKET IN ASIA PACIFIC IN 2022
    4.4 MARKET, BY TYPE 
           FIGURE 18 PLANAR SEGMENT TO HOLD LARGER MARKET SHARE IN 2028
    4.5 MARKET, BY END USER 
           FIGURE 19 COMMERCIAL & INDUSTRIAL SEGMENT TO ACCOUNT FOR LARGEST MARKET SHARE IN 2028
    4.6 MARKET, BY APPLICATION 
           FIGURE 20 STATIONARY SEGMENT TO HOLD LARGEST SHARE OF SOLID OXIDE FUEL CELL MARKET IN 2028
    4.7 MARKET, BY COMPONENT 
           FIGURE 21 BALANCE OF PLANT (BOP) SEGMENT TO ACCOUNT FOR LARGEST MARKET SHARE IN 2028
 
5 MARKET OVERVIEW (Page No. - 58)
    5.1 INTRODUCTION 
    5.2 MARKET DYNAMICS 
           FIGURE 22 SOLID OXIDE FUEL CELL MARKET: DRIVERS, RESTRAINTS, OPPORTUNITIES, AND CHALLENGES
           5.2.1 DRIVERS
                    5.2.1.1 Federal investments in fuel cell installation projects
                               FIGURE 23 CLEAN ENERGY INVESTMENTS IN ADVANCED ECONOMIES VS. EMERGING ECONOMIES, 2015–2021
                    5.2.1.2 Higher energy efficiency of solid oxide fuel cells than reciprocating engines
                    5.2.1.3 Introduction of stringent carbon emission norms
                               FIGURE 24 CO2 EMISSIONS FROM ENERGY COMBUSTION AND INDUSTRIAL PROCESS, 2000–2022 (GT CO2)
                               FIGURE 25 ENERGY-RELATED CO2 EMISSIONS, BY SECTOR, 2019–2022 (GT CO2)
           5.2.2 RESTRAINTS
                    5.2.2.1 High fuel cell installation and manufacturing costs
                    5.2.2.2 Availability of alternatives
           5.2.3 OPPORTUNITIES
                    5.2.3.1 Rising adoption of efficient electrochemical devices for combined heat and power generations
                               TABLE 2 COMPARISON BETWEEN FUEL CELLS AND OTHER DISTRIBUTED POWER GENERATION SOURCES
                    5.2.3.2 Increasing electricity consumption in data centers
           5.2.4 CHALLENGES
                    5.2.4.1 Long start-up time and high operational temperature
                    5.2.4.2 Limitations of hydrogen storage systems
                    5.2.4.3 High spending on alternative clean energy technologies
                               FIGURE 26 GLOBAL INVESTMENTS IN RENEWABLE ENERGY
                    5.2.4.4 Fuel cell degradation and carbon dusting
    5.3 TRENDS/DISRUPTIONS IMPACTING CUSTOMERS’ BUSINESSES 
           5.3.1 REVENUE SHIFTS AND NEW REVENUE POCKETS FOR PLAYERS IN MARKET
                    FIGURE 27 REVENUE SHIFTS AND NEW REVENUE POCKETS FOR PLAYERS IN MARKET
    5.4 MARKET MAPPING 
           FIGURE 28 MARKET: MARKET MAPPING
    5.5 SUPPLY CHAIN ANALYSIS 
           FIGURE 29 MARKET: SUPPLY CHAIN ANALYSIS
           5.5.1 RAW MATERIAL SUPPLY
           5.5.2 COMPONENT MANUFACTURING
           5.5.3 HARDWARE ASSEMBLY
           5.5.4 DISTRIBUTION/END USERS
                    TABLE 3 COMPANIES AND THEIR ROLES IN SOLID OXIDE FUEL CELL ECOSYSTEM
    5.6 PRICING ANALYSIS 
           5.6.1 AVERAGE SELLING PRICING TREND, BY COMPONENT
                    TABLE 4 MARKET: COST BREAK-UP, BY STACK COMPONENT
                    TABLE 5 MARKET: COST BREAK-UP, BY BALANCE OF PLANT (BOP) COMPONENT
                    FIGURE 30 MARKET: STACK MANUFACTURING COST PER KW
           5.6.2 AVERAGE SELLING PRICE OF SOLID OXIDE FUEL CELLS OFFERED BY 3 KEY PLAYERS
                    TABLE 6 AVERAGE SELLING PRICE OF SOLID OXIDE FUEL CELLS OFFERED BY 3 KEY PLAYERS
           5.6.3 AVERAGE SELLING PRICE TREND, BY REGION
                    TABLE 7 AVERAGE SELLING PRICE TREND, BY REGION
    5.7 REGULATORY LANDSCAPE 
           5.7.1 REGULATORY BODIES, GOVERNMENT AGENCIES, AND OTHER ORGANIZATIONS
                    TABLE 8 NORTH AMERICA: LIST OF REGULATORY BODIES, GOVERNMENT AGENCIES, AND OTHER ORGANIZATIONS
                    TABLE 9 EUROPE: LIST OF REGULATORY BODIES, GOVERNMENT AGENCIES, AND OTHER ORGANIZATIONS
                    TABLE 10 ASIA PACIFIC: LIST OF REGULATORY BODIES, GOVERNMENT AGENCIES, AND OTHER ORGANIZATIONS
           5.7.2 MARKET: REGULATORY FRAMEWORK
                    5.7.2.1 Regulatory frameworks in North America
                    5.7.2.2 Regulatory frameworks in Europe
                    5.7.2.3 Regulatory frameworks in Asia Pacific
    5.8 PATENT ANALYSIS 
           FIGURE 31 MARKET: PATENT REGISTRATIONS, 2012–2022
           5.8.1 LIST OF MAJOR PATENTS
                    TABLE 11 SOLID OXIDE FUEL CELL: PATENT REGISTRATIONS, 2018–2022
    5.9 CASE STUDY ANALYSIS 
           5.9.1 IKEA LEVERAGED BLOOM ENERGY’S FUEL CELLS FOR ON-SITE POWER GENERATION
                    5.9.1.1 Challenges
                    5.9.1.2 Solution
           5.9.2 SAMSUNG HEAVY INDUSTRIES AND BLOOM ENERGY PARTNERED TO DEVELOP EFFICIENT FUEL-CELL SHIPS
                    5.9.2.1 Challenges
                    5.9.2.2 Solution
           5.9.3 CONVION DEPLOYED ELCOGEN’S SOFC AND STACK TECHNOLOGY FOR EFFICIENT POWER GENERATION
                    5.9.3.1 Challenges
                    5.9.3.2 Solution
    5.10 TECHNOLOGY ANALYSIS 
           5.10.1 HYBRID SOFCS
           5.10.2 INTEGRATED BIOMASS GASIFIERS
    5.11 KEY CONFERENCES AND EVENTS, 2023–2024 
                    TABLE 12 SOLID OXIDE FUEL CELL MARKET: LIST OF CONFERENCES AND EVENTS, 2023–2024
    5.12 TRADE ANALYSIS 
           5.12.1 HS CODE 280410
           5.12.2 EXPORT SCENARIO
                    TABLE 13 EXPORT DATA FOR HS CODE: 280410, BY COUNTRY, 2020–2022 (USD THOUSAND)
                    FIGURE 32 EXPORT DATA FOR TOP 5 COUNTRIES, 2020–2022 (USD THOUSAND)
           5.12.3 IMPORT SCENARIO
                    TABLE 14 IMPORT DATA FOR HS CODE: 280410, BY COUNTRY, 2020–2022 (USD THOUSAND)
                    FIGURE 33 IMPORT DATA FOR TOP 5 COUNTRIES, 2020–2022 (USD THOUSAND)
    5.13 PORTER’S FIVE FORCES ANALYSIS 
                    FIGURE 34 MARKET: PORTER’S FIVE FORCES ANALYSIS
                    TABLE 15 MARKET: PORTER’S FIVE FORCES ANALYSIS
           5.13.1 THREAT OF SUBSTITUTES
           5.13.2 BARGAINING POWER OF SUPPLIERS
           5.13.3 BARGAINING POWER OF BUYERS
           5.13.4 THREAT OF NEW ENTRANTS
           5.13.5 INTENSITY OF COMPETITIVE RIVALRY
    5.14 KEY STAKEHOLDERS AND BUYING CRITERIA 
           5.14.1 KEY STAKEHOLDERS IN BUYING PROCESS
                    FIGURE 35 MARKET: INFLUENCE OF STAKEHOLDERS ON BUYING PROCESS FOR TOP 3 END USERS
                    TABLE 16 MARKET: INFLUENCE OF STAKEHOLDERS ON BUYING PROCESS FOR TOP 3 END USERS (%)
           5.14.2 BUYING CRITERIA
                    FIGURE 36 MARKET: KEY BUYING CRITERIA, BY END USER
                    TABLE 17 MARKET: KEY BUYING CRITERIA, BY END USER
 
6 SOLID OXIDE FUEL CELL MARKET, BY TYPE (Page No. - 89)
    6.1 INTRODUCTION 
           FIGURE 37 MARKET SHARE, BY TYPE, 2022
           TABLE 18 MARKET, BY TYPE, 2020–2028 (USD MILLION)
    6.2 PLANAR 
           6.2.1 USE OF PLANAR SOFCS IN STATIONARY POWER APPLICATIONS TO FUEL SEGMENTAL GROWTH
                    TABLE 19 PLANAR: MARKET, BY REGION, 2020–2028 (USD MILLION)
    6.3 TUBULAR 
           6.3.1 ADOPTION OF ENERGY-HUNGRY PORTABLE DEVICES TO DRIVE MARKET
                    TABLE 20 TUBULAR: MARKET, BY REGION, 2020–2028 (USD MILLION)
 
7 SOLID OXIDE FUEL CELL MARKET, BY COMPONENT (Page No. - 93)
    7.1 INTRODUCTION 
           FIGURE 38 MARKET SHARE, BY COMPONENT, 2022
           TABLE 21 MARKET, BY COMPONENT, 2020–2028 (USD MILLION)
    7.2 STACK 
           7.2.1 ENFORCEMENT OF EMISSION REGULATIONS TO BOOST SOLID OXIDE FUEL CELL STACK MANUFACTURING
                    TABLE 22 STACK: MARKET, BY COMPONENT, 2020–2028 (USD MILLION)
                    7.2.1.1 Cells
                    7.2.1.2 Interconnects
                    7.2.1.3 End plates
                    7.2.1.4 Sealants
                    7.2.1.5 Other stack components
    7.3 BALANCE OF PLANT (BOP) 
           7.3.1 USE OF BOP COMPONENTS FOR EFFICIENT POWER GENERATION TO CONTRIBUTE TO MARKET GROWTH
                    TABLE 23 BALANCE OF PLANT (BOP): MARKET, BY COMPONENT, 2020–2028 (USD MILLION)
                    7.3.1.1 Heat transfer components
                    7.3.1.2 Power electronics & control systems
                    7.3.1.3 Instruments & sensors
                    7.3.1.4 Fuel reformers/Desulfurizers
                    7.3.1.5 Other BoP components
 
8 SOLID OXIDE FUEL CELL MARKET, BY APPLICATION (Page No. - 98)
    8.1 INTRODUCTION 
           FIGURE 39 MARKET SHARE, BY APPLICATION, 2022
           TABLE 24 MARKET, BY APPLICATION, 2020–2028 (USD MILLION)
    8.2 PORTABLE 
           8.2.1 HIGH PREFERENCE FOR MOBILE ENERGY STORAGE SYSTEMS TO BOOST SEGMENTAL GROWTH
                    TABLE 25 PORTABLE: MARKET, BY REGION, 2020–2028 (USD MILLION)
    8.3 STATIONARY 
           8.3.1 INSTALLATION OF PRIMARY POWER SOURCES IN RESIDENTIAL BUILDINGS TO ACCELERATE SEGMENTAL GROWTH
                    TABLE 26 STATIONARY: MARKET, BY REGION, 2020–2028 (USD MILLION)
                    TABLE 27 STATIONARY: MARKET, BY APPLICATION, 2020–2028 (USD MILLION)
                    8.3.1.1 Primary
                               8.3.1.1.1 Utilization of fuel cell units to generate primary power to contribute to segmental growth
                               TABLE 28 PRIMARY: MARKET FOR STATIONARY APPLICATIONS, BY REGION, 2020–2028 (USD MILLION)
                    8.3.1.2 Backup
                               8.3.1.2.1 Adoption of fuel cells for backup power generation in data centers to boost market growth
                               TABLE 29 BACKUP: MARKET FOR STATIONARY APPLICATIONS, BY REGION, 2020–2028 (USD MILLION)
                    8.3.1.3 Combined heat & power
                               8.3.1.3.1 Increasing number of combined heat & power programs to support segmental growth
                               TABLE 30 COMBINED HEAT & POWER: MARKET FOR STATIONARY APPLICATIONS, BY REGION, 2020–2028 (USD MILLION)
    8.4 TRANSPORT 
           8.4.1 DEVELOPMENT OF SOFCS FOR HEAVY-DUTY VEHICLES TO FUEL MARKET GROWTH
                    TABLE 31 TRANSPORT: MARKET, BY REGION, 2020–2028 (USD MILLION)
 
9 SOLID OXIDE FUEL CELL MARKET, BY END USER (Page No. - 105)
    9.1 INTRODUCTION 
           FIGURE 40 MARKET SHARE, BY END USER, 2022
           TABLE 32 MARKET, BY END USER, 2020–2028 (USD MILLION)
    9.2 RESIDENTIAL 
           9.2.1 INCREASING POWER CONSUMPTION BY RESIDENTIAL BUILDINGS TO DRIVE SEGMENTAL GROWTH
                    TABLE 33 RESIDENTIAL: MARKET, BY REGION, 2020–2028 (USD MILLION)
    9.3 COMMERCIAL & INDUSTRIAL 
           9.3.1 RISING NEED TO CURB CARBON EMISSIONS FROM COMMERCIAL & INDUSTRIAL BUILDINGS TO PROPEL MARKET
                    TABLE 34 COMMERCIAL & INDUSTRIAL: SOLID OXIDE FUEL CELL MARKET, BY REGION, 2020–2028 (USD MILLION)
    9.4 DATA CENTERS 
           9.4.1 RELIANCE ON SOFC PLATFORMS AS PRIMARY POWER SOURCE IN DATA CENTERS TO FUEL SEGMENTAL GROWTH
                    TABLE 35 DATA CENTERS: SOLID OXIDE FUEL CELL MARKET, BY REGION, 2020–2028 (USD MILLION)
    9.5 MILITARY & DEFENSE 
           9.5.1 GROWING DEMAND FOR FUEL-FLEXIBLE POWER SYSTEMS FOR MILITARY & DEFENSE APPLICATIONS TO CONTRIBUTE TO MARKET GROWTH
                    TABLE 36 MILITARY & DEFENSE: SOLID OXIDE FUEL CELL MARKET, BY REGION, 2020–2028 (USD MILLION)
 
10 SOLID OXIDE FUEL CELL MARKET, BY REGION (Page No. - 111)
     10.1 INTRODUCTION 
               FIGURE 41 ASIA PACIFIC TO REGISTER HIGHEST CAGR DURING FORECAST PERIOD
               FIGURE 42 MARKET SHARE, BY REGION, 2022
               TABLE 37 MARKET, BY REGION, 2020–2028 (USD MILLION)
               TABLE 38 MARKET, BY REGION, 2020–2028 (MW)
     10.2 ASIA PACIFIC 
             10.2.1 RECESSION IMPACT ON MARKET IN ASIA PACIFIC
                       FIGURE 43 ASIA PACIFIC: SOLID OXIDE FUEL CELL MARKET SNAPSHOT
                       TABLE 39 ASIA PACIFIC: MARKET, BY COUNTRY, 2020–2028 (USD MILLION)
                       TABLE 40 ASIA PACIFIC: MARKET, BY COUNTRY, 2020–2028 (MW)
                       TABLE 41 ASIA PACIFIC: MARKET, BY TYPE, 2020–2028 (USD MILLION)
                       TABLE 42 ASIA PACIFIC: MARKET FOR PLANAR, BY COUNTRY, 2020–2028 (USD MILLION)
                       TABLE 43 ASIA PACIFIC: MARKET FOR TUBULAR, BY COUNTRY, 2020–2028 (USD MILLION)
                       TABLE 44 ASIA PACIFIC: MARKET, BY APPLICATION, 2020–2028 (USD MILLION)
                       TABLE 45 ASIA PACIFIC: MARKET FOR PORTABLE APPLICATIONS, BY COUNTRY, 2020–2028 (USD MILLION)
                       TABLE 46 ASIA PACIFIC: MARKET FOR STATIONARY APPLICATIONS, BY COUNTRY, 2020–2028 (USD MILLION)
                       TABLE 47 ASIA PACIFIC: MARKET FOR TRANSPORT APPLICATIONS, BY COUNTRY, 2020–2028 (USD MILLION)
                       TABLE 48 ASIA PACIFIC: MARKET, BY END USER, 2020–2028 (USD MILLION)
                       TABLE 49 ASIA PACIFIC: MARKET FOR RESIDENTIAL, BY COUNTRY, 2020–2028 (USD MILLION)
                       TABLE 50 ASIA PACIFIC: MARKET FOR COMMERCIAL & INDUSTRIAL, BY COUNTRY, 2020–2028 (USD MILLION)
                       TABLE 51 ASIA PACIFIC: MARKET FOR DATA CENTERS, BY COUNTRY, 2020–2028 (USD MILLION)
                       TABLE 52 ASIA PACIFIC: MARKET FOR MILITARY & DEFENSE, BY COUNTRY, 2020–2028 (USD MILLION)
                       10.2.1.1 Japan
                                   10.2.1.1.1 Rising focus on efficient power generation for residential applications to drive market
                                   TABLE 53 JAPAN: SOLID OXIDE FUEL CELL MARKET, BY TYPE, 2020–2028 (USD MILLION)
                                   TABLE 54 JAPAN: SOLID OXIDE FUEL CELL MARKET, BY APPLICATION, 2020–2028 (USD MILLION)
                                   TABLE 55 JAPAN: SOLID OXIDE FUEL CELL MARKET, BY END USER, 2020–2028 (USD MILLION)
                       10.2.1.2 South Korea
                                   10.2.1.2.1 Increasing investments in hydrogen-powered energy servers to propel market
                                   TABLE 56 SOUTH KOREA: SOLID OXIDE FUEL CELL MARKET, BY TYPE, 2020–2028 (USD MILLION)
                                   TABLE 57 SOUTH KOREA: SOLID OXIDE FUEL CELL MARKET, BY APPLICATION, 2020–2028 (USD MILLION)
                                   TABLE 58 SOUTH KOREA: SOLID OXIDE FUEL CELL MARKET, BY END USER, 2020–2028 (USD MILLION)
                       10.2.1.3 China
                                   10.2.1.3.1 Growing focus on mitigating carbon emissions to boost adoption
                                   TABLE 59 CHINA: SOLID OXIDE FUEL CELL MARKET, BY TYPE, 2020–2028 (USD MILLION)
                                   TABLE 60 CHINA: SOLID OXIDE FUEL CELL MARKET, BY APPLICATION, 2020–2028 (USD MILLION)
                                   TABLE 61 CHINA: SOLID OXIDE FUEL CELL MARKET, BY END USER, 2020–2028 (USD MILLION)
                       10.2.1.4 Rest of Asia Pacific
                                   TABLE 62 REST OF ASIA PACIFIC: SOLID OXIDE FUEL CELL MARKET, BY TYPE, 2020–2028 (USD MILLION)
                                   TABLE 63 REST OF ASIA PACIFIC: SOLID OXIDE FUEL CELL MARKET, BY APPLICATION, 2020–2028 (USD MILLION)
                                   TABLE 64 REST OF ASIA PACIFIC: SOLID OXIDE FUEL CELL MARKET, BY END USER, 2020–2028 (USD MILLION)
     10.3 NORTH AMERICA 
               FIGURE 44 NORTH AMERICA: SOLID OXIDE FUEL CELL MARKET SNAPSHOT
             10.3.1 RECESSION IMPACT ON MARKET IN NORTH AMERICA
                       TABLE 65 NORTH AMERICA: SOLID OXIDE FUEL CELL, BY COUNTRY, 2020–2028 (USD MILLION)
                       TABLE 66 NORTH AMERICA: SOLID OXIDE FUEL CELL, BY COUNTRY, 2020–2028 (MW)
                       TABLE 67 NORTH AMERICA: SOLID OXIDE FUEL CELL MARKET, BY TYPE, 2020–2028 (USD MILLION)
                       TABLE 68 NORTH AMERICA: SOLID OXIDE FUEL CELL MARKET FOR PLANAR, BY COUNTRY, 2020–2028 (USD MILLION)
                       TABLE 69 NORTH AMERICA: SOLID OXIDE FUEL CELL MARKET FOR TUBULAR, BY COUNTRY, 2020–2028 (USD MILLION)
                       TABLE 70 NORTH AMERICA: SOLID OXIDE FUEL CELL MARKET, BY APPLICATION, 2020–2028 (USD MILLION)
                       TABLE 71 NORTH AMERICA: SOLID OXIDE FUEL CELL MARKET FOR PORTABLE, BY COUNTRY, 2020–2028 (USD MILLION)
                       TABLE 72 NORTH AMERICA: SOLID OXIDE FUEL CELL MARKET FOR STATIONARY, BY COUNTRY, 2020–2028 (USD MILLION)
                       TABLE 73 NORTH AMERICA: SOLID OXIDE FUEL CELL MARKET FOR TRANSPORT, BY COUNTRY, 2020–2028 (USD MILLION)
                       TABLE 74 NORTH AMERICA: SOLID OXIDE FUEL CELL MARKET, BY END USER, 2020–2028 (USD MILLION)
                       TABLE 75 NORTH AMERICA: SOLID OXIDE FUEL CELL MARKET FOR RESIDENTIAL, BY COUNTRY, 2020–2028 (USD MILLION)
                       TABLE 76 NORTH AMERICA: SOLID OXIDE FUEL CELL MARKET FOR COMMERCIAL & INDUSTRIAL, BY COUNTRY, 2020–2028 (USD MILLION)
                       TABLE 77 NORTH AMERICA: SOLID OXIDE FUEL CELL MARKET FOR DATA CENTERS, BY COUNTRY, 2020–2028 (USD MILLION)
                       TABLE 78 NORTH AMERICA: SOLID OXIDE FUEL CELL MARKET FOR MILITARY & DEFENSE, BY COUNTRY, 2020–2028 (USD MILLION)
                       10.3.1.1 US
                                   10.3.1.1.1 Rising emphasis on clean energy generation to fuel market growth
                                   TABLE 79 US: SOLID OXIDE FUEL CELL MARKET, BY TYPE, 2020–2028 (USD MILLION)
                                   TABLE 80 US: SOLID OXIDE FUEL CELL MARKET, BY APPLICATION, 2020–2028 (USD MILLION)
                                   TABLE 81 US: SOLID OXIDE FUEL CELL MARKET, BY END USER, 2020–2028 (USD MILLION)
                       10.3.1.2 Canada
                                   10.3.1.2.1 Growing energy demand from industrial facilities to drive market
                                   TABLE 82 CANADA: SOLID OXIDE FUEL CELL MARKET, BY TYPE, 2020–2028 (USD MILLION)
                                   TABLE 83 CANADA: SOLID OXIDE FUEL CELL MARKET, BY APPLICATION, 2020–2028 (USD MILLION)
                                   TABLE 84 CANADA: SOLID OXIDE FUEL CELL MARKET, BY END USER, 2020–2028 (USD MILLION)
     10.4 EUROPE 
             10.4.1 RECESSION IMPACT ON MARKET IN EUROPE
                       TABLE 85 EUROPE: SOLID OXIDE FUEL CELL MARKET, BY COUNTRY, 2020–2028 (USD MILLION)
                       TABLE 86 EUROPE: SOLID OXIDE FUEL CELL MARKET, BY COUNTRY, 2020–2028 (MW)
                       TABLE 87 EUROPE: SOLID OXIDE FUEL CELL MARKET, BY TYPE, 2020–2028 (USD MILLION)
                       TABLE 88 EUROPE: SOLID OXIDE FUEL CELL MARKET FOR PLANAR, BY COUNTRY, 2020–2028 (USD MILLION)
                       TABLE 89 EUROPE: SOLID OXIDE FUEL CELL MARKET FOR TUBULAR, BY COUNTRY, 2020–2028 (USD MILLION)
                       TABLE 90 EUROPE: SOLID OXIDE FUEL CELL MARKET, BY APPLICATION, 2020–2028 (USD MILLION)
                       TABLE 91 EUROPE: SOLID OXIDE FUEL CELL MARKET FOR PORTABLE, BY COUNTRY, 2020–2028 (USD MILLION)
                       TABLE 92 EUROPE: SOLID OXIDE FUEL CELL MARKET FOR STATIONARY, BY COUNTRY, 2020–2028 (USD MILLION)
                       TABLE 93 EUROPE: SOLID OXIDE FUEL CELL MARKET FOR TRANSPORT, BY COUNTRY, 2020–2028 (USD MILLION)
                       TABLE 94 EUROPE: SOLID OXIDE FUEL CELL MARKET, BY END USER, 2020–2028 (USD THOUSAND)
                       TABLE 95 EUROPE: SOLID OXIDE FUEL CELL MARKET FOR RESIDENTIAL, BY COUNTRY, 2020–2028 (USD MILLION)
                       TABLE 96 EUROPE: SOLID OXIDE FUEL CELL MARKET FOR COMMERCIAL & INDUSTRIAL, BY COUNTRY, 2020–2028 (USD MILLION)
                       TABLE 97 EUROPE: SOLID OXIDE FUEL CELL MARKET FOR DATA CENTERS, BY COUNTRY, 2020–2028 (USD MILLION)
                       TABLE 98 EUROPE: SOLID OXIDE FUEL CELL MARKET FOR MILITARY & DEFENSE, BY COUNTRY, 2020–2028 (USD MILLION)
                       10.4.1.1 Germany
                                   10.4.1.1.1 Growing investments in fuel cell technology projects to boost market growth
                                   TABLE 99 GERMANY: SOLID OXIDE FUEL CELL MARKET, BY TYPE, 2020–2028 (USD MILLION)
                                   TABLE 100 GERMANY: SOLID OXIDE FUEL CELL MARKET, BY APPLICATION, 2020–2028 (USD MILLION)
                                   TABLE 101 GERMANY: SOLID OXIDE FUEL CELL MARKET, BY END USER, 2020–2028 (USD MILLION)
                       10.4.1.2 UK
                                   10.4.1.2.1 Rising implementation of emission reduction rules to propel market
                                   TABLE 102 UK: SOLID OXIDE FUEL CELL MARKET, BY TYPE, 2020–2028 (USD MILLION)
                                   TABLE 103 UK: SOLID OXIDE FUEL CELL MARKET, BY APPLICATION, 2020–2028 (USD MILLION)
                                   TABLE 104 UK: SOLID OXIDE FUEL CELL MARKET, BY END USER, 2020–2028 (USD MILLION)
                       10.4.1.3 Italy
                                   10.4.1.3.1 High preference for clean transportation to accelerate market growth
                                   TABLE 105 ITALY: SOLID OXIDE FUEL CELL MARKET, BY TYPE, 2020–2028 (USD THOUSAND)
                                   TABLE 106 ITALY: SOLID OXIDE FUEL CELL MARKET, BY APPLICATION, 2020–2028 (USD THOUSAND)
                                   TABLE 107 ITALY: SOLID OXIDE FUEL CELL MARKET, BY END USER, 2020–2028 (USD THOUSAND)
                       10.4.1.4 Rest of Europe
                                   TABLE 108 REST OF EUROPE: SOLID OXIDE FUEL CELL MARKET, BY TYPE, 2020–2028 (USD THOUSAND)
                                   TABLE 109 REST OF EUROPE: SOLID OXIDE FUEL CELL MARKET, BY APPLICATION, 2020–2028 (USD THOUSAND)
                                   TABLE 110 REST OF EUROPE: SOLID OXIDE FUEL CELL MARKET, BY END USER, 2020–2028 (USD THOUSAND)
     10.5 ROW 
             10.5.1 RECESSION IMPACT ON MARKET IN ROW
                       TABLE 111 ROW: SOLID OXIDE FUEL CELL MARKET, BY TYPE, 2020–2028 (USD MILLION)
                       TABLE 112 ROW: SOLID OXIDE FUEL CELL MARKET, BY APPLICATION, 2020–2028 (USD MILLION)
                       TABLE 113 ROW: SOLID OXIDE FUEL CELL MARKET, BY END USER, 2020–2028 (USD MILLION)
                       10.5.1.1 Latin America
                                   10.5.1.1.1 Increasing hydrogen and fuel cell research to boost market growth
                       10.5.1.2 Middle East & Africa
                                   10.5.1.2.1 Rising use of SOFCs as backup power source to accelerate market growth
 
11 COMPETITIVE LANDSCAPE (Page No. - 146)
     11.1 OVERVIEW 
     11.2 STRATEGIES ADOPTED BY KEY PLAYERS, 2018–2023 
               TABLE 114 STRATEGIES ADOPTED BY KEY PLAYERS, 2018–2023
     11.3 MARKET SHARE ANALYSIS, 2022 
               TABLE 115 SOLID OXIDE FUEL CELL MARKET: DEGREE OF COMPETITION
               FIGURE 45 MARKET SHARE ANALYSIS, 2022
     11.4 MARKET EVALUATION FRAMEWORK, 2018–2023 
               TABLE 116 MARKET EVALUATION FRAMEWORK, 2018–2023
     11.5 SEGMENTAL REVENUE ANALYSIS OF KEY PLAYERS, 2018–2022 
               FIGURE 46 SEGMENTAL REVENUE ANALYSIS, 2018–2022
     11.6 COMPETITIVE SCENARIOS AND TRENDS 
             11.6.1 DEALS
                       TABLE 117 SOLID OXIDE FUEL CELL MARKET: DEALS, 2018–2023
             11.6.2 OTHERS
                       TABLE 118 SOLID OXIDE FUEL CELL MARKET: OTHERS, 2018–2023
     11.7 EVALUATION MATRIX OF KEY PLAYERS, 2022 
             11.7.1 STARS
             11.7.2 EMERGING LEADERS
             11.7.3 PERVASIVE PLAYERS
             11.7.4 PARTICIPANTS
                       FIGURE 47 SOLID OXIDE FUEL CELL MARKET: EVALUATION MATRIX OF KEY COMPANIES, 2022
                       TABLE 119 COMPANY TYPE FOOTPRINT
                       TABLE 120 COMPANY COMPONENT FOOTPRINT
                       TABLE 121 COMPANY APPLICATION FOOTPRINT
                       TABLE 122 COMPANY END USER FOOTPRINT
                       TABLE 123 COMPANY REGIONAL FOOTPRINT
                       TABLE 124 COMPANY PRODUCT FOOTPRINT
                       TABLE 125 COMPANY OVERALL FOOTPRINT
     11.8 EVALUATION MATRIX OF START-UPS/SMALL- AND MEDIUM-SIZED ENTERPRISES (SMES), 2022 
             11.8.1 PROGRESSIVE COMPANIES
             11.8.2 RESPONSIVE COMPANIES
             11.8.3 DYNAMIC COMPANIES
             11.8.4 STARTING BLOCKS
                       FIGURE 48 SOLID OXIDE FUEL CELL MARKET: EVALUATION MATRIX OF START-UPS/SMES, 2022
     11.9 COMPETITIVE BENCHMARKING 
               TABLE 126 SOLID OXIDE FUEL CELL MARKET: LIST OF KEY START-UPS/SMES
               TABLE 127 COMPANY TYPE FOOTPRINT: COMPETITIVE BENCHMARKING OF KEY START-UPS/SMES
               TABLE 128 COMPANY COMPONENT FOOTPRINT: COMPETITIVE BENCHMARKING OF KEY START-UPS/SMES
               TABLE 129 COMPANY APPLICATION FOOTPRINT: COMPETITIVE BENCHMARKING OF KEY START-UPS/SMES
               TABLE 130 COMPANY END USER FOOTPRINT: COMPETITIVE BENCHMARKING OF KEY START-UPS/SMES
               TABLE 131 COMPANY REGIONAL FOOTPRINT: COMPETITIVE BENCHMARKING OF KEY START-UPS/SMES
               TABLE 132 COMPANY PRODUCT FOOTPRINT: COMPETITIVE BENCHMARKING OF KEY START-UPS/SMES
 
12 COMPANY PROFILES (Page No. - 168)
(Business overview, Products/Services/Solutions offered, Recent Developments, MNM view)*
     12.1 KEY PLAYERS 
             12.1.1 BLOOM ENERGY
                       TABLE 133 BLOOM ENERGY: COMPANY OVERVIEW
                       FIGURE 49 BLOOM ENERGY: COMPANY SNAPSHOT
                       TABLE 134 BLOOM ENERGY: PRODUCTS/SERVICES/SOLUTIONS OFFERED
                       TABLE 135 BLOOM ENERGY: PRODUCT LAUNCHES
                       TABLE 136 BLOOM ENERGY: DEALS
                       TABLE 137 BLOOM ENERGY: OTHERS
             12.1.2 AISIN CORPORATION
                       TABLE 138 AISIN CORPORATION: COMPANY OVERVIEW
                       FIGURE 50 AISIN CORPORATION: COMPANY SNAPSHOT
                       TABLE 139 AISIN CORPORATION: PRODUCTS/SERVICES/SOLUTIONS OFFERED
                       TABLE 140 AISIN CORPORATION: DEALS
             12.1.3 MITSUBISHI HEAVY INDUSTRIES, LTD.
                       TABLE 141 MITSUBISHI HEAVY INDUSTRIES, LTD.: COMPANY OVERVIEW
                       FIGURE 51 MITSUBISHI HEAVY INDUSTRIES, LTD.: COMPANY SNAPSHOT
                       TABLE 142 MITSUBISHI HEAVY INDUSTRIES, LTD.: PRODUCTS/SERVICES/SOLUTIONS OFFERED
                       TABLE 143 MITSUBISHI HEAVY INDUSTRIES, LTD.: DEALS
                       TABLE 144 MITSUBISHI HEAVY INDUSTRIES, LTD.: OTHERS
             12.1.4 KYOCERA CORPORATION
                       TABLE 145 KYOCERA CORPORATION: COMPANY OVERVIEW
                       FIGURE 52 KYOCERA CORPORATION: COMPANY SNAPSHOT
                       TABLE 146 KYOCERA CORPORATION: PRODUCTS/SERVICES/SOLUTIONS OFFERED
                       TABLE 147 KYOCERA CORPORATION: OTHERS
             12.1.5 MIURA CO., LTD.
                       TABLE 148 MIURA CO., LTD.: COMPANY OVERVIEW
                       FIGURE 53 MIURA CO., LTD.: COMPANY SNAPSHOT
                       TABLE 149 MIURA CO., LTD.: PRODUCTS/SERVICES/SOLUTIONS OFFERED
                       TABLE 150 MIURA CO., LTD.: PRODUCT LAUNCHES
             12.1.6 CERES
                       TABLE 151 CERES: COMPANY OVERVIEW
                       FIGURE 54 CERES: COMPANY SNAPSHOT
                       TABLE 152 CERES: PRODUCTS/SERVICES/SOLUTIONS OFFERED
                       TABLE 153 CERES: DEALS
                       TABLE 154 CERES: OTHERS
             12.1.7 CONVION
                       TABLE 155 CONVION: COMPANY OVERVIEW
                       TABLE 156 CONVION: PRODUCTS/SERVICES/SOLUTIONS OFFERED
                       TABLE 157 CONVION: DEALS
             12.1.8 WATT FUEL CELL CORPORATION
                       TABLE 158 WATT FUEL CELL CORPORATION: COMPANY OVERVIEW
                       TABLE 159 WATT FUEL CELL CORPORATION: PRODUCTS/SERVICES/SOLUTIONS OFFERED
                       TABLE 160 WATT FUEL CELL CORPORATION: DEALS
             12.1.9 ELCOGEN AS
                       TABLE 161 ELCOGEN AS: COMPANY OVERVIEW
                       TABLE 162 ELCOGEN AS: PRODUCTS/SERVICES/SOLUTIONS OFFERED
                       TABLE 163 ELCOGEN AS: DEALS
                       TABLE 164 ELCOGEN AS: OTHERS
             12.1.10 SUNFIRE GMBH
                       TABLE 165 SUNFIRE GMBH: COMPANY OVERVIEW
                       TABLE 166 SUNFIRE GMBH: PRODUCTS/SERVICES/SOLUTIONS OFFERED
                       TABLE 167 SUNFIRE GMBH: DEALS
                       TABLE 168 SUNFIRE GMBH: OTHERS
             12.1.11 SOLYDERA SPA
                       TABLE 169 SOLYDERA SPA: COMPANY OVERVIEW
                       TABLE 170 SOLYDERA SPA: PRODUCTS/SERVICES/SOLUTIONS OFFERED
                       TABLE 171 SOLYDERA SPA: DEALS
                       TABLE 172 SOLYDERA SPA: OTHERS
             12.1.12 H2E POWER
                       TABLE 173 H2E POWER: COMPANY OVERVIEW
                       TABLE 174 H2E POWER: PRODUCTS/SERVICES/SOLUTIONS OFFERED
                       TABLE 175 H2E POWER: DEALS
             12.1.13 UPSTART POWER, INC.
                       TABLE 176 UPSTART POWER, INC.: COMPANY OVERVIEW
                       TABLE 177 UPSTART POWER, INC.: PRODUCTS/SERVICES/SOLUTIONS OFFERED
                       TABLE 178 UPSTART POWER, INC.: DEALS
                       TABLE 179 UPSTART POWER, INC.: PRODUCT LAUNCHES
     12.2 OTHER PLAYERS 
             12.2.1 ZTEK CORPORATION, INC.
                       TABLE 180 ZTEK CORPORATION, INC.: COMPANY OVERVIEW
             12.2.2 SPECIAL POWER SOURCES
                       TABLE 181 SPECIAL POWER SOURCES: COMPANY OVERVIEW
             12.2.3 ADELAN
                       TABLE 182 ADELAN: COMPANY OVERVIEW
             12.2.4 SOFCMAN
                       TABLE 183 SOFCMAN: COMPANY OVERVIEW
             12.2.5 EDGE AUTONOMY
                       TABLE 184 EDGE AUTONOMY: COMPANY OVERVIEW
                       12.3 R&D PLAYERS
             12.3.1 FUELCELL ENERGY, INC.
                       TABLE 185 FUELCELL ENERGY, INC.: COMPANY OVERVIEW
                       FIGURE 55 FUELCELL ENERGY, INC.: COMPANY SNAPSHOT
                       TABLE 186 FUELCELL ENERGY, INC.: PRODUCTS/SERVICES/SOLUTIONS OFFERED
                       TABLE 187 FUELCELL ENERGY, INC.: DEALS
                       TABLE 188 FUELCELL ENERGY, INC.: OTHERS
             12.3.2 DOOSAN FUEL CELL CO., LTD.
                       TABLE 189 DOOSAN FUEL CELL CO., LTD.: COMPANY OVERVIEW
                       FIGURE 56 DOOSAN FUEL CELL CO., LTD.: COMPANY SNAPSHOT
                       TABLE 190 DOOSAN FUEL CELL CO., LTD.: DEALS
             12.3.3 ROBERT BOSCH GMBH
                       TABLE 191 ROBERT BOSCH GMBH: COMPANY OVERVIEW
                       FIGURE 57 ROBERT BOSCH GMBH: COMPANY SNAPSHOT
                       TABLE 192 ROBERT BOSCH GMBH: PRODUCTS/SERVICES/SOLUTIONS OFFERED
                       TABLE 193 ROBERT BOSCH GMBH: DEALS
                       TABLE 194 ROBERT BOSCH GMBH: OTHERS
             12.3.4 POSCOENERGY
                       TABLE 195 POSCOENERGY: COMPANY OVERVIEW
             12.3.5 CLARA VENTURE LABS
                       TABLE 196 CLARA VENTURE LABS: COMPANY OVERVIEW
             12.3.6 CUMMINS INC.
                       TABLE 197 CUMMINS INC.: COMPANY OVERVIEW
*Details on Business overview, Products/Services/Solutions offered, Recent Developments, MNM view might not be captured in case of unlisted companies.
 
13 APPENDIX (Page No. - 229)
     13.1 INSIGHTS FROM INDUSTRY EXPERTS 
     13.2 DISCUSSION GUIDE 
     13.3 KNOWLEDGESTORE: MARKETSANDMARKETS’ SUBSCRIPTION PORTAL 
     13.4 CUSTOMIZATION OPTIONS 
     13.5 RELATED REPORTS 
     13.6 AUTHOR DETAILS 

The study involved major activities in estimating the current size of the solid oxide fuel cell market. Exhaustive secondary research was done to collect information on the peer and parent markets. The next step was to validate these findings, assumptions, and sizing with industry experts across the value chain through primary research. Both top-down and bottom-up approaches were employed to estimate the total market size. Thereafter, market breakdown and data triangulation were used to estimate the market size of the segments and subsegments.

Secondary Research

This research study on the solid oxide fuel cell market involved the use of extensive secondary sources, directories, and databases, such as Bloomberg, Factiva, IRENA, International Energy Agency, Statista Industry Journal, and The Fuel Cell Energy Review, E4Tech, to collect and identify information useful for a technical, market-oriented, and commercial study of the solid oxide fuel cell market. The other secondary sources included annual reports, press releases & investor presentations of companies, white papers, certified publications, articles by recognized authors, manufacturer associations, trade directories, and databases.

Primary Research

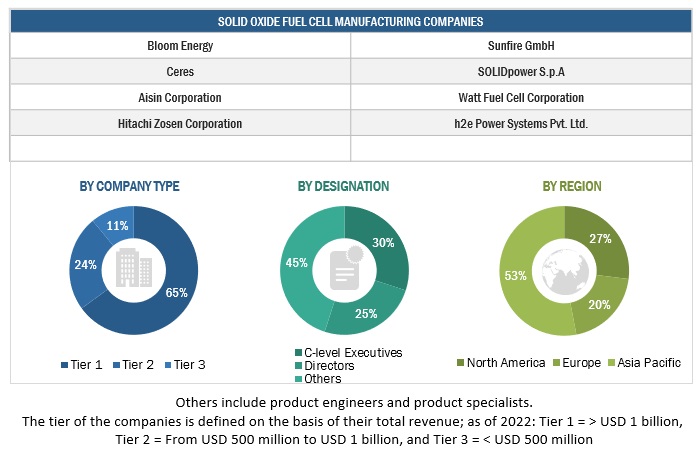
The solid oxide fuel cell market comprises several stakeholders, such as solid oxide fuel cell manufacturers, technology providers, and technical support providers in the supply chain. The demand side of this market is characterized by the rising demand for solid oxide fuel cell in automotive, aerospace, defense & government services, wireless communication & infrastructure, consumer electronics, medical equipment manufacturing and energy sector applications. The supply side is characterized by rising demand for contracts from the industrial sector and mergers & acquisitions among big players. Various primary sources from both the supply and demand sides of the market were interviewed to obtain qualitative and quantitative information. Following is the breakdown of primary respondents:
Solid Oxide Fuel Cell Market Size, and Share

To know about the assumptions considered for the study, download the pdf brochure

Market Size Estimation

Both top-down and bottom-up approaches were used to estimate and validate the total size of the solid oxide fuel cell market. These methods were also used extensively to estimate the size of various subsegments in the market. The research methodology used to estimate the market size includes the following:

  • The key players in the industry and market have been identified through extensive secondary research, and their market share has been determined through primary and secondary research.
  • The industry’s value chain and market size, in terms of value, have been determined through both primary and secondary research processes.
  • All percentage shares, splits, and breakdowns have been determined using secondary sources and verified through primary sources.

Solid Oxide Fuel Cell Market Size: Top-Down Approach

Solid Oxide Fuel Cell Market Size, and Share

To know about the assumptions considered for the study, Request for Free Sample Report

Data Triangulation

After arriving at the overall market size from the above estimation process, the total market has been split into several segments and subsegments. Data triangulation and market breakdown processes have been employed to complete the overall market engineering process and arrive at the exact statistics for all the segments and sub-segments, wherever applicable. The data has been triangulated by studying various factors and trends from both the demand- and supply sides. Along with this, the market has been validated using both the top-down and bottom-up approaches.

Market Definition

A solid oxide fuel cell (SOFC) is an electrochemical energy conversion device that generates power directly from fuel oxidation. During the electrochemical conversion, a solid or ceramic electrolyte material is inserted between the anode and cathode electrodes. This conversion technique directly generates power by oxidizing a fuel. SOFCs can also be considered as a form of flow battery as they continue to produce energy if the fuel is available and does not need to be recharged. In the market estimation, we have considered the system and the balance of plant costs.

The growth of the solid oxide fuel cell market during the forecast period can be attributed to the rising demand for backup power solutions in the commercial & industrial sector.

Key Stakeholders

  • Ceramic and electrolyte manufacturers
  • Environmental research institutes
  • Fuel cell and stack manufacturers
  • Government and research organizations
  • Institutional investors/shareholders
  • Power and energy associations
  • Repair and maintenance service providers
  • SOFC technology manufacturing companies
  • Organizations, forums, alliances, and associations
  • Research and consulting companies
  • State and national regulatory authorities

Objectives of the Study

  • To describe, segment, and forecast the solid oxide fuel cell market, by type, component, application, and end user, in terms of value
  • To forecast the solid oxide fuel cell market, by type, in terms of volume
  • To forecast the market across four key regions, namely, North America, Europe, Asia Pacific, and Rest of the World (RoW), along with country-level analysis
  • To provide detailed information about key drivers, restraints, opportunities, and challenges influencing the solid oxide fuel cell market
  • To strategically analyze the solid oxide fuel cell market with respect to individual growth trends, prospects, and contributions of each segment to the market
  • To analyze the supply chain, trends/disruptions impacting customer business, market/ecosystem, pricing trends, and regulatory landscape pertaining to solid oxide fuel cells

Available Customizations:

With the given market data, MarketsandMarkets offers customizations according to the specific requirements of companies. The following customization options are available for the report:

Product Analysis

  • Product Matrix, which provides a detailed comparison of the product portfolio of each company

Company Information

  • Detailed analyses and profiling of additional market players
Custom Market Research Services

We will customize the research for you, in case the report listed above does not meet with your exact requirements. Our custom research will comprehensively cover the business information you require to help you arrive at strategic and profitable business decisions.

Request Customization

Instant Answers with GPT - Ask Now!

Ask real questions. Get complete answers !
Report Code
EP 2467
Published ON
Oct, 2023
Choose License Type
BUY NOW
  • SHARE
X
Request Customization
Speak to Analyst
Speak to Analyst
OR FACE-TO-FACE MEETING
PERSONALIZE THIS RESEARCH
  • Triangulate with your Own Data
  • Get Data as per your Format and Definition
  • Gain a Deeper Dive on a Specific Application, Geography, Customer or Competitor
  • Any level of Personalization
REQUEST A FREE CUSTOMIZATION
LET US HELP YOU!
  • What are the Known and Unknown Adjacencies Impacting the Solid Oxide Fuel Cell Market
  • What will your New Revenue Sources be?
  • Who will be your Top Customer; what will make them switch?
  • Defend your Market Share or Win Competitors
  • Get a Scorecard for Target Partners
CUSTOMIZED WORKSHOP REQUEST
+1-888-600-6441
  • Call Us
  • +1-888-600-6441 (Corporate office hours)
  • +1-888-600-6441 (US/Can toll free)
  • +44-800-368-9399 (UK office hours)
CONNECT WITH US
ABOUT TRUST ONLINE
©2024 MarketsandMarkets Research Private Ltd. All rights reserved
DMCA.com Protection Status Website Feedback