Cleaner & Degreaser Aftermarket by Part (Cleaner (Brake, Carburettor, Engine Flush), Degreaser (Engine, Exhaust, Transmission)), Type (Water, Solvent Based), Supply (Aerosol Can, Spray Bottle), Service, Vehicle Type, and Region - Global Forecast to 2025


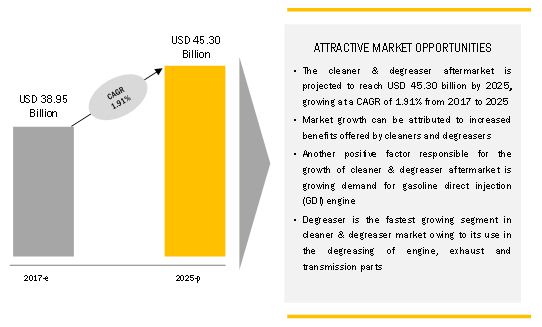
[168 Pages Report] The global cleaner & degreaser aftermarket size was valued at USD 38.95 billion in 2017 and is expected to reach USD 45.30 billion by 2025 at a CAGR of 1.91% during the forecast period 2017-2025. The base year considered for the study is 2016 and the forecast period is from 2017 to 2025. Growing demand for improved vehicle performance, increase in fuel efficiency, and the need to minimize vehicle emissions have triggered the growth of the cleaner & degreaser aftermarket.
Objectives of the Report
- To define, describe, analyze, and forecast (2017–2025) the market size, in terms of volume (million gallons) and value (USD million), of this market on the basis of parts, type, mode of supply, repair services, vehicle type, and region
- To analyze and forecast the market size, in terms of volume and value, of the cleaner & degreaser aftermarket by type (cleaner: water-based, solvent-based; degreaser: water-based, solvent-based)
- To analyze and forecast the market size, in terms of volume and value, of the aftermarket by supply mode (cleaner: spray bottle, aerosol can, jug, pail, and drum; degreaser: spray bottle, aerosol can, jug, pail, and drum)
- To analyze and forecast the market size, in terms of volume and value, ofaftermarket by parts (cleaner: brakes, carburetor, engine flush, catalytic converter, and others; degreaser: engine, exhaust, transmission, and others),
- To analyze and forecast the market size, in terms of volume and value, of the aftermarket by repair services (OES and IAM)
- To analyze and forecast the market size, in terms of volume and value, of the aftermarket by vehicle type (passenger car, LCV, and HCV)
- To define, describe, and project the aftermarket on the basis of region and country (Asia Pacific, North America, Europe, and the Rest of the World)
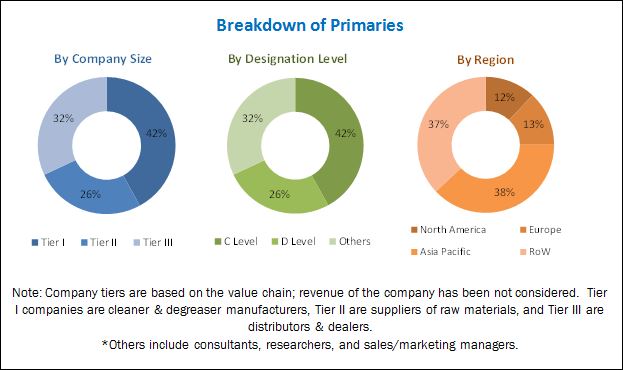
The research methodology used in the report involves primary and secondary sources and follows bottom-up & top-down approaches for data triangulation. Extensive secondary sources, directories, and databases have been used to gather and classify facts and figures useful for a technical, market-oriented, and commercial study of the cleaner & degreaser aftermarket. Secondary sources include associations such as International Organization of Motor Vehicle Manufacturers (OICA), Emission Controls Manufacturers Association (ECMA), European Automobile Manufacturers Association (ACEA), Environmental Protection Agency (EPA), and International Council on Clean Transportation (ICCT) along with paid databases and directories such as Factiva and Bloomberg. Primary interviews have been conducted to obtain and verify critical qualitative and quantitative information as well as to assess the prospects of the industry. The primary sources include experts from the core and related industries, suppliers, manufacturers, distributors, service providers, technology developers, and organizations related to various segments of this industry’s value chain. Detailed interviews have been conducted with various primary respondents that include key industry participants, subject matter experts (SMEs), C-level executives of key market players, and industry consultants. The aftermarket size, in terms of volume (million gallons) and value (USD million), for various regions has been derived using forecasting techniques based on the demand for cleaners and degreasers, vehicle sales, and vehicle parc trends. The prices of cleaners and degreasers have been validated through primary sources.
To know about the assumptions considered for the study, download the pdf brochure
The ecosystem of the cleaner & degreaser aftermarket consists of manufacturers and Tier I, Tier II, and Tier III suppliers such as BASF (Germany), 3M (US), WD-40 (US), and Dow (US).
Target Audience
- Engine degreaser and cleaner suppliers
- Engine coolant and lubricant suppliers
- Additives and surfactants suppliers
- Cleaning/degreasing vehicle components and garage equipment suppliers
- Vehicle repair and maintenance facilities
- Detailers shops
- Auto repair facilities
- Automotive dealers and distributors
- Research institutes and government organizations
- The automobile industry as an end-user industry and regional automobile associations
- Traders, distributors, and suppliers of raw materials used for engine degreaser
Get online access to the report on the World's First Market Intelligence Cloud
- Easy to Download Historical Data & Forecast Numbers
- Company Analysis Dashboard for high growth potential opportunities
- Research Analyst Access for customization & queries
- Competitor Analysis with Interactive dashboard
- Latest News, Updates & Trend analysis
Request Sample Scope of the Report
Get online access to the report on the World's First Market Intelligence Cloud
- Easy to Download Historical Data & Forecast Numbers
- Company Analysis Dashboard for high growth potential opportunities
- Research Analyst Access for customization & queries
- Competitor Analysis with Interactive dashboard
- Latest News, Updates & Trend analysis

Cleaner & Degreaser Aftermarket, By Parts
Cleaner & Degreaser Aftermarket, By Type
Cleaner & Degreaser Aftermarket, By Supply Mode
Cleaner & Degreaser Aftermarket, By Repair Services
Cleaner & Degreaser Aftermarket, By Vehicle Type
Cleaner & Degreaser Aftermarket, By Region
-
-
Cleaner
- Brakes
- Carburetor
- Engine Flush
- Catalytic Converter
- Others
-
Degreaser
- Engine
- Exhaust Parts
- Transmission
- Others
- Water-Based
- Solvent-Based
- Aerosol Can
- Spray Bottle
- Jug
- Pail
- Drum
- OES
- IAM
- Passenger Car
- LCV
- HCV
- Asia Pacific
- Europe
- North America
- Rest of the World
-
Cleaner
Available Customizations
Cleaner & Degreaser aftermarket, By Vehicle Type (country level)
Cleaner & Degreaser Aftermarket, By Parts (country level)
-
- Passenger car
- LCV
- HCV
-
Cleaner
- Brakes
- Carburetor
- Engine Flush
- Catalytic Converter
- Others
-
Degreaser
- Engine
- Exhaust Parts
- Transmission
- Others
(Countries include China, Japan, South Korea, India, Germany, France, UK, Italy, US, Mexico, Canada, Brazil, and Russia)
Increased concern towards maintenance of vehicle and growing stringent emission norms globally to trigger the demand for cleaner & degreaser aftermarket close to USD 45.30 billion by 2025
Cleaner and degreaser are the solvents used to remove the oil, dirt, and grease accumulated on the automotive parts from inside and outside. Degreaser and cleaner have different chemical compositions that help in cleaning more efficiently.
The increasing demand for better engine performance, improved fuel efficiency, and reducing vehicle emissions could boost the cleaner & degreaser aftermarket. On the other hand, the increasing sales of electric vehicles and health regulations can hinder the growth of the aftermarket.
Ongoing new product developments by leading companies for bio-degradable products to control pollution, and recent technological developments in automotive chemicals are likely to propel further growth of the aftermarket during the forecast period.
Market Dynamics
Drivers
-
Benefits offered by cleaners and degreasers.
- Improved engine performance
- Increased fuel efficiency
- Minimized vehicle emissions
- Growing demand for the gasoline direct injection (GDI) engine.
Restraints
- Technological advancements in engine coating.
Opportunities
- New technologies adopted for manufacturing cleaners and degreasers.
- Hybrid degreasers for heavy duty vehicles.
Challenges
- Home-made cleaners and degreasers.
- Health regulations.
Critical Questions:
- The cleaner & degreaser aftermarket is going through demand-supply gap, when will this scenario ease out?
- How and why OES is the fastest growing market in cleaner & degreaser aftermarket?
- How the industry players will address the challenge of unorganized players in cleaner & degreaser aftermarket?
The cleaner & degreaser aftermarket is projected to grow at a CAGR of 1.91% during the forecast period, from USD 38.95 Billion in 2017 to USD 45.30 Billion by 2025. Rising demand for better fuel efficiency, larger vehicle parc, increasing vehicle sales, and the increasing average vehicle miles travelled every year have fueled the growth of this market.
This Market has been segmented on the basis of parts. The cleaner aftermarket is further divided into the brake, carburetor, engine flush, catalytic converter, and others. The degreaser aftermarket is further divided into the engine, exhaust, transmission, and others. The growth of the cleaner and degreaser aftermarket can be attributed to the increasing adoption of preventive/periodic maintenance services in vehicles. Preventive/periodic maintenance not only increases the average vehicle age but also enhances fuel efficiency. Likewise, the growth of the cleaner & degreaser aftermarket for engine flush cleaner can be attributed to factors such as a worldwide increase in vehicle sales and increased average vehicle miles travelled.
The cleaner & degreaser aftermarket has been segmented by type. The cleaner market is further segmented into water and solvent based cleaners. Water-based cleaners use water as a base instead of a chemical. Water-based cleaners do not contain harmful chemicals that are found in solvent-based cleaners. Asian countries use water-based cleaners as these countries do not have norms related to proper disposal of cleaners & degreasers. On the other hand, countries such as Germany and the US have a higher demand for solvent-based cleaners as these countries have stringent norms for environment protection. However, the increasing adoption of bio-degradable cleaner and degreaser products globally, which are primarily water-based, will drive the growth of water-based aftermarket. Hence, in the future, water-based cleaners and degreasers are expected to witness higher demand owing to their benefits over solvent-based cleaners and degreasers.
The cleaner & degreaser aftermarket has been segmented on the basis of supply modes into aerosol can, drum, jug, pail, and spray bottle. The aftermarket for spray bottles is expected to show the fastest growth. The spray bottle offers capacities of 12, 14, 16, 20, 22, 24, and 32 ounces. Smaller capacity bottles are used for cleaning hard to reach places. The spray bottles are made of different materials such as aluminum, stainless steel, brass, plastic, and others. Spray bottles, if used properly, can help to achieve cost benefits. Also, these bottles can be refilled. Owing to such advantages, spray bottles are expected to see a huge demand in the future.
The cleaner & degreaser aftermarket has been segmented on the basis of repair services into Original Equipment Suppliers (OES) and Independent Aftermarket (IAM). OES suppliers include authorized dealers and service stations. The OES repair services are preferred owing to the quality, reliability, and warranty of products used for cleaning and maintenance. However, IAM is estimated to hold the largest share of this Market. The IAM represents large workshop chains and small independent garages. The cleaners and degreasers used in the independent aftermarket are easily available and cheaper than those used in the OES.
The cleaner & degreaser aftermarket has been segmented on the basis of vehicle type into passenger cars, light commercial vehicles (LCV), and heavy commercial vehicles (HCV). Passenger car segment is estimated to be the largest and fastest growing market as the production and sale of passenger cars is higher than commercial vehicles. Also, the on-road vehicle number for passenger cars is very high. Hence, the aftermarket for passenger cars is estimated to have the largest share.
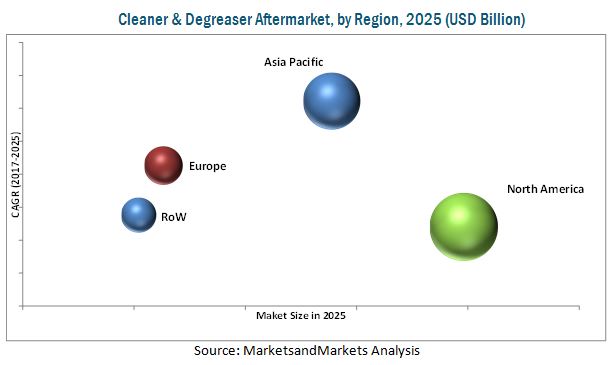
North America is expected to dominate the cleaner & degreaser aftermarket during the forecast period. Increasing commercial vehicle sales, awareness about cleaners and degreasers products, and increased average vehicle miles travelled are driving the growth of the aftermarket in the region. Asia Pacific is estimated to be the fastest growing aftermarket during the forecast period. The market growth in the region can be attributed to the increasing awareness of the benefits of cleaner and degreaser products, periodic maintenance services, stringent emission norms, and others. These factors have played a vital role in driving repair services, which in turn help in the growth of this market.
The key factor restraining the growth of th is the technological advancement in engine coating. To address fuel efficiency challenges in internal combustion engines, OEMs are innovating with technology advancements in multiple areas including the reduction of carbon deposits in the engine. Anti-coking coatings have been developed to reduce the carbon deposit in the engine. These coatings prevent carbon catalytic interaction with injector metals and significantly reduce carbon deposits on the surface of the engine. Hence, the cleaning and degreasing requirements are reduced, which is likely to have an adverse effect on the growth of the cleaner & degreaser aftermarket. The aftermarket is dominated by a few global players. Some of the key manufacturers operating in the market are BASF (Germany), 3M (US), WD-40 (US), DOW (US), Wurth (Germany), and FUCHS (Germany).
To speak to our analyst for a discussion on the above findings, click Speak to Analyst
Table of Contents
1 Introduction (Page No. - 16)
1.1 Objectives of the Study
1.2 Market Definition
1.3 Market Scope
1.3.1 Years Considered in the Study
1.4 Currency
1.5 Package Size
1.6 Limitations
1.7 Stakeholders
2 Research Methodology (Page No. - 21)
2.1 Research Data
2.2 Secondary Data
2.2.1 Key Secondary Sources
2.2.2 Data From Secondary Sources
2.3 Primary Data
2.3.1 Sampling Techniques & Data Collection Methods
2.3.2 Primary Participants
2.4 Factor Analysis
2.4.1 Introduction
2.4.2 Demand-Side Analysis
2.4.2.1 Increasing Vehicle Parc is Driving the Demand for Repair & Maintenance
2.4.3 Supply-Side Analysis
2.4.3.1 Distribution Channel Strategy in the Cleaner & Degreaser Aftermarket
2.4.3.2 Dilution Rate of Cleaner & Degreaser With Water
2.5 Market Size Estimation
2.5.1 Bottom-Up Approach
2.5.2 Top-DOWn Approach
2.6 Data Triangulation
2.7 Assumptions
3 Executive Summary (Page No. - 34)
4 Premium Insights (Page No. - 42)
4.1 Attractive Opportunities in the Cleaner & Degreaser Aftermarket
4.2 Aftermarket
4.3 Aftermarket, By Region
4.4 Aftermarket, By Country
4.5 Aftermarket, By Vehicle Type
4.6 Aftermarket, By Supply Mode
4.7 Aftermarket, By Type
4.8 Aftermarket, By Parts
4.9 Aftermarket, By Repair Services
5 Market Overview (Page No. - 50)
5.1 Introduction
5.2 Market Dynamics
5.2.1 Drivers
5.2.1.1 Benefits Offered By Cleaners and Degreasers
5.2.1.1.1 Improved Engine Performance
5.2.1.1.2 Increased Fuel Efficiency
5.2.1.1.3 Minimized Vehicle Emissions
5.2.1.2 Growing Demand for the Gasoline Direct Injection (GDI) Engine
5.2.2 Restraints
5.2.2.1 Technological Advancements in Engine Coating
5.2.3 Opportunities
5.2.3.1 New Technologies Adopted for Manufacturing Cleaners and Degreasers
5.2.3.2 Hybrid Degreasers for Heavy Duty Vehicles
5.2.4 Challenges
5.2.4.1 Home-Made Cleaners and Degreasers
5.2.4.2 Health Regulations
5.2.5 Macro Indicator Analysis
5.2.5.1 Introduction
5.2.5.2 Us
5.2.5.3 China
5.2.5.4 Germany
6 Cleaner & Degreaser Aftermarket, By Parts (Page No. - 61)
Note: The Segment is Further Divided Into Region (Asia Pacific, Europe, North America & RoW)
6.1 Introduction
6.2 Cleaner Aftermarket, By Parts
6.2.1 Brake Cleaner
6.2.2 Carburetor Cleaner
6.2.3 Engine Flush Cleaner
6.2.4 Catalytic Converter Cleaner
6.2.5 Other Cleaners
6.3 Degreaser Aftermarket, By Parts
6.3.1 Engine Degreaser
6.3.2 Exhaust Parts Degreaser
6.3.3 Transmission Degreaser
6.3.4 Other Degreasers
7 Cleaner & Degreaser Aftermarket, By Type (Page No. - 75)
Note: The Segment is Further Divided Into Region (Asia Pacific, Europe, North America & RoW)
7.1 Introduction
7.1.1 Water-Based
7.1.2 Solvent-Based
7.2 Cleaner Aftermarket, By Type
7.2.1 Water-Based
7.2.2 Solvent-Based
7.3 Degreaser Aftermarket, By Type
7.3.1 Water-Based
7.3.2 Solvent-Based
8 Cleaner & Degreaser Aftermarket, By Supply Mode (Page No. - 83)
Note: The Segment is Further Divided Into Region (Asia Pacific, Europe, North America & RoW)
8.1 Introduction
8.1.1 Aerosol Can
8.1.2 Drum
8.1.3 Jug
8.1.4 Pail
8.1.5 Spray Bottle
8.2 Cleaner Aftermarket, By Supply Mode
8.2.1 Aerosol Can
8.2.2 Drum
8.2.3 Pail
8.2.4 Jug
8.2.5 Spray Bottle
8.3 Degreaser Aftermarket, By Supply Mode
8.3.1 Aerosol Can
8.3.2 Drum
8.3.3 Jug
8.3.4 Pail
8.3.5 Spray Bottle
9 Cleaner & Degreaser Aftermarket, By Repair Services (Page No. - 96)
Note: The Segment is Further Divided Into Region (Asia Pacific, Europe, North America & RoW)
9.1 Introduction
9.2 Original Equipment Supplier (OES)
9.3 Independent Aftermarket (IAM)
10 Cleaner & Degreaser Aftermarket, By Vehicle Type (Page No. - 101)
Note: The Segment is Further Divided Into Region (Asia Pacific, Europe, North America & RoW)
10.1 Introduction
10.2 Passenger Car
10.3 Light Commercial Vehicle
10.4 Heavy Commercial Vehicle
11 Cleaner & Degreaser Aftermarket, By Region (Page No. - 107)
11.1 Introduction
11.2 North America
11.2.1 US
11.2.2 Mexico
11.2.3 Canada
11.3 Europe
11.3.1 Germany
11.3.2 France
11.3.3 UK
11.4 Asia Pacific
11.4.1 China
11.4.2 Japan
11.4.3 South Korea
11.4.4 India
11.5 RoW
11.5.1 Russia
11.5.2 Brazil
12 Competitive Landscape (Page No. - 130)
12.1 Introduction
12.2 Market Ranking Analysis
12.3 Competitive Scenario
13 Company Profiles (Page No. - 135)
(Business Overview, Products Offered, Recent Developments, SWOT Analysis, MnM View)*
13.1 BASF
13.2 3M
13.3 WD-40
13.4 DOW
13.5 Fuchs
13.6 Wurth
13.7 Zep
13.8 Penray
13.9 Radiator
13.10 Abro
*Details on Business Overview, Products Offered, Recent Developments, SWOT Analysis, MnM View Might Not Be Captured in Case of Unlisted Companies.
14 Appendix (Page No. - 159)
14.1 Insights of Industry Experts
14.2 Discussion Guide
14.3 Knowledge Store: Marketsandmarkets’ Subscription Portal
14.4 Introducing RT: Real Time Market Intelligence
14.5 Available Customizations
14.5.1 Aftermarket, By Vehicle Type (Country Level)
14.5.1.1 Passenger Car
14.5.1.2 Lcv
14.5.1.3 Hcv
14.5.2 Aftermarket, By Parts (Country Level)
14.5.2.1 Cleaner
14.5.2.1.1 Brake Cleaner
14.5.2.1.2 Engine Flush Cleaner
14.5.2.1.3 Catalytic Converter Cleaner
14.5.2.1.4 Carburetor Cleaner
14.5.2.1.5 Other Cleaners
14.5.2.2 Degreaser
14.5.2.2.1 Engine Degreaser
14.5.2.2.2 Exhaust Parts Degreaser
14.5.2.2.3 Transmission Degreaser
14.5.2.2.4 Other Degreasers
14.6 Related Reports
14.7 Author Details
List of Tables (126 Tables)
Table 1 Currency Exchange Rates (W.R.T. USD)
Table 2 Dilution Chart of Cleaner & Degreaser for Different Conditions
Table 3 Dilution Chart of Cleaner & Degreaser for Different Parts
Table 4 Technologies Adopted By the Companies in the Cleaner & Degreaser Aftermarket
Table 5 VOC Limits are Expressed as Percentage By Weight
Table 6 Cleaner Aftermarket, By Parts, 2015–2025 (Million Gallons)
Table 7 Cleaner Aftermarket, By Parts, 2015–2025 (USD Million)
Table 8 Brake Cleaner Aftermarket, By Region, 2015–2025 (Million Gallons)
Table 9 Brake Cleaner Aftermarket, By Region, 2015–2025 (USD Million)
Table 10 Carburetor Cleaner Aftermarket, By Region, 2015–2025 (Million Gallons)
Table 11 Carburetor Cleaner Aftermarket, By Region, 2015–2025 (USD Million)
Table 12 Engine Flush Cleaner Aftermarket, By Region, 2015–2025 (Million Gallons)
Table 13 Engine Flush Cleaner Aftermarket, By Region, 2015–2025 (USD Million)
Table 14 Catalytic Converter Cleaner Aftermarket, By Region, 2015–2025 (Million Gallons)
Table 15 Catalytic Converter Cleaner Aftermarket, By Region, 2015–2025 (USD Million)
Table 16 Other Cleaners Aftermarket, By Region, 2015–2025 (Million Gallons)
Table 17 Other Cleaners Aftermarket, By Region, 2015–2025 (USD Million)
Table 18 Degreaser Aftermarket, By Parts, 2015–2025 (Million Gallons)
Table 19 Degreaser Aftermarket, By Parts, 2015–2025 (USD Million)
Table 20 Engine Degreaser Aftermarket, By Region, 2015–2025 (Million Gallons)
Table 21 Engine Degreaser Aftermarket, By Region, 2015–2025 (USD Million)
Table 22 Exhaust Parts Degreaser Aftermarket, By Region, 2015–2025 (Million Gallons)
Table 23 Exhaust Parts Degreaser Aftermarket, By Region, 2015–2025 (USD Million)
Table 24 Transmission Degreaser Aftermarket, By Region, 2015–2025 (Million Gallons)
Table 25 Transmission Degreaser Aftermarket, By Region, 2015–2025 (USD Million)
Table 26 Other Degreasers Aftermarket, By Region, 2015–2025 (Million Gallons)
Table 27 Other Degreasers Aftermarket, By Region, 2015–2025 (USD Million)
Table 28 Cleaner & Degreaser Aftermarket, By Type, 2015–2025 (Million Gallons)
Table 29 Aftermarket, By Type, 2015–2025 (USD Million)
Table 30 Cleaner Aftermarket, By Type, 2015–2025 (Million Gallons)
Table 31 Cleaner Aftermarket, By Type, 2015–2025 (USD Million)
Table 32 Water-Based Cleaner Aftermarket, By Region, 2015–2025 (Million Gallons)
Table 33 Water-Based Cleaner Aftermarket, By Region, 2015–2025 (USD Million)
Table 34 Solvent-Based Cleaner Aftermarket, By Region, 2015–2025 (Million Gallons)
Table 35 Solvent-Based Cleaner Aftermarket, By Region, 2015–2025 (USD Million)
Table 36 Degreaser Aftermarket, By Type, 2015–2025 (Million Gallons)
Table 37 Degreaser Aftermarket, By Type, 2015–2025 (USD Million)
Table 38 Water-Based Degreaser Aftermarket, By Region, 2015–2025 (Million Gallons)
Table 39 Water-Based Degreaser Aftermarket, By Region, 2015–2025 (USD Million)
Table 40 Solvent-Based Degreaser Aftermarket, By Region, 2015–2025 (Million Gallons)
Table 41 Solvent-Based Degreaser Aftermarket, By Region, 2015–2025 (USD Million)
Table 42 Cleaner & Degreaser Aftermarket, By Supply Modes, 2015–2025 (Million Gallons)
Table 43 Aftermarket, By Supply Modes, 2015–2025 (USD Million)
Table 44 Cleaner Aftermarket, By Supply Mode, 2015–2025 (Million Gallons)
Table 45 Cleaner Aftermarket, By Supply Mode, 2015–2025 (USD Million)
Table 46 Aerosol Can Cleaner Aftermarket, By Region, 2015–2025 (Million Gallons)
Table 47 Aerosol Can Cleaner Aftermarket, By Region, 2015–2025 (USD Million)
Table 48 Drum Cleaner Aftermarket, By Region, 2015–2025 (Million Gallons)
Table 49 Drum Cleaner Aftermarket, By Region, 2015–2025 (USD Million)
Table 50 Pail Cleaner Aftermarket, By Region, 2015–2025 (Million Gallons)
Table 51 Pail Cleaner Aftermarket, By Region, 2015–2025 (USD Million)
Table 52 Jug Cleaner Aftermarket, By Region, 2015–2025 (Million Gallons)
Table 53 Jug Cleaner Aftermarket, By Region, 2015–2025 (USD Million)
Table 54 Spray Bottle Cleaner Aftermarket, By Region, 2015–2025 (Million Gallons)
Table 55 Spray Bottle Cleaner Aftermarket, By Region, 2015–2025 (USD Million)
Table 56 Degreaser Aftermarket, By Supply Mode, 2015–2025 (Million Gallons)
Table 57 Degreaser Aftermarket, By Supply Mode, 2015–2025 (USD Million)
Table 58 Aerosol Can Degreaser Aftermarket, By Region, 2015–2025 (Million Gallons)
Table 59 Aerosol Can Degreaser Aftermarket, By Region, 2015–2025 (USD Million)
Table 60 Drum Degreaser Aftermarket, By Region, 2015–2025 (Million Gallons)
Table 61 Drum Degreaser Aftermarket, By Region, 2015–2025 (USD Million)
Table 62 Jug Degreaser Aftermarket, By Region, 2015–2025 (Million Gallons)
Table 63 Jug Degreaser Aftermarket, By Region, 2015–2025 (USD Million)
Table 64 Pail Degreaser Aftermarket, By Region, 2015–2025 (Million Gallons)
Table 65 Pail Degreaser Aftermarket, By Region, 2015–2025 (USD Million)
Table 66 Spray Bottle Degreaser Aftermarket, By Region, 2015–2025 (Million Gallons)
Table 67 Spray Bottle Degreaser Aftermarket, By Region, 2015–2025 (USD Million)
Table 68 Cleaner & Degreaser Aftermarket, By Repair Services, 2015–2025 (Million Gallons)
Table 69 Aftermarket, By Repair Services, 2015–2025 (USD Million)
Table 70 Original Equipment Supplier (OES) Repair Services Aftermarket, By Region, 2015–2025 (Million Gallons)
Table 71 Original Equipment Supplier (OES) Repair Services Aftermarket, By Region, 2015–2022 (USD Million)
Table 72 IAM Repair Services Aftermarket, By Region, 2015–2022 (Million Gallons)
Table 73 IAM Repair Services Aftermarket, By Region, 2015–2022 (USD Million)
Table 74 Cleaner & Degreaser Aftermarket, By Vehicle Type, 2015–2025 (Million Gallons)
Table 75 Aftermarket, By Vehicle Type, 2015–2025 (USD Million)
Table 76 Passenger Car Aftermarket, By Region, 2015–2025 (Million Gallons)
Table 77 Passenger Car Aftermarket, By Region, 2015–2025 (USD Million)
Table 78 Light Commercial Vehicles Aftermarket, By Region, 2015–2025 (Million Gallons)
Table 79 Light Commercial Vehicles Aftermarket, By Region, 2015–2025 (USD Million)
Table 80 Heavy Commercial Vehicles Aftermarket, By Region, 2015–2025 (Million Gallons)
Table 81 Heavy Commercial Vehicles Aftermarket, By Region, 2015–2025 (USD Million)
Table 82 Cleaner & Degreaser Aftermarket, By Region, 2015–2025 (Million Gallons)
Table 83 Aftermarket, By Region, 2015–2025 (USD Million)
Table 84 Aftermarket, 2015–2025 (Million Gallons)
Table 85 Aftermarket, 2015–2025 (USD Million)
Table 86 North America Aftermarket, By Country, 2015–2025 (Million Gallons)
Table 87 North America Aftermarket, By Country, 2015–2025 (USD Million)
Table 88 US Aftermarket, 2015–2025 (Million Gallons)
Table 89 US Aftermarket, 2015–2025 (USD Million)
Table 90 Mexico Aftermarket, 2015–2025 (Million Gallons)
Table 91 Mexico Aftermarket, 2015–2025 (USD Million)
Table 92 Canada Aftermarket, 2015–2025 (Million Gallons)
Table 93 Canada Aftermarket, 2015–2025 (USD Million)
Table 94 Europe Aftermarket, By Country, 2015–2025 (Million Gallons)
Table 95 Europe Aftermarket, By Country, 2015–2025 (USD Million)
Table 96 Europe Aftermarket, 2015–2025 (Million Gallons)
Table 97 Europe Aftermarket, 2015–2025 (USD Million)
Table 98 Germany Aftermarket, 2015–2025 (Million Gallons)
Table 99 Germany Aftermarket, 2015–2025 (USD Million)
Table 100 France Aftermarket, 2015–2025 (Million Gallons)
Table 101 France Aftermarket, 2015–2025 (USD Million)
Table 102 UK Aftermarket, 2015–2025 (Million Gallons)
Table 103 UK Aftermarket, 2015–2025 (USD Million)
Table 104 Asia Pacific Aftermarket, By Country, 2015–2025 (Million Gallons)
Table 105 Asia Pacific Aftermarket, By Country, 2015–2025 (USD Million)
Table 106 Asia Pacific Aftermarket, 2015–2025 (Million Gallons)
Table 107 Asia Pacific Aftermarket, 2015–2025 (USD Million)
Table 108 China Aftermarket, 2015–2025 (Million Gallons)
Table 109 China Aftermarket, 2015–2025 (USD Million)
Table 110 Japan Aftermarket, 2015–2025 (Million Gallons)
Table 111 Japan Aftermarket, 2015–2025 (USD Million)
Table 112 South Korea Aftermarket, 2015–2025 (Million Gallons)
Table 113 South Korea Aftermarket, 2015–2025 (USD Million)
Table 114 India Aftermarket, 2015–2025 (Million Gallons)
Table 115 India Aftermarket, 2015–2025 (USD Million)
Table 116 RoW Aftermarket, By Country, 2015–2025 (Million Gallons)
Table 117 RoW Aftermarket, By Country, 2015–2025, (USD Million)
Table 118 RoW Aftermarket, 2015–2025 (Million Gallons)
Table 119 RoW Aftermarket, 2015–2025 (USD Million)
Table 120 Russia Aftermarket, 2015–2025 (Million Gallons)
Table 121 Russia Aftermarket, 2015–2025 (USD Million)
Table 122 Brazil Aftermarket, 2015–2025 (Million Gallons)
Table 123 Brazil Aftermarket, 2015–2025 (USD Million)
Table 124 Aftermarket Ranking: 2016
Table 125 Supply Contracts/Partnerships/Joint Ventures, 2017
Table 126 New Product Developments, 2016–2017
List of Figures (52 Figures)
Figure 1 Research Design
Figure 2 Research Methodology Model
Figure 3 Breakdown of Primary Interviews: By Company Type, Designation, & Region
Figure 4 Vehicle Parc for Key Countries, 2016–2025 (Million Units)
Figure 5 Distribution Channel Layers
Figure 6 Bottom-Up Approach
Figure 7 Top-DOWn Approach
Figure 8 North America is Expected to Dominate the Cleaner & Degreaser Aftermarket, 2017 vs 2025 (USD Million)
Figure 9 Passenger Car Segment Estimated to Be the Largest Market for Aftermarket, 2017 vs 2025 (USD Million)
Figure 10 Engine Flush Cleaner & Exhaust Parts Degreaser Estimated to Have the Largest Aftermarket, 2017 vs 2025 (USD Million)
Figure 11 Solvent-Based Cleaner & Degreaser Estimated to Dominate the Aftermarket, 2017 vs 2025 (USD Million)
Figure 12 China & India are Projected to Be the Fastest Growing Markets During the Forecast Period, 2017 vs 2025 (USD Million)
Figure 13 Aerosol Can is Estimated to Be the Largest Aftermarket, 2017 vs 2025 (USD Million)
Figure 14 IAM is Estimated to Be the Largest Aftermarket, 2017 vs 2025 (USD Million)
Figure 15 Increasing Awareness Toward Vehicle Maintenance to Drive the Aftermarket in the Coming Years
Figure 16 Degreaser Aftermarket is Estimated to Lead the Aftermarket, 2017 vs 2025 (USD Million)
Figure 17 North America to Hold the Largest Share During the Forecast Period, 2017 vs 2025 (USD Billion)
Figure 18 China & India are Projected to Showcase the Highest Growth Rate During the Forecast Period, 2017-2025 (USD Billion)
Figure 19 Passenger Car Segment Estimated to Lead the Aftermarket During Forecast Period, 2017 vs 2025 (USD Million)
Figure 20 Aerosol Can Supply Mode is Projected to Be the Largest Supply Mode for Aftermarket, 2017 vs 2025 (USD Billion)
Figure 21 Solvent-Based Cleaner & Degreaser to Lead the Market in the Year 2017 (USD Billion)
Figure 22 Engine Flush Cleaner & Exhaust Degreaser to Have the Largest Aftermarket, 2017 vs 2025 (USD Billion)
Figure 23 Independent Aftermarket (IAM) is Estimated to Hold the Largest Share in Aftermarket, 2017 vs 2025 (USD Million)
Figure 24 Market Dynamics
Figure 25 GDI System Market, By Region, 2017 vs 2025 (USD Million)
Figure 26 Global Commercial Vehicle Parc, 2005–2015 (Thousand Units)
Figure 27 US: Macro Indicators
Figure 28 China: Macro Indicators
Figure 29 Germany: Macro Indicators
Figure 30 Cleaner Aftermarket, By Parts, 2015–2025 (Million Gallons)
Figure 31 Degreaser Aftermarket, By Parts, 2015–2025 (USD Million)
Figure 32 Cleaner & Degreaser Aftermarket, By Type, 2015–2025 (Million Gallons)
Figure 33 Aftermarket, By Supply Modes, 2015–2025 (USD Million)
Figure 34 Aftermarket, By Repair Services, 2015–2025 (USD Billion)
Figure 35 Aftermarket, By Vehicle Type, 2015–2025 (USD Million)
Figure 36 North America Holds the Largest Share in Aftermarket During the Forecast Period, 2017-2025 (USD Million)
Figure 37 North America: Aftermarket Snapshot
Figure 38 Europe Aftermarket, By Country, 2017 vs 2025 (USD Million)
Figure 39 Asia Pacific Aftermarket Snapshot
Figure 40 RoW Aftermarket, By Country, 2017 vs 2025 (USD Million)
Figure 41 Key Developments, By Leading Players
Figure 42 BASF: Company Snapshot
Figure 43 BASF: SWOT Analysis
Figure 44 3M: Company Snapshot
Figure 45 3M: SWOT Analysis
Figure 46 WD-40: Company Snapshot
Figure 47 WD-4o: SWOT Analysis
Figure 48 DOW: Company Snapshot
Figure 49 DOW: SWOT Analysis
Figure 50 Fuchs: Company Snapshot
Figure 51 Fuchs: SWOT Analysis
Figure 52 Wurth: Company Snapshot


Growth opportunities and latent adjacency in Cleaner & Degreaser Aftermarket