LED Driver Market for Lighting, by Driving Method (Constant Current and Constant Voltage), Luminaire Type (A-Type, T-Lamps, Reflectors, Integral Modules), Components (Driver IC and Discrete), End User Application, and Geography - Global Forecasts to 2022


The global LED driver market for lighting is expected to reach USD 24.98 Billion by 2022, at a CAGR of 26.3% between 2016 and 2022. Growing adoption of LED lighting in general lighting applications, increasing demand for energy-efficient lighting systems, integration of IoT and lighting, and acceptance of standard protocols for lighting control are driving the growth of this market. The base year considered for this report is 2015, and the forecast period for the LED driver market has been considered for the period between 2016 and 2022.
This report covers the major segments of the market, namely, driving method (constant current LED driver and constant voltage LED driver), luminaire type (A-type, T-lamps, reflectors, decorative lamps, integral LED modules), end-user application (commercial lighting, industrial lighting, residential lighting, outdoor & traffic lighting and others), and geography. The market size estimations for these segments are provided in this report, along with the key trends and market dynamics related to these segments.
This research study involves the extensive use of secondary sources, directories, and databases (such as Hoovers, Bloomberg Business, Factiva, and OneSource) to identify and collect information useful for this study. The research methodology followed in this report is explained below.
- Analysis of all the end-user applications in which LED drivers for lighting are used worldwide
- Analysis of various LED drivers sold to these industries
- Analysis of the penetration of LED drivers in these industries
- Estimation of the market size in terms of volume
- Estimation of the market size of the LED drivers in end-user applications by driving method
- Overall market size finalized by data triangulation with supply-side data, including product developments, supply chain, and estimated sales of LED driver modules
After arriving at the overall market size, the total market has been split into several segments and subsegments and confirmed with the key industry experts. The figure below shows the breakdown of primaries on the basis of company type, designation, and region.
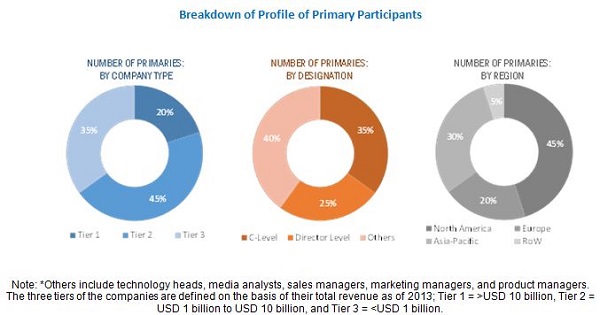
To know about the assumptions considered for the study, download the pdf brochure
The LED driver ecosystem comprises hardware component manufacturers, prototype designers, and original equipment manufacturers (OEMs); LED driver module providers such as Osram GmbH (Germany), and Harvard Engineering (U.K.); LED driver IC providers such as, Texas Instruments (U.S.), Maxim Integrated (U.S.), and Macroblock, Inc. (Taiwan) among others.
Target Audience:
- LED module manufacturers
- LED IC manufacturers
- Lighting integrators
- Government bodies
The report provides the competitive landscape of key players, including their growth strategies to enhance their position in the LED driver market for lighting. The report also provides the profiles of the key companies in the LED driver market for lighting including Osram GmbH (Germany), Harvard Engineering (U.K.), Texas Instruments (U.S.), Maxim Integrated (U.S.), Macroblock Inc. (Taiwan), Atmel Corporation (U.S.), General Electric (U.S.), Cree, Inc. (U.S.), ROHM Semiconductors (Japan), ON Semiconductor (U.S.), and AC Electronics (U.S.).
The market in this report has been segmented as follows:
LED Driver Market, by Driving Method:
- Constant Current LED Driver
- Constant Voltage LED Driver
Market, by Luminaire Type:
- Type A-Lamps
- T-Lamps
- Reflectors
- Decorative Lamps
- Integral LED Modules
Market, by End-User Application:
- Commercial Lighting
- Industrial Lighting
- Residential Lighting
- Outdoor & Traffic Lighting
- Others
Market, by Geography:
- North America
- Europe
- APAC
- RoW
Available Customizations:
With the given market data, MarketsandMarkets offers customizations according to the company�s specific needs. The following customization options are available for the report.
Geographical Analysis
- Comprehensive coverage of regulations followed in each region (North America, APAC, Europe, RoW)
Company Information
- Detailed analysis and profiling of additional market players (up to five)
The global LED driver market for lighting is expected to exhibit high growth potential till 2022. The overall market is expected to reach USD 24.98 Billion by 2022, at a CAGR of 26.3% between 2016 and 2022. Growing adoption of LED lighting, in general lighting applications, increasing demand for energy-efficient lighting systems, integration of IoT and lighting, and acceptance of standard protocols for lighting control are the major factors driving the growth of LED driver market.
Constant current LED drivers are expected to be the dominant LED driver by driving method during the forecasted period. The reason for the dominance of constant current LED drivers over constant voltage LED drivers is because they avoid violating the maximum current specified for the LEDs, therefore, avoiding burnout/thermal runaway.
The market for LED drivers segmented on the basis of luminaire type is expected to be dominated by Type-A lamps. Lamps with integrated modules are expected to witness the fastest growth as fully integrated modules inside an LED system are preferred over conventionally assembled LED systems for the end users as it helps in cost cutting.
Outdoor & traffic lighting is expected to lead the end-user application of the LED driver market. Every lighting control project in street lights requires specific solutions that are apt for the road. As different types of roads such as streets, main roads, and highways need different control strategies, many projects need multiple solutions to take full advantage of energy savings.
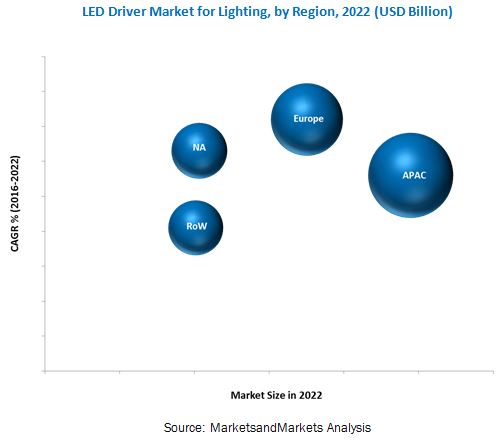
Europe held the second-largest share of the LED driver market for lighting in 2015, while the market in APAC is expected to be the largest as well as is estimated to grow at the highest CAGR during the forecast period. This growth of the LED driver market in APAC can be attributed to the greater demand for energy saving lighting systems and a growing population. The LED driver market for lighting in APAC is at the developing stage and the ongoing development in this region makes it a lucrative and high-potential market.
Lack of awareness regarding installation of LED drivers for lighting and lack of common standards among various manufacturers are the major restraints for the growth of this market. The major players in the market are Osram GmbH (Germany), Harvard Engineering (U.K.), Texas Instruments (U.S.), Maxim Integrated (U.S.), Macroblock, Inc. (Taiwan), and others. These players adopted various strategies such as new product developments, mergers, partnerships, collaborations, and business expansions to boost their revenue in the LED driver market for lighting.
To speak to our analyst for a discussion on the above findings, click Speak to Analyst
Table of Contents
1 Introduction (Page No. - 13)
1.1 Objectives of the Study
1.2 Market Definition
1.3 Study Scope
1.3.1 Markets Covered
1.3.2 Geographic Scope
1.3.3 Years Considered for the Study
1.4 Currency
1.5 Package Size
1.6 Limitations
1.7 Stakeholders
2 Research Methodology (Page No. - 17)
2.1 Research Data
2.1.1 Secondary Data
2.1.1.1 Key Data From Secondary Sources
2.1.2 Primary Data
2.1.2.1 Key Data From Primary Sources
2.1.2.2 Key Industry Insights
2.1.2.3 Breakdown of Primaries
2.2 Market Size Estimation
2.3 Market Breakdown and Data Triangulation
2.4 Research Assumptions
2.4.1 Assumptions
3 Executive Summary (Page No. - 25)
4 Premium Insights (Page No. - 30)
4.1 Attractive Market Opportunities in the Global LED Driver Market for Lighting
4.2 Market for Lighting, By Driving Method
4.3 Market for Lighting,By End-User Application
4.4 Market for Lighting, By Luminaire Type
4.5 Market for Lighting, By Geography
5 Market Overview (Page No. - 33)
5.1 Introduction
5.2 Market Segmentation
5.2.1 Market for Lighting, By Driving Method
5.2.2 Market for Lighting, By End-User Application
5.2.3 Market for Lighting, By Luminaire Type
5.2.4 Market for Lighting, By Geography
5.3 Market Dynamics
5.3.1 Drivers
5.3.1.1 Growing Adoption of LED Lighting in General Lighting Applications
5.3.1.2 Increasing Demand for Energy-Efficient Lighting Systems
5.3.1.3 Convergence of Iot and Lighting
5.3.1.4 Acceptance of Standard Protocols for Lighting Control
5.3.2 Restraints
5.3.2.1 False Notion About the High Cost for the Installation of LED Driver
5.3.3 Opportunities
5.3.3.1 Development of Wireless Technologies
5.3.3.2 Development of Programmable LED Drivers
5.3.4 Challenges
5.3.4.1 Lack of Common Standards Among Various Manufacturers
6 Industry Trends (Page No. - 44)
6.1 Introduction
6.2 Value Chain Analysis
6.2.1 Research and Development
6.2.2 Component Manufacturers of LED Drivers
6.2.3 Key Distributors
6.2.4 End-User Applications
6.3 Key Industry Trends
6.4 Porter�s Five Forces
6.4.1 Bargaining Power of Suppliers
6.4.2 Bargaining Power of Buyers
6.4.3 Threat of New Entrants
6.4.4 Threat of Substitutes
6.4.5 Competitive Rivalry
7 Market for Lighting, By Driving Method (Page No. - 53)
7.1 Introduction
7.2 Constant Current LED Drivers
7.2.1 Constant Current Dimmable LED Drivers
7.2.1.1 Pulse Width Modulation (PWM) Dimming
7.2.1.2 Constant Current Reduction (CCR) Dimming
7.3 Constant Voltage LED Drivers
8 Market for Lighting, By End-User Application (Page No. - 63)
8.1 Introduction
8.2 Commercial Lighting
8.2.1 Addition of Flexible Controls for Lighting
8.3 Industrial Lighting
8.3.1 Safety in Industrial Areas for Workers
8.4 Residential Lighting
8.4.1 Increasing Standard of Living
8.5 Outdoor & Traffic Lighting
8.5.1 Different Lighting Controls for Different Types of Roads
8.6 Others
9 Market for Lighting, By Luminaire Type (Page No. - 78)
9.1 Introduction
9.2 Type A Lamps (Bulbs)
9.3 Decorative Lamps (B, Ba, C, Ca, F, and G Replacement Lamps)
9.4 T Lamps (Tubular)
9.5 Reflectors
9.6 Integral Modules
9.7 Other Lamps
10 Market for Lighting, By Component (Page No. - 87)
10.1 Introduction
10.2 Driver ICS
10.3 Discrete Components
10.4 Others
11 Market for Lighting, By Geography (Page No. - 90)
11.1 Introduction
11.2 North America
11.2.1 U.S.
11.2.1.1 Market Expected to Be Driven By New Entrants and Offerings
11.2.2 Canada
11.2.2.1 Canadians Interest in Adopting LED Lighting Systems
11.2.3 Mexico
11.2.3.1 Government Encouragement Expected to Boost the Market
11.3 Europe
11.3.1 U.K.
11.3.1.1 Presence of the Lighting Industry Association
11.3.2 Germany
11.3.2.1 Known for Manufacturing Capabilities
11.3.3 France
11.3.3.1 Eu Member Nation
11.3.4 Rest of Europe
11.3.4.1 Growing Economic Conditions
11.4 APAC
11.4.1 China
11.4.1.1 Largest Market in the Asia-Pacific Region
11.4.2 Japan
11.4.2.1 Focus on Energy Management Solutions
11.4.3 Rest of APAC
11.4.3.1 Australia and Indonesia are Emerging Markets With Significant Potential
11.5 RoW
11.5.1 Focus on Real Estate
12 Competitive Landscape (Page No. - 107)
12.1 Introduction
12.2 Market Ranking of Players, 2015
12.3 Competitive Scenario and Trends
12.3.1 New Product Launches and Expansions
12.3.2 Partnerships, Agreements, Joint Ventures, and Collaborations
12.3.3 Mergers & Acquisitions, 2013
13 Company Profiles (Page No. - 113)
(Overview, Products and Services, Financials, Strategy & Development)*
13.1 Introduction
13.2 Koninklijke Philips N.V.
13.3 Osram GmbH
13.4 Harvard Engineering
13.5 Texas Instruments, Inc.
13.6 Maxim Integrated, Inc.
13.7 Macroblock, Inc.
13.8 Atmel Corporation
13.9 General Electric
13.10 Cree, Inc.
13.11 Rohm Semiconductors
13.12 On Semiconductor
13.13 AC Electronics
*Details on Overview, Products and Services, Financials, Strategy & Development Might Not Be Captured in Case of Unlisted Companies.
14 Appendix (Page No. - 145)
14.1 Insights of Industry Experts
14.2 Discussion Guide
14.3 Knowledge Store: Marketsandmarkets� Subscription Portal
14.4 Introducing RT: Real-Time Market Intelligence
14.5 Available Customizations
14.6 Related Reports
List of Tables (75 Tables)
Table 1 Global LED Drivers Market Size for Lighting, 2013�2022
Table 2 Market, By Driving Method
Table 3 Market, By End-User Application
Table 4 Market, By Luminaire Type
Table 5 Growing Adoption of LED Lighting is Expected to Drive the Growth of the Market for Lighting
Table 6 Comparison of Costs: Conventional Lights vs LEDs
Table 7 Lack of Awareness Regarding Installation of LED Drivers is Restraining the Market Growth
Table 8 Development of Wireless Technologies Presents A Key Growth Area for Market for Lighting
Table 9 Lack of Common Standards are Proving to Be A Challenge for the Market for Lighting
Table 10 Market Size, By Driving Method, 2013�2022 (USD Million)
Table 11 Market Size, By Driving Method, 2013�2022 (Million Units)
Table 12 Market Size, By Dimming Type, 2013�2022 (USD Million)
Table 13 Market Size, By Dimming Type, 2013�2022 (Million Units)
Table 14 Constant Current LED Driver Market Size, By Dimming Type, 2013�2022 (USD Million)
Table 15 Constant Current Market Size, By Dimming Type, 2013�2022 (Million Units)
Table 16 Constant Current Market Size, By End-User Application, 2013�2022 (USD Million)
Table 17 Constant Current Market Size, By Region, 2013�2022 (USD Million)
Table 18 Constant Voltage Market Size, By Dimming Type, 2013�2022 (USD Million)
Table 19 Constant Voltage Market Size, By Dimming Type, 2013�2022 (Million Units)
Table 20 Constant Voltage Market Size, By End-User Application, 2013�2022 (USD Million)
Table 21 Constant Voltage Market Size, By Region, 2013�2022 (USD Million)
Table 22 Market Size, By End-User Application, 2013�2022 (USD Million)
Table 23 Market Size for Commercial Lighting, By Driving Method, 2013�2022 (USD Million)
Table 24 Market Size in Commercial Lighting, By Region, 2013�2022 (USD Million)
Table 25 Market Size in Commercial Lighting, By Luminaire Type, 2013�2022 (USD Million)
Table 26 Market Size in Commercial Lighting, By Luminaire Type, 2013�2022 (Million Units)
Table 27 Market Size in Industrial Lighting, By Driving Method, 2013�2022 (USD Million)
Table 28 Market Size in Industrial Lighting, By Region, 2013�2022 (USD Million)
Table 29 Market Size in Industrial Lighting, By Luminaire Type, 2013�2022 (USD Million)
Table 30 Market Size in Industrial Lighting, By Luminaire Type, 2013�2022 (Million Units)
Table 31 Market Size in Residential Lighting, By Driving Method, 2013�2022 (USD Million)
Table 32 Market Size in Residential Lighting, By Region, 2013�2022 (USD Million)
Table 33 Market Size in Residential Lighting, By Luminaire Type, 2013�2022 (USD Million)
Table 34 Market Size in Residential Lighting, By Luminaire Type, 2013�2022 (Million Units)
Table 35 Market Size in Outdoor & Traffic Lighting, By Driving Method, 2013�2022 (USD Million)
Table 36 Market Size in Outdoor & Traffic Lighting, By Region, 2013�2022 (USD Million)
Table 37 Market Size in Outdoor & Traffic Lighting, By Luminaire Type, 2013�2022 (USD Million)
Table 38 Market Size in Outdoor & Traffic Lighting, By Luminaire Type, 2013�2022 (Million Units)
Table 39 Market Size in Other End-User Applications, By Driving Method, 2013�2022 (USD Million)
Table 40 Market Size in Other End-User Applications, By Region, 2013�2022 (USD Million)
Table 41 Market Size in Other End-User Applications, By Luminaire Type, 2013�2022 (USD Million)
Table 42 Market Size in Other End-User Applications, By Luminaire Type, 2013�2022 (Million Units)
Table 43 Market Size, By Luminaire Type, 2013�2022 (USD Million)
Table 44 Market Size, By Luminaire Type, 2013�2022 (Million Units)
Table 45 Market Size for Type A Lamps, By End-User Application, 2013�2022 (USD Million)
Table 46 Market Size for Type A Lamps, By End-User Application, 2013�2022 (Million Units)
Table 47 Market Size for T Lamps, By End-User Application, 2013�2022 (USD Million)
Table 48 Market Size for T Lamps, By End-User Application, 2013�2022 (Million Units)
Table 49 Market Size for Reflectors, By End-User Application, 2013�2022 (USD Million)
Table 50 Market Size for Reflectors, By End-User Application, 2013�2022 (Million Units)
Table 51 Market Size for Integral Modules, By End-User Application, 2013�2022 (USD Million)
Table 52 Market Size for Integral Modules, By End-User Application, 2013�2022 (Million Units)
Table 53 Market Size for Other Lamps, By End-User Application, 2013�2022 (USD Million)
Table 54 Market Size for Other Lamps, By End-User Application, 2013�2022 (Million Units)
Table 55 Market Size, By Component, 2013�2022 (USD Million)
Table 56 Market Size for Driver ICS, By Component, 2013�2022
Table 57 Market Size, By Region, 2013�2022 (USD Million)
Table 58 Market Size in North America, By End-User Application, 2013�2022 (USD Million)
Table 59 Market Size in North America, By Driving Method, 2013�2022 (USD Million)
Table 60 Market Size in North America, By Country, 2013�2022 (USD Million)
Table 61 Market Size in Europe, By End-User Application, 2013�2022 (USD Million)
Table 62 Market Size in Europe, By Driving Method, 2013�2022 (USD Million)
Table 63 Market Size in Europe, By Country, 2013�2022 (USD Million)
Table 64 Market Size in APAC, By End-User Application, 2013�2022 (USD Million)
Table 65 Market Size in APAC, By Driving Method, 2013�2022 (USD Million)
Table 66 Market Size in APAC, By Country, 2013�2022 (USD Million)
Table 67 Market Size in RoW, By End-User Application, 2013�2022 (USD Million)
Table 68 Market Size in RoW, By Driving Method, 2013�2022 (USD Million)
Table 69 Market Size in RoW, By Region, 2013�2022 (USD Million)
Table 70 Market Size in RoW, By Country, 2013�2022 (USD Million)
Table 71 Ranking Based on LED Driver Module Offerings in the Market for Lighting, 2015
Table 72 Ranking Based on LED Driver ICS in the Market for Lighting, 2015
Table 73 New Product Launches and Expansions in Market, 2015�2016
Table 74 Partnerships, Agreements, Joint Ventures, Collaborations in the Market, 2015�2016
Table 75 Mergers & Acquistions in the LED Market, 2013
List of Figures (66 Figures)
Figure 1 LED Driver Market for Lighting
Figure 2 Market for Lighting: Research Design
Figure 3 Market Size Estimation Methodology: Bottom-Up Approach
Figure 4 Market Size Estimation Methodology: Top-Down Approach
Figure 5 Data Triangulation
Figure 6 Assumptions of the Research Study
Figure 7 Global LED Drivers Market Size for Lighting in Terms of Value, 2013�2022
Figure 8 Residential Lighting End-User Application Expected to Grow at the Highest Rate By 2022
Figure 9 Market for Constant Current LED Drivers Expected to Show Faster Growth Compared to Market for Constant Voltage LED Drivers
Figure 10 LED Drivers Market for LED Modules Expected to Dominant During the Forecast Period
Figure 11 Global Market for Lighting, By Geography, 2015
Figure 12 Global LED Drivers Market for Lighting Presents Lucrative Opportunities
Figure 13 Constant Current LED Drivers are Expected to Dominate the LED Drivers Market Based on Driving Method During the Forecast Period
Figure 14 Market for the Residential Lighting End-User Application Would Grow at the Highest Rate During the Forecast Period
Figure 15 LED Modules Expected to Dominate the LED Drivers Market Based on Luminaire Type By 2022
Figure 16 APAC Market Expected to Grow at the Highest Growth Rate During the Forecast Period
Figure 17 Market for Lighting, By Geography
Figure 18 Market Dynamics: Overview
Figure 19 Global LED Market Size, 2014 vs 2018 (In USD Billion)
Figure 20 Annual Energy Consumption in U.S. for Commercial Buildings, 2011
Figure 21 Market for Lighting: Value Chain Analysis
Figure 22 Vertical Integration � the Leading Trend Among Key Market Players
Figure 23 Porter�s Five Forces Analysis for the Market for Lighting
Figure 24 Porter�s Five Forces: Impact Analysis
Figure 25 Bargaining Power of Suppliers in the Market for Lighting, 2015
Figure 26 Bargaining Power of Buyers in the Market for Lighting, 2015
Figure 27 Threat of New Entrants in the Market for Lighting, 2015
Figure 28 Threat of Substitutes in the Market for Lighting, 2015
Figure 29 Competitive Rivalry in the Market for Lighting, 2015
Figure 30 Market for Lighting, By Driving Method
Figure 31 Market for Lighting, By Dimming Type (Million Units)
Figure 32 Constant Current LED Driver Market, By Region (USD Million) 2016 to 2022
Figure 33 Constant Voltage Market for Lighting, By End-User Application (USD Million)
Figure 34 Market for Lighting, By End-User Application
Figure 35 Market for Commercial Lighting, By Driving Method (USD Million) 2016 to 2022
Figure 36 Industrial Market, By Region, 2016�2022 (USD Million)
Figure 37 Residential Market, By Luminaire Type, 2016�2022 (USD Million)
Figure 38 Market in Outdoor & Traffic Lighting, By Luminaire Type, 2016�2022 (Million Units)
Figure 39 Market for Lighting, By Luminaire Type
Figure 40 Market for Type A Lamps, By End-User Application, 2016�2022 (USD Million)
Figure 41 Market for Integral Modules, By End-User Application, 2016�2022 (Million Units)
Figure 42 Market for Lighting, By Component
Figure 43 Geographic Snapshot: LED Driver Market for Lighting in Mexico Expected to Grow at the Highest Rate Between 2016 and 2022
Figure 44 North America: Market for Lighting Snapshot
Figure 45 Europe: Market for Lighting Snapshot
Figure 46 APAC: LED Driver for Lighting Market Snapshot
Figure 47 Companies Adopted Product Innovation as the Key Growth Strategy
Figure 48 Market Evaluation Framework: New Product Launches Fuelled the Growth and Innovation Between 2013 and 2015
Figure 49 Battle for Market Share: New Product Launches & Expansions Were the Key Strategies Adopted Between 2013 and 2015
Figure 50 Geographic Revenue Mix of Major Players in the Market, 2015
Figure 51 Koninklijke Philips N.V.: Company Snapshot
Figure 52 Koninklijke Philips N.V.: SWOT Analysis
Figure 53 Osram GmbH: Company Snapshot
Figure 54 Osram GmbH: SWOT Analysis
Figure 55 Harvard Engineering: SWOT Analysis
Figure 56 Texas Instruments, Inc.: Company Snapshot
Figure 57 Texas Instruments, Inc.: SWOT Analysis
Figure 58 Maxim Integrated, Inc.: Company Snapshot
Figure 59 Maxim Integrated, Inc.: SWOT Analysis
Figure 60 Macroblock, Inc.: Company Snapshot
Figure 61 Atmel Corporation: Company Snapshot
Figure 62 General Electric: Company Snapshot
Figure 63 General Electric: SWOT Analysis
Figure 64 Cree, Inc. Company Snapshot
Figure 65 Rohm Semiconductors: Company Snapshot
Figure 66 On Semiconductor: Company Snapshot


Growth opportunities and latent adjacency in LED Driver Market
We are interested in upcoming technologies and trends in the LED driver ecosystem. Does this report include this information?
We are interested in an updated market report for LED driver ICs for used in LED displays (video wall) applications including rental, digital signage, etc. Can you provide such information?