Laboratory Information System (LIS) Market

Laboratory Information System (LIS) Market by Product (Standalone, Integrated), Component (Services, Software), Delivery Mode (On-premise & Cloud-based), End User (Hospital Laboratories, Independent Laboratories, POLs) and Region - Global Forecast to 2028

Report Code: HIT 2808 Jul, 2023, by marketsandmarkets.com

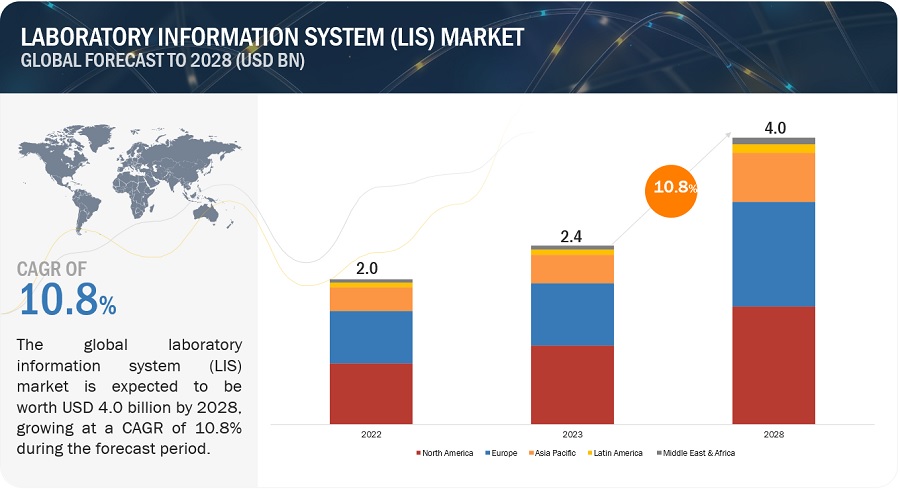
The global laboratory information system market in terms of revenue was estimated to be worth $2.4 billion in 2023 and is poised to reach $4.0 billion by 2028, growing at a CAGR of 10.8% from 2023 to 2028. The new research study consists of an industry trend analysis of the market. The new research study consists of industry trends, pricing analysis, patent analysis, conference and webinar materials, key stakeholders, and buying behaviour in the market. The expansion of molecular diagnostic techniques, including genomics and personalized medicine, and the need for automation and robotics in laboratories primarily drive the market growth. LIS helps in automating various laboratory processes, such as sample tracking, result management, and data analysis, leading to improved productivity and accuracy. Additionally, the growing need for integrated healthcare systems and the rising adoption of electronic health records (EHRs) are also driving the demand for LIS. Advancements in laboratory practices, including point-of-care testing, remote monitoring, and telemedicine, necessitate adaptable LIS solutions that can support these emerging trends and ensure secure and timely data transmission.

Attractive Opportunities in the Laboratory Information System (LIS) Market
Laboratory Information System Market

To know about the assumptions considered for the study, Request for Free Sample Report
Laboratory Information System Market

Laboratory Information System Market Dynamics

Driver: Development of integrated LIS

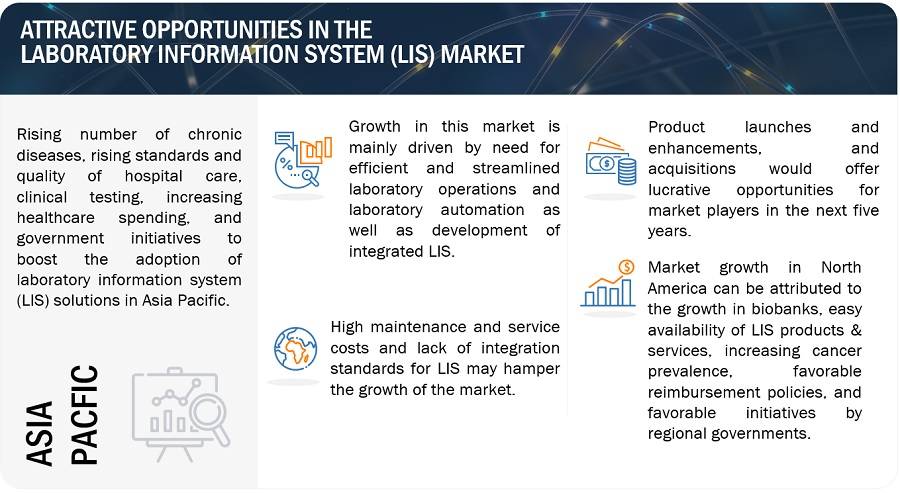
The demand for advanced data management solutions is on the rise with the ever-changing requirements of laboratories. As standalone LIS does not meet all laboratory requirements, modern and agile information systems are increasingly being adopted to run laboratories efficiently. This is particularly evident in the increasing integration of LIS with EHR. LIS within EHR is beneficial in financial and operational capabilities, expected to increase its adoption among healthcare providers. Integrated LIS solutions help ease lab workflow, provide standardized and quality diagnosis, enable simplified solution deployment, and help in reducing the cost associated with installing new and independent LIS systems. Moreover, integrated systems reduce the separate maintenance and service cost incurred on LIS systems.

Integrated solutions greatly assist in compliance with regulatory requirements in the life sciences industry. These solutions provide laboratory and enterprise information at a single point of access and eliminate the gaps in communication between enterprises and stakeholders. Other benefits include better laboratory workflows, reduction of the maintenance cost, easy retrieval of laboratory data, accelerated validation process, quality assurance of products, and regulatory compliance.

Restraint: Lack of integration standards for LIS

Although laboratory information systems have been around for several years, there still are numerous issues related to their integration and implementation. Various attempts are being made by associations such as SiLA (Standardization in Lab Automation) and the IQ Consortium (International Consortium for Innovation and Quality in Pharmaceutical Development) to introduce new interfaces and data management standards to facilitate the integration of these systems. However, as of now, the lack of integration standards is a major concern in the laboratory arena, and there is very little evidence of a universal solution emerging. This acts as a major barrier to the greater adoption of LIS among prospective end users. Currently, with no unified strategy, laboratories are largely continuing to follow conventional procedures, regardless of their efficiency.

Opportunity: Rising demand for personalized medicine

Personalized medicine involves using the uniqueness of each patient’s pathology and physiology to tailor treatment and prevention procedures for gaining optimal results. The need for personalized medicine is on the rise owing to the growth in the aging population and the increasing incidence of chronic diseases such as cancer. For these disease conditions, personalized medicine offers opportunities to provide targeted therapies to destroy tumor cells with less impact on other healthy cells. In personalized medicine, pathology data is required to prescribe the best possible therapy. LIS solutions can be beneficial in this regard as these solutions offer advanced functions, such as digital pathology and companion algorithms, for specimen slide diagnosis to help detect cancer cells and thus enable early diagnosis.

Personalized medicine is gaining importance across the globe and has attracted significant support. The Marcus Program in Precision Medicine Innovation (MPPMI) aims to foster innovation in precision medicine by fostering creative, high-risk, high-impact team science projects supporting the precision medicine continuum. Thus, the growth in demand and rising support for personalized medicine are expected to offer significant growth opportunities to players operating in the LIS market.

Challenge: Requirement of specialized LIS solutions

Most medium and large clinical diagnostic laboratories comprise specialized laboratory units for chemistry, microbiology, and hematology. These laboratories have unique workflow needs and hence require unique LIS solutions to meet these requirements. Furthermore, some laboratories require customizable non-clinical functionalities such as client connectivity and billing. Coming up with solutions that cater to the unique requirements of these specialized laboratory units is a major challenge for LIS vendors.

Laboratory Information System (LIS) Market Ecosystem

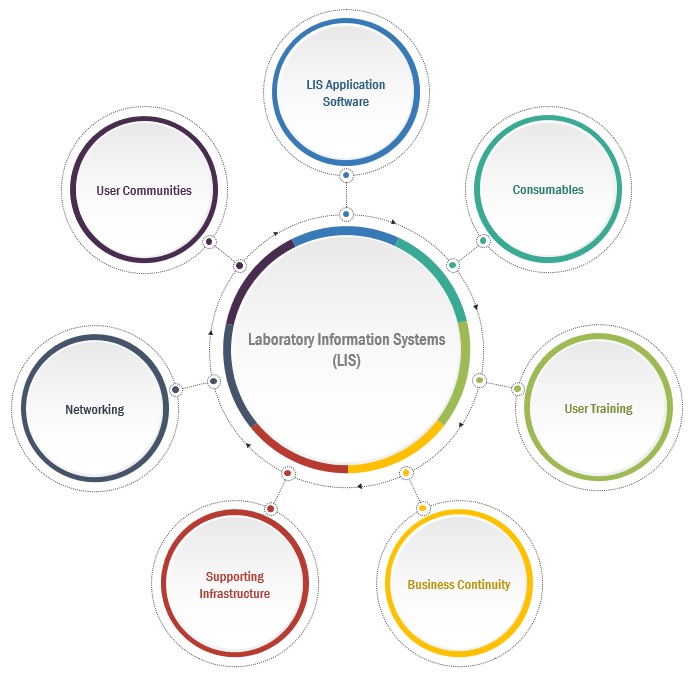
The ecosystem of the LIS market comprises data center providers, cloud professional service vendors, software developers, medical institutions, healthcare providers, blood banks, nursing homes, and independent laboratories. Laboratory information system vendors offer different modules and provide access to trained professionals and industry experts at a lower cost. These vendors have large-scale technical teams to develop and support the needs of their customers. These vendors leverage advanced technologies to deliver greater efficiency and offer services to end users to maximize laboratory efficiency and productivity. Product launches and enhancements, and acquisitions are the major strategies these vendors use to provide end-to-end solutions in the laboratory information system (LIS) market.
Laboratory Information System Market Ecosystem

Based on the component, the software segment of laboratory information system industry is expected to register the highest CAGR during the forecast period.

The software segment of laboratory information system market is anticipated to register the highest CAGR during the forecast period. This is primarily owing to the increasing demand for user-friendly, comprehensive, and integrated LIS software. A typical LIS software performs operations such as registration of test requests; production of specimen collection sheets and identification labels; confirmation of specimen collection; production of aliquot labels; workload inquiry; production of worksheets; manual as well as automated entry of test results; results inquiry; and generation of preliminary reports, final reports, statistical reports, and daily activities reports, and billing.

Based on delivery mode, the on-premise segment is anticipated to dominate the laboratory information system industry in 2023.

Based on deployment, the laboratory information system market is segmented into on-premise LIS and cloud-based LIS. The on-premises segment is expected to dominate the laboratory information system (LIS) market from 2023 to 2028 due to security concerns among users and higher control over the system. On-premise models offer multivendor architecture, which lowers the risk of data breaches and external attacks. Buyers mainly opt for these delivery models due to the security benefits associated with them. The on-premises segment is expected to dominate the healthcare data monetization market from 2023 to 2028 due to security concerns among users and higher control over the system. On-premise LIS solutions offer benefits such as increased control and security over sensitive data, compliance with regulatory requirements, faster data processing, and the ability to customize and tailor the solution to specific laboratory needs,

Hospital laboratories are expected to acquire the largest size of laboratory information system industry market by end-user.

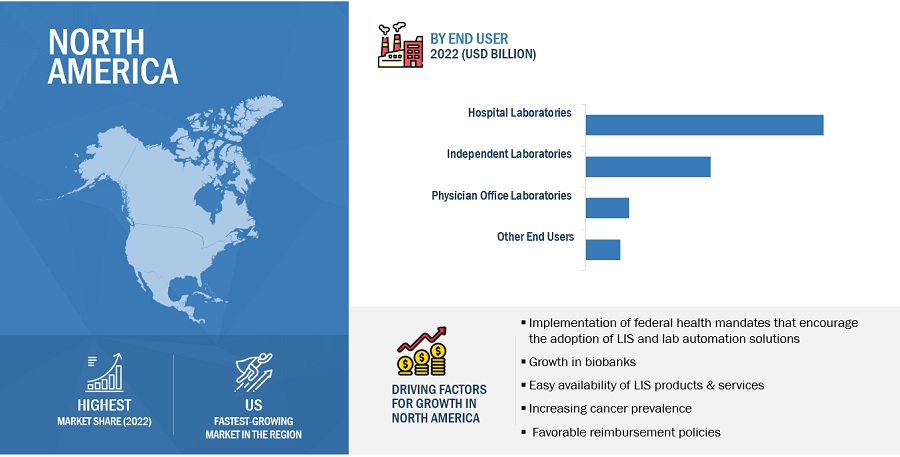
Based on the end user, the laboratory information system market is broadly segmented into hospital laboratories, independent laboratories, physician office laboratories (POLs), and other end users (blood banks, retail clinics, public health labs, and nursing homes). The hospital laboratories segment is expected to dominate the market during the forecast period. The use of LIS in hospitals and hospital laboratories can significantly reduce waiting times for patients and improve the quality of diagnostics. Moreover, LIS can facilitate long-distance discussions with experts and make digital slide images of specimens (such as blood smears or frozen sections) available online. Owing to these benefits, hospitals across the world are increasingly adopting LIS.
Laboratory Information System Market by Region

To know about the assumptions considered for the study, download the pdf brochure

North America is expected to account for the largest share in the laboratory information system industry in 2023

The global laboratory information system market has been segmented based on region: North America, Europe, Asia Pacific, Latin America, and the Middle East & Africa. In 2023, North America is expected to account for the largest market share, followed by Europe. The large share of North America in the global laboratory information system (LIS) market can be attributed to the growth in biobanks, easy availability of LIS products & services, increasing cancer prevalence, favorable reimbursement policies, and favorable initiatives by regional governments. Moreover, most of the leading players in the laboratory information system (LIS) market have their headquarters in North America.

The laboratory information system market is dominated by a few globally established players such as Orchard Software Corporation (US), Clinisys (US), Oracle Corporation (US), Computer Programs and Systems, Inc. (US), and CompuGroup Medical  (Germany) among others.

Scope of the Laboratory Information System Industry

Report Metric 

Details 

Market Revenue in 2023

$2.4 billion

Projected Revenue by 2028

$4.0 billion

Revenue Rate

Poised to Grow at a CAGR of 10.8%

Market Driver

Development of integrated LIS

Market Opportunity

Rising demand for personalized medicine

This research report categorizes the global laboratory information system market to forecast revenue and analyze trends in each of the following submarkets:

By Product

  • Standalone LIS
  • Integrated LIS

By Component

  • Software
  • Services

By Delivery Mode

  • On-premise LIS
  • Cloud-based LIS

By End User

  • Hospital Laboratories
  • Independent Laboratories
  • Physician Office Laboratories
  • Other End Users

By Region

  • North America
    • US
    • Canada
  • Europe
    • Germany
    • UK
    • France
    • Italy
    • Spain
    • Rest of Europe
  • Asia Pacific
    • Japan
    • China
    • India
    • Australia & New Zealand
    • Rest of Asia Pacific
  • Latin America
  • Middle East & Africa

Recent Developments of Laboratory Information System Industry

  • In May 2023, Clinisys acquired Promium, a provider of laboratory information management systems for environmental and analytical testing laboratories. This acquisition strengthens Clinisys' position in public health and toxicology diagnostics and supports its global expansion.
  • In January 2023, Orchard Software Corporation announced the release of its new Enterprise Toxicology solution, which aimed to enhance patient care in toxicology laboratories by providing information system tools. The solution offers features such as an integrated workflow engine, plate mapping tools for patient safety, medication consistency interpretation, and customizable report formats.
  • In November 2022, Oracle Cerner and LabCorp formed a new collaboration to streamline lab operations for a leading nonprofit Catholic health system. Labcorp would manage hospital-based laboratories in 10 states using Cerner's laboratory information system (LIS), aiming to enhance patient care and improve lab efficiency.
  • In November 2022, CompuGroup Medical (CGM) announced two add-on acquisitions in the areas of data solutions and US laboratory information systems. The acquisition of Medicus LIS strengthens CGM's position as a software leader in the independent US laboratory segment, while the acquisition of GHG business operations complements CGM's portfolio of data-based solutions for the healthcare sector.
  • In August 2022, Sparta Community Hospital, a critical access hospital in Sparta, Illinois, provided healthcare services to previously underserved areas through their Mobile Health Clinic. The hospital partnered with the Grand American World Trapshooting Championships to offer healthcare services. They leveraged the Evident EHR solution offered by Computer Programs and Systems, Inc. to provide primary care during the event. Sparta Community Hospital runs the full Evident EHR in its inpatient and clinic care settings.

Frequently Asked Questions (FAQ):

To speak to our analyst for a discussion on the above findings, click Speak to Analyst

TABLE OF CONTENTS
 
1 INTRODUCTION (Page No. - 29)
    1.1 STUDY OBJECTIVES 
    1.2 MARKET DEFINITION 
    1.3 INCLUSIONS & EXCLUSIONS 
    1.4 MARKET SCOPE 
           1.4.1 MARKET SEGMENTATION
                    FIGURE 1 LABORATORY INFORMATION SYSTEM MARKET: MARKET SEGMENTATION
           1.4.2 REGIONAL SCOPE
    1.5 YEARS CONSIDERED 
    1.6 CURRENCY 
          TABLE 1 EXCHANGE RATES UTILIZED FOR CONVERSION TO USD
    1.7 LIMITATIONS 
    1.8 STAKEHOLDERS 
    1.9 SUMMARY OF CHANGES 
           1.9.1 RECESSION IMPACT
 
2 RESEARCH METHODOLOGY (Page No. - 36)
    2.1 RESEARCH DATA 
          FIGURE 2 RESEARCH DESIGN
          FIGURE 3 RESEARCH APPROACH
           2.1.1 SECONDARY RESEARCH
                    2.1.1.1 Key data from secondary sources
           2.1.2 PRIMARY RESEARCH
                    2.1.2.1 Key primary sources
                    2.1.2.2 Key data from primary sources
                    2.1.2.3 Key industry insights
                    2.1.2.4 Breakdown of primary interviews
                                FIGURE 4 BREAKDOWN OF PRIMARY INTERVIEWS: SUPPLY-SIDE AND  DEMAND-SIDE PARTICIPANTS
                                FIGURE 5 BREAKDOWN OF PRIMARY INTERVIEWS: BY COMPANY TYPE, DESIGNATION,  AND REGION
    2.2 MARKET SIZE ESTIMATION 
          FIGURE 6 APPROACH FOR ASSESSING SUPPLY OF LABORATORY INFORMATION SYSTEMS SOLUTIONS
          FIGURE 7 REVENUES GENERATED BY COMPANIES FROM SALES OF LABORATORY INFORMATION SYSTEMS SOLUTIONS
          FIGURE 8 REVENUE SHARE ANALYSIS ILLUSTRATION
          FIGURE 9 BOTTOM-UP APPROACH
          FIGURE 10 TOP-DOWN APPROACH
          TABLE 2 FACTOR ANALYSIS
    2.3 MARKET BREAKDOWN AND DATA TRIANGULATION 
          FIGURE 11 DATA TRIANGULATION METHODOLOGY
    2.4 RESEARCH ASSUMPTIONS 
          TABLE 3 ASSUMPTIONS FOR RESEARCH STUDY
    2.5 IMPACT OF RECESSION 
    2.6 RISK ASSESSMENT 
          TABLE 4 LIMITATIONS AND ASSOCIATED RISKS
    2.7 RESEARCH LIMITATIONS 

3 EXECUTIVE SUMMARY (Page No. - 55)
    FIGURE 12 LABORATORY INFORMATION SYSTEM MARKET, BY PRODUCT, 2023 VS. 2028 (USD MILLION)
    FIGURE 13 LABORATORY INFORMATION SYSTEM INDUSTRY, BY COMPONENT,  2023 VS. 2028 (USD MILLION)
    FIGURE 14 LABORATORY INFORMATION SYSTEMS MARKET, BY DELIVERY MODE,  2023 VS. 2028 (USD MILLION)
    FIGURE 15 MARKET, BY END USER,  2023 VS. 2028 (USD MILLION)
    FIGURE 16 MARKET: REGIONAL SNAPSHOT
 
4 PREMIUM INSIGHTS (Page No. - 59)
    4.1 LABORATORY INFORMATION SYSTEM MARKET OVERVIEW 
          FIGURE 17 DEVELOPMENT OF INTEGRATED LIS TO DRIVE MARKET GROWTH
    4.2 LABORATORY INFORMATION SYSTEMS INDUSTRY, BY REGION 
          FIGURE 18 NORTH AMERICA TO DOMINATE MARKET DURING FORECAST PERIOD
    4.3 MARKET: GEOGRAPHIC GROWTH OPPORTUNITIES 
          FIGURE 19 INDIA TO REGISTER HIGHEST REVENUE GROWTH FROM 2023 TO 2028
    4.4 NORTH AMERICAN MARKET, BY END USER AND COUNTRY, 2022 
          FIGURE 20 HOSPITAL LABORATORIES AND US DOMINATED MARKET IN  NORTH AMERICA IN 2022
    4.5 LABORATORY INFORMATION SYSTEMS MARKET, BY PRODUCT 
          FIGURE 21 STANDALONE LIS SEGMENT HELD LARGER MARKET SHARE IN 2022
    4.6 MARKET, BY COMPONENT 
          FIGURE 22 SERVICES SEGMENT TO DOMINATE MARKET IN 2028
    4.7 MARKET,  BY DELIVERY MODE 
          FIGURE 23 CLOUD-BASED LIS TO REGISTER HIGHER GROWTH RATE  DURING FORECAST PERIOD
    4.8 MARKET, BY END USER 
          FIGURE 24 HOSPITAL LABORATORIES TO ACCOUNT FOR LARGEST MARKET SHARE IN 2028
 
5 MARKET OVERVIEW (Page No. - 64)
    5.1 INTRODUCTION 
    5.2 MARKET DYNAMICS 
          FIGURE 25 LABORATORY INFORMATION SYSTEM MARKET: DRIVERS, RESTRAINTS, OPPORTUNITIES, AND CHALLENGES
           5.2.1 DRIVERS
                    5.2.1.1 Need for laboratory automation
                    5.2.1.2 Development of integrated LIS
                    5.2.1.3 Rising prevalence of chronic diseases
                    5.2.1.4 Growing demand for LIS in biobanks/biorepositories
                    5.2.1.5 Need to comply with regulatory requirements
                    5.2.1.6 Increasing adoption of LIS to enhance lab efficiency
           5.2.2 RESTRAINTS
                    5.2.2.1 High maintenance and service costs
                    5.2.2.2 Lack of integration standards for LIS
           5.2.3 OPPORTUNITIES
                    5.2.3.1 Growing popularity of cloud-based LIS
                    5.2.3.2 Growth potential of emerging countries
                    5.2.3.3 Rising demand for personalized medicine
           5.2.4 CHALLENGES
                    5.2.4.1 Interfacing with diverse laboratory instruments
                    5.2.4.2 Requirement of specialized LIS solutions
                    5.2.4.3 Data storage challenges
                    5.2.4.4 Dearth of trained laboratory professionals
 
6 INDUSTRY INSIGHTS (Page No. - 72)
    6.1 INTRODUCTION 
    6.2 OVERVIEW OF KEY INDUSTRY TRENDS 
           6.2.1 SHIFT TO VALUE-BASED AND PATIENT-CENTRIC CARE
           6.2.2 MOBILE APPLICATIONS AND POINT-OF-CARE TESTING
           6.2.3 ADVANCED ANALYTICS AND ARTIFICIAL INTELLIGENCE (AI)
                    TABLE 5 VENDORS OFFERING ABILITY TO USE ARTIFICIAL INTELLIGENCE WITH LIS
    6.3 PORTER’S FIVE FORCES ANALYSIS 
          TABLE 6 LABORATORY INFORMATION SYSTEMS INDUSTRY: PORTER’S FIVE FORCES ANALYSIS
          FIGURE 26 MARKET:  PORTER’S FIVE FORCES ANALYSIS
    6.4 PRICING ANALYSIS 
          TABLE 7 MARKET: AVERAGE PRICING
          TABLE 8 LABORATORY INFORMATION SYSTEMS MARKET: PRICING ANALYSIS,  BY COMPANY TIER
    6.5 TECHNOLOGY ANALYSIS 
           6.5.1 MACHINE LEARNING
           6.5.2 ARTIFICIAL INTELLIGENCE
           6.5.3 INTERNET OF THINGS
           6.5.4 BLOCKCHAIN
           6.5.5 CLOUD COMPUTING
    6.6 REGULATORY ANALYSIS 
           6.6.1 NORTH AMERICA
           6.6.2 EUROPE
           6.6.3 ASIA PACIFIC
           6.6.4 MIDDLE EAST & AFRICA
           6.6.5 LATIN AMERICA
    6.7 ECOSYSTEM ANALYSIS 
          FIGURE 27 MARKET: ECOSYSTEM
             TABLE 9 ROLE OF MARKET PLAYERS IN LABORATORY INFORMATION SYSTEMS ECOSYSTEM
    6.8 VALUE CHAIN ANALYSIS 
          FIGURE 28 MARKET: VALUE CHAIN
    6.9 CASE STUDY ANALYSIS 
           6.9.1 CASE STUDY 1
           6.9.2 CASE STUDY 2
           6.9.3 CASE STUDY 3
    6.10 PATENT ANALYSIS 
           FIGURE 29 TOP PATENT OWNERS AND APPLICANTS FOR HEALTHCARE IT SOLUTIONS (JANUARY 2011–JUNE 2023)
           FIGURE 30 MARKET: PATENT ANALYSIS (JANUARY 2011–JUNE 2023)
    6.11 KEY CONFERENCES & EVENTS (Q1 2023–Q2 2024) 
    6.12 TRENDS/DISRUPTIONS IMPACTING CUSTOMERS’ BUSINESSES 
           FIGURE 31 REVENUE SHIFT IN MARKET
    6.13 KEY STAKEHOLDERS & BUYING CRITERIA 
           6.13.1 KEY STAKEHOLDERS IN BUYING PROCESS
                     FIGURE 32 INFLUENCE OF STAKEHOLDERS ON BUYING PROCESS
                     TABLE 10 INFLUENCE OF STAKEHOLDERS ON BUYING PROCESS (%)
           6.13.2 BUYING CRITERIA
                     FIGURE 33 KEY BUYING CRITERIA, BY END USER
                     TABLE 11 KEY BUYING CRITERIA, BY END USER (%)
 
7 LABORATORY INFORMATION SYSTEM MARKET, BY PRODUCT (Page No. - 92)
    7.1 INTRODUCTION 
             TABLE 12 LABORATORY INFORMATION SYSTEM INDUSTRY, BY PRODUCT,  2021–2028 (USD MILLION)
    7.2 STANDALONE LIS 
           7.2.1 ENHANCED DATA SECURITY AND USER-FRIENDLY NATURE OF STANDALONE LIS TO SUPPORT ADOPTION
                    TABLE 13 STANDALONE LABORATORY INFORMATION SYSTEMS MARKET, BY REGION,  2021–2028 (USD MILLION)
                    TABLE 14 NORTH AMERICA: MARKET,  BY COUNTRY, 2021–2028 (USD MILLION)
                    TABLE 15 EUROPE: MARKET, BY COUNTRY, 2021–2028 (USD MILLION)
                    TABLE 16 ASIA PACIFIC: MARKET,  BY COUNTRY, 2021–2028 (USD MILLION)
    7.3 INTEGRATED LIS 
           7.3.1 INCREASING END-USER PREFERENCE FOR SINGLE SOLUTIONS WITH MULTIPLE MODULES TO BOOST DEMAND
                    TABLE 17 INTEGRATED LABORATORY INFORMATION SYSTEMS MARKET, BY REGION,  2021–2028 (USD MILLION)
                    TABLE 18 NORTH AMERICA: MARKET,  BY COUNTRY, 2021–2028 (USD MILLION)
                    TABLE 19 EUROPE: MARKET, BY COUNTRY, 2021–2028 (USD MILLION)
                    TABLE 20 ASIA PACIFIC: SYSTEMS MARKET,  BY COUNTRY, 2021–2028 (USD MILLION)
 
8 LABORATORY INFORMATION SYSTEM MARKET, BY COMPONENT (Page No. - 98)
    8.1 INTRODUCTION 
          TABLE 21 LABORATORY INFORMATION SYSTEM INDUSTRY, BY COMPONENT,  2021–2028 (USD MILLION)
    8.2 SERVICES 
           8.2.1 HEAVY DEPENDENCY OF END USERS ON SERVICE PROVIDERS TO DRIVE GROWTH
                    TABLE 22 LABORATORY INFORMATION SYSTEM SERVICES MARKET, BY REGION,  2021–2028 (USD MILLION)
                    TABLE 23 NORTH AMERICA: LABORATORY INFORMATION SYSTEM SERVICES MARKET,  BY COUNTRY, 2021–2028 (USD MILLION)
                    TABLE 24 EUROPE: LABORATORY INFORMATION SYSTEM SERVICES MARKET, BY COUNTRY,  2021–2028 (USD MILLION)
                    TABLE 25 ASIA PACIFIC: LABORATORY INFORMATION SYSTEM SERVICES MARKET,  BY COUNTRY, 2021–2028 (USD MILLION)
    8.3 SOFTWARE 
           8.3.1 SOFTWARE SEGMENT TO WITNESS HIGHER GROWTH DURING  FORECAST PERIOD
                    TABLE 26 LABORATORY INFORMATION SYSTEM SOFTWARE MARKET, BY REGION,  2021–2028 (USD MILLION)
                    TABLE 27 NORTH AMERICA: LABORATORY INFORMATION SYSTEM SOFTWARE MARKET,  BY COUNTRY, 2021–2028 (USD MILLION)
                    TABLE 28 EUROPE: LABORATORY INFORMATION SYSTEM SOFTWARE MARKET, BY COUNTRY,  2021–2028 (USD MILLION)
                    TABLE 29 ASIA PACIFIC: LABORATORY INFORMATION SYSTEM SOFTWARE MARKET,  BY COUNTRY, 2021–2028 (USD MILLION)
 
9 LABORATORY INFORMATION SYSTEM MARKET,  BY DELIVERY MODE (Page No. - 104)
    9.1 INTRODUCTION 
          TABLE 30 LABORATORY INFORMATION SYSTEMS INDUSTRY, BY DELIVERY MODE,  2021–2028 (USD MILLION)
    9.2 ON-PREMISE LIS 
           9.2.1 ABILITY TO USE CUSTOMIZED SOLUTIONS TO DRIVE DEMAND FOR ON-PREMISE DELIVERY
                    TABLE 31 ON-PREMISE LABORATORY INFORMATION SYSTEMS MARKET, BY REGION,  2021–2028 (USD MILLION)
                    TABLE 32 NORTH AMERICA: MARKET,  BY COUNTRY, 2021–2028 (USD MILLION)
                    TABLE 33 EUROPE: MARKET, BY COUNTRY, 2021–2028 (USD MILLION)
                    TABLE 34 ASIA PACIFIC: MARKET,  BY COUNTRY, 2021–2028 (USD MILLION)
    9.3 CLOUD-BASED LIS 
           9.3.1 CLOUD-BASED LIS SEGMENT TO REGISTER HIGHER GROWTH DURING FORECAST PERIOD
                    TABLE 35 CLOUD-BASED LABORATORY INFORMATION SYSTEMS MARKET, BY COUNTRY,  2021–2028 (USD MILLION)
                    TABLE 36 NORTH AMERICA: MARKET,  BY COUNTRY, 2021–2028 (USD MILLION)
                    TABLE 37 EUROPE: MARKET, BY COUNTRY, 2021–2028 (USD MILLION)
                    TABLE 38 ASIA PACIFIC: MARKET,  BY COUNTRY, 2021–2028 (USD MILLION)
 
10 LABORATORY INFORMATION SYSTEM MARKET, BY END USER (Page No. - 110)
     10.1 INTRODUCTION 
             TABLE 39 LABORATORY INFORMATION SYSTEM INDUSTRY, BY END USER,  2021–2028 (USD MILLION)
     10.2 HOSPITAL LABORATORIES 
             10.2.1 AFFORDABILITY AND AVAILABILITY OF INTEGRATED LIS SOLUTIONS TO DRIVE DEMAND
                        TABLE 40 LABORATORY INFORMATION SYSTEMS MARKET FOR HOSPITAL LABORATORIES,  BY REGION, 2021–2028 (USD MILLION)
                        TABLE 41 NORTH AMERICA: MARKET FOR HOSPITAL LABORATORIES, BY COUNTRY, 2021–2028 (USD MILLION)
                        TABLE 42 EUROPE: MARKET FOR HOSPITAL LABORATORIES, BY COUNTRY, 2021–2028 (USD MILLION)
                        TABLE 43 ASIA PACIFIC: MARKET FOR HOSPITAL LABORATORIES, BY COUNTRY, 2021–2028 (USD MILLION)
     10.3 INDEPENDENT LABORATORIES 
             10.3.1 GROWING NEED TO MANAGE WORKFLOWS AND ENHANCE BILLING PROCESSES TO DRIVE ADOPTION
                        TABLE 44 MARKET FOR INDEPENDENT LABORATORIES,  BY REGION, 2021–2028 (USD MILLION)
                        TABLE 45 NORTH AMERICA: MARKET FOR INDEPENDENT LABORATORIES, BY COUNTRY, 2021–2028 (USD MILLION)
                        TABLE 46 EUROPE: MARKET FOR INDEPENDENT LABORATORIES, BY COUNTRY, 2021–2028 (USD MILLION)
                        TABLE 47 ASIA PACIFIC: MARKET FOR INDEPENDENT LABORATORIES, BY COUNTRY, 2021–2028 (USD MILLION)
     10.4 PHYSICIAN OFFICE LABORATORIES 
             10.4.1 ABILITY TO ASSIST PHYSICIANS IN LABORATORY AND CLINICAL FUNCTIONS TO BOOST MARKET
                        TABLE 48 MARKET FOR PHYSICIAN OFFICE LABORATORIES, BY REGION, 2021–2028 (USD MILLION)
                        TABLE 49 NORTH AMERICA: MARKET FOR PHYSICIAN OFFICE LABORATORIES, BY COUNTRY, 2021–2028 (USD MILLION)
                        TABLE 50 EUROPE: MARKET FOR PHYSICIAN OFFICE LABORATORIES, BY COUNTRY, 2021–2028 (USD MILLION)
                        TABLE 51 ASIA PACIFIC: MARKET FOR PHYSICIAN OFFICE LABORATORIES, BY COUNTRY, 2021–2028 (USD MILLION)
     10.5 OTHER END USERS 
             TABLE 52 MARKET FOR OTHER END USERS,  BY REGION, 2021–2028 (USD MILLION)
             TABLE 53 NORTH AMERICA: MARKET FOR OTHER END USERS, BY COUNTRY, 2021–2028 (USD MILLION)
             TABLE 54 EUROPE: MARKET FOR OTHER END USERS,  BY COUNTRY, 2021–2028 (USD MILLION)
             TABLE 55 ASIA PACIFIC: MARKET FOR OTHER END USERS, BY COUNTRY, 2021–2028 (USD MILLION)
 
11 LABORATORY INFORMATION SYSTEM MARKET, BY REGION (Page No. - 120)
     11.1 INTRODUCTION 
             FIGURE 34 INDIA TO EMERGE AS NEW HOTSPOT DURING FORECAST PERIOD
             FIGURE 35 NORTH AMERICA HELD LARGEST SHARE OF LABORATORY INFORMATION SYSTEMS INDUSTRY IN 2022
             TABLE 56 MARKET, BY REGION, 2021–2028 (USD MILLION)
     11.2 NORTH AMERICA 
             11.2.1 NORTH AMERICA: RECESSION IMPACT
                        FIGURE 36 NORTH AMERICA: LABORATORY INFORMATION SYSTEM MARKET SNAPSHOT
                        TABLE 57 NORTH AMERICA: LABORATORY INFORMATION SYSTEMS MARKET, BY COUNTRY,  2021–2028 (USD MILLION)
                        TABLE 58 NORTH AMERICA: MARKET, BY PRODUCT,  2021–2028 (USD MILLION)
                        TABLE 59 NORTH AMERICA: MARKET, BY COMPONENT, 2021–2028 (USD MILLION)
                        TABLE 60 NORTH AMERICA: MARKET, BY DELIVERY MODE, 2021–2028 (USD MILLION)
                        TABLE 61 NORTH AMERICA: MARKET, BY END USER,  2021–2028 (USD MILLION)
             11.2.2 US
                        11.2.2.1 Favorable regulatory and reimbursement scenario to drive use of LIS
                                      TABLE 62 US: LABORATORY INFORMATION SYSTEM INDUSTRY, BY PRODUCT,  2021–2028 (USD MILLION)
                                      TABLE 63 US: LABORATORY INFORMATION SYSTEMS MARKET, BY COMPONENT,  2021–2028 (USD MILLION)
                                      TABLE 64 US: MARKET, BY DELIVERY MODE,  2021–2028 (USD MILLION)
                                      TABLE 65 US: MARKET, BY END USER,  2021–2028 (USD MILLION)
             11.2.3 CANADA
                        11.2.3.1 Rising awareness of lab automation to drive market  growth
                                      TABLE 66 CANADA: LABORATORY INFORMATION SYSTEM MARKET, BY PRODUCT,  2021–2028 (USD MILLION)
                                      TABLE 67 CANADA: MARKET, BY COMPONENT,  2021–2028 (USD MILLION)
                                      TABLE 68 CANADA: MARKET, BY DELIVERY MODE,  2021–2028 (USD MILLION)
                                      TABLE 69 CANADA: MARKET, BY END USER,  2021–2028 (USD MILLION)
     11.3 EUROPE 
             11.3.1 EUROPE: RECESSION IMPACT
                        TABLE 70 EUROPE: LABORATORY INFORMATION SYSTEM MARKET, BY COUNTRY,  2021–2028 (USD MILLION)
                        TABLE 71 EUROPE: LABORATORY INFORMATION SYSTEMS MARKET, BY PRODUCT,  2021–2028 (USD MILLION)
                        TABLE 72 EUROPE: MARKET, BY COMPONENT,  2021–2028 (USD MILLION)
                        TABLE 73 EUROPE: MARKET, BY DELIVERY MODE,  2021–2028 (USD MILLION)
                        TABLE 74 EUROPE: MARKET, BY END USER,  2021–2028 (USD MILLION)
             11.3.2 GERMANY
                        11.3.2.1 Germany to dominate LIS market in Europe
                                      TABLE 75 GERMANY: LABORATORY INFORMATION SYSTEM INDUSTRY, BY PRODUCT,  2021–2028 (USD MILLION)
                                      TABLE 76 GERMANY: MARKET, BY COMPONENT, 2021–2028 (USD MILLION)
                                      TABLE 77 GERMANY: MARKET, BY DELIVERY MODE,  2021–2028 (USD MILLION)
                                      TABLE 78 GERMANY: LABORATORY INFORMATION SYSTEM INDUSTRY, BY END USER,  2021–2028 (USD MILLION)
             11.3.3 UK
                        11.3.3.1 Government initiatives to propel adoption of LIS
                                      TABLE 79 UK: LABORATORY INFORMATION SYSTEM MARKET, BY PRODUCT,  2021–2028 (USD MILLION)
                                      TABLE 80 UK: MARKET, BY COMPONENT,  2021–2028 (USD MILLION)
                                      TABLE 81 UK: MARKET, BY DELIVERY MODE,  2021–2028 (USD MILLION)
                                      TABLE 82 UK: MARKET, BY END USER,  2021–2028 (USD MILLION)
             11.3.4 FRANCE
                        11.3.4.1 Strong focus on adoption of advanced technologies to favor market growth
                                      TABLE 83 FRANCE: LABORATORY INFORMATION SYSTEM MARKET, BY PRODUCT,  2021–2028 (USD MILLION)
                                      TABLE 84 FRANCE: MARKET, BY COMPONENT,  2021–2028 (USD MILLION)
                                      TABLE 85 FRANCE: MARKET, BY DELIVERY MODE,  2021–2028 (USD MILLION)
                                      TABLE 86 FRANCE: MARKET, BY END USER,  2021–2028 (USD MILLION)
             11.3.5 ITALY
                        11.3.5.1 Need to automate workflows and effectively manage samples to boost market growth
                                      TABLE 87 ITALY: LABORATORY INFORMATION SYSTEM INDUSTRY, BY PRODUCT,  2021–2028 (USD MILLION)
                                      TABLE 88 ITALY: MARKET, BY COMPONENT,  2021–2028 (USD MILLION)
                                      TABLE 89 ITALY: MARKET, BY DELIVERY MODE,  2021–2028 (USD MILLION)
                                      TABLE 90 ITALY: LABORATORY INFORMATION SYSTEMS INDUSTRY, BY END USER,  2021–2028 (USD MILLION)
             11.3.6 SPAIN
                        11.3.6.1 Growing focus on improving laboratory workflows to support adoption of LIS
                                      TABLE 91 SPAIN: LABORATORY INFORMATION SYSTEM MARKET, BY PRODUCT,  2021–2028 (USD MILLION)
                                      TABLE 92 SPAIN: LABORATORY INFORMATION SYSTEMS MARKET, BY COMPONENT,  2021–2028 (USD MILLION)
                                      TABLE 93 SPAIN: MARKET, BY DELIVERY MODE,  2021–2028 (USD MILLION)
                                      TABLE 94 SPAIN: MARKET, BY END USER,  2021–2028 (USD MILLION)
             11.3.7 REST OF EUROPE
                        TABLE 95 REST OF EUROPE: LABORATORY INFORMATION SYSTEM MARKET, BY PRODUCT,  2021–2028 (USD MILLION)
                        TABLE 96 REST OF EUROPE: MARKET, BY COMPONENT, 2021–2028 (USD MILLION)
                        TABLE 97 REST OF EUROPE: MARKET, BY DELIVERY MODE, 2021–2028 (USD MILLION)
                        TABLE 98 REST OF EUROPE: MARKET, BY END USER,  2021–2028 (USD MILLION)
     11.4 ASIA PACIFIC 
             11.4.1 ASIA PACIFIC: RECESSION IMPACT
                        FIGURE 37 ASIA PACIFIC: LABORATORY INFORMATION SYSTEM MARKET SNAPSHOT
                        TABLE 99 ASIA PACIFIC: MARKET, BY COUNTRY,  2021–2028 (USD MILLION)
                        TABLE 100 ASIA PACIFIC: MARKET, BY PRODUCT,  2021–2028 (USD MILLION)
                        TABLE 101 ASIA PACIFIC: MARKET, BY COMPONENT,  2021–2028 (USD MILLION)
                        TABLE 102 ASIA PACIFIC: MARKET, BY DELIVERY MODE,  2021–2028 (USD MILLION)
                        TABLE 103 ASIA PACIFIC: LABORATORY INFORMATION SYSTEM INDUSTRY, BY END USER,  2021–2028 (USD MILLION)
             11.4.2 CHINA
                        11.4.2.1 High prevalence of chronic diseases to drive implementation of LIS
                                      TABLE 104 CHINA: LABORATORY INFORMATION SYSTEM INDUSTRY, BY PRODUCT,  2021–2028 (USD MILLION)
                                      TABLE 105 CHINA: MARKET, BY COMPONENT,  2021–2028 (USD MILLION)
                                      TABLE 106 CHINA: MARKET, BY DELIVERY MODE,  2021–2028 (USD MILLION)
                                      TABLE 107 CHINA: MARKET, BY END USER,  2021–2028 (USD MILLION)
             11.4.3 JAPAN
                        11.4.3.1 Growing geriatric population to increase market demand
                                      TABLE 108 JAPAN: LABORATORY INFORMATION SYSTEM MARKET, BY PRODUCT,  2021–2028 (USD MILLION)
                                      TABLE 109 JAPAN: MARKET, BY COMPONENT,  2021–2028 (USD MILLION)
                                      TABLE 110 JAPAN: MARKET, BY DELIVERY MODE,  2021–2028 (USD MILLION)
                                      TABLE 111 JAPAN: MARKET, BY END USER,  2021–2028 (USD MILLION)
             11.4.4 INDIA
                        11.4.4.1 Rapid growth in healthcare industry to drive demand for laboratory information systems
                                      TABLE 112 INDIA: LABORATORY INFORMATION SYSTEM MARKET, BY PRODUCT,  2021–2028 (USD MILLION)
                                      TABLE 113 INDIA: LABORATORY INFORMATION SYSTEMS MARKET, BY COMPONENT,  2021–2028 (USD MILLION)
                                      TABLE 114 INDIA: MARKET, BY DELIVERY MODE,  2021–2028 (USD MILLION)
                                      TABLE 115 INDIA: LABORATORY INFORMATION SYSTEMS INDUSTRY, BY END USER,  2021–2028 (USD MILLION)
             11.4.5 AUSTRALIA & NEW ZEALAND
                        11.4.5.1 Increasing investments in research to provide opportunities  for growth
                                      TABLE 116 AUSTRALIA & NEW ZEALAND: LABORATORY INFORMATION SYSTEM MARKET,  BY PRODUCT, 2021–2028 (USD MILLION)
                                      TABLE 117 AUSTRALIA & NEW ZEALAND: MARKET,  BY COMPONENT, 2021–2028 (USD MILLION)
                                      TABLE 118 AUSTRALIA & NEW ZEALAND: MARKET, BY DELIVERY MODE, 2021–2028 (USD MILLION)
                                      TABLE 119 AUSTRALIA & NEW ZEALAND: MARKET,  BY END USER, 2021–2028 (USD MILLION)
             11.4.6 REST OF ASIA PACIFIC
                        TABLE 120 REST OF ASIA PACIFIC: LABORATORY INFORMATION SYSTEM INDUSTRY, BY PRODUCT, 2021–2028 (USD MILLION)
                        TABLE 121 REST OF ASIA PACIFIC: LABORATORY INFORMATION SYSTEMS MARKET, BY COMPONENT, 2021–2028 (USD MILLION)
                        TABLE 122 REST OF ASIA PACIFIC: MARKET, BY DELIVERY MODE, 2021–2028 (USD MILLION)
                        TABLE 123 REST OF ASIA PACIFIC: MARKET, BY END USER, 2021–2028 (USD MILLION)
     11.5 LATIN AMERICA 
             11.5.1 RISING AWARENESS OF HCIT SOLUTIONS TO SUPPORT MARKET GROWTH
             11.5.2 LATIN AMERICA: RECESSION IMPACT
                        TABLE 124 LATIN AMERICA: LABORATORY INFORMATION SYSTEM MARKET, BY PRODUCT,  2021–2028 (USD MILLION)
                        TABLE 125 LATIN AMERICA: MARKET, BY COMPONENT, 2021–2028 (USD MILLION)
                        TABLE 126 LATIN AMERICA: MARKET, BY DELIVERY MODE, 2021–2028 (USD MILLION)
                        TABLE 127 LATIN AMERICA: MARKET, BY END USER,  2021–2028 (USD MILLION)
     11.6 MIDDLE EAST & AFRICA 
             11.6.1 IMPROVING HEALTHCARE INFRASTRUCTURE AND FOCUS ON SAFETY MEASURES TO BOOST GROWTH
             11.6.2 MIDDLE EAST & AFRICA: RECESSION IMPACT
                        TABLE 128 MIDDLE EAST & AFRICA: LABORATORY INFORMATION SYSTEM MARKET,  BY PRODUCT, 2021–2028 (USD MILLION)
                        TABLE 129 MIDDLE EAST & AFRICA: MARKET,  BY COMPONENT, 2021–2028 (USD MILLION)
                        TABLE 130 MIDDLE EAST & AFRICA: MARKET, BY DELIVERY MODE, 2021–2028 (USD MILLION)
                        TABLE 131 MIDDLE EAST & AFRICA: MARKET,  BY END USER, 2021–2028 (USD MILLION)
 
12 COMPETITIVE LANDSCAPE (Page No. - 163)
     12.1 OVERVIEW 
     12.2 STRATEGIES ADOPTED BY KEY MARKET PLAYERS 
             TABLE 132 OVERVIEW OF STRATEGIES ADOPTED BY KEY PLAYERS IN LABORATORY INFORMATION SYSTEM MARKET, JANUARY 2021–MAY 2023
     12.3 REVENUE SHARE ANALYSIS OF TOP MARKET PLAYERS, 2022 
             FIGURE 38 REVENUE SHARE ANALYSIS OF KEY MARKET PLAYERS, 2022
     12.4 MARKET SHARE ANALYSIS 
             FIGURE 39 LABORATORY INFORMATION SYSTEM INDUSTRY: MARKET SHARE ANALYSIS, 2022
     12.5 COMPANY EVALUATION QUADRANT FOR KEY PLAYERS 
             12.5.1 STARS
             12.5.2 PERVASIVE PLAYERS
             12.5.3 EMERGING LEADERS
             12.5.4 PARTICIPANTS
                        FIGURE 40 MARKET: COMPANY EVALUATION QUADRANT FOR KEY PLAYERS, 2022
     12.6 COMPANY EVALUATION QUADRANT FOR START-UPS/SMES 
             12.6.1 PROGRESSIVE COMPANIES
             12.6.2 DYNAMIC COMPANIES
             12.6.3 RESPONSIVE COMPANIES
             12.6.4 STARTING BLOCKS
                        FIGURE 41 MARKET: COMPANY EVALUATION QUADRANT FOR START-UPS/SMES, 2022
             12.6.5 LABORATORY INFORMATION SYSTEM INDUSTRY:  COMPETITIVE BENCHMARKING
                        TABLE 133 MARKET: DETAILED LIST OF KEY SMES/START-UPS
                        TABLE 134 MARKET: COMPETITIVE BENCHMARKING OF  KEY SMES SMES/START-UPS
     12.7 LABORATORY INFORMATION SYSTEM INDUSTRY:  COMPANY FOOTPRINT 
             TABLE 135 BY DELIVERY MODE: COMPANY FOOTPRINT
             TABLE 136 BY END USER: COMPANY FOOTPRINT
             TABLE 137 BY REGION: COMPANY FOOTPRINT
             TABLE 138 COMPANY FOOTPRINT
     12.8 COMPETITIVE SCENARIOS AND TRENDS 
             12.8.1 PRODUCT LAUNCHES & ENHANCEMENTS
                        TABLE 139 MARKET: PRODUCT LAUNCHES & ENHANCEMENTS, 2021–2023
             12.8.2 DEALS
                        TABLE 140 MARKET: DEALS, 2021–2023
             12.8.3 OTHER DEVELOPMENTS
                        TABLE 141 MARKET: OTHER DEVELOPMENTS,  2021–2023
 
13 COMPANY PROFILES (Page No. - 186)
     13.1 KEY PLAYERS 
(Business Overview, Products Offered, Recent Developments, and MnM View (Key strengths/Right to Win, Strategic Choices Made, and Weaknesses and Competitive Threats))*
             13.1.1 ORCHARD SOFTWARE CORPORATION
                        TABLE 142 ORCHARD SOFTWARE CORPORATION: COMPANY OVERVIEW
             13.1.2 CLINISYS
                        TABLE 143 CLINISYS: COMPANY OVERVIEW
             13.1.3 ORACLE CORPORATION
                        TABLE 144 ORACLE CORPORATION: COMPANY OVERVIEW
                        FIGURE 42 ORACLE CORPORATION: COMPANY SNAPSHOT (2022)
             13.1.4 COMPUTER PROGRAMS AND SYSTEMS, INC.
                        TABLE 145 COMPUTER PROGRAMS AND SYSTEMS, INC.: COMPANY OVERVIEW
                        FIGURE 43 COMPUTER PROGRAMS AND SYSTEMS, INC.: COMPANY SNAPSHOT (2022)
             13.1.5 COMPUGROUP MEDICAL
                        TABLE 146 COMPUGROUP MEDICAL: COMPANY OVERVIEW
                        FIGURE 44 COMPUGROUP MEDICAL: COMPANY SNAPSHOT (2022)
             13.1.6 SOFT COMPUTER CONSULTANTS, INC. (SCC SOFT COMPUTER)
                        TABLE 147 SOFT COMPUTER CONSULTANTS, INC.: COMPANY OVERVIEW
             13.1.7 AMERICAN SOFT SOLUTIONS CORP.
                        TABLE 148 AMERICAN SOFT SOLUTIONS CORP.: COMPANY OVERVIEW
             13.1.8 EPIC SYSTEMS CORPORATION
                        TABLE 149 EPIC SYSTEMS CORPORATION: COMPANY OVERVIEW
             13.1.9 ALTERA DIGITAL HEALTH
                        TABLE 150 ALTERA DIGITAL HEALTH: COMPANY OVERVIEW
             13.1.10 ASPYRA
                        TABLE 151 ASPYRA: COMPANY OVERVIEW
             13.1.11 COMP PRO MED INC.
                        TABLE 152 COMP PRO MED INC.: COMPANY OVERVIEW
             13.1.12 COMPUTER SERVICE & SUPPORT, INC.
                        TABLE 153 COMPUTER SERVICE & SUPPORT, INC.: COMPANY OVERVIEW
             13.1.13 CLINICAL SOFTWARE SOLUTIONS
                        TABLE 154 CLINICAL SOFTWARE SOLUTIONS: COMPANY OVERVIEW
             13.1.14 GPI S.P.A.
                        TABLE 155 GPI S.P.A.: COMPANY OVERVIEW
                        FIGURE 45 GPI S.P.A.: COMPANY SNAPSHOT (2022)
             13.1.15 LIGOLAB INFORMATION SYSTEM
                        TABLE 156 LIGOLAB INFORMATION SYSTEM: COMPANY OVERVIEW
             13.1.16 LABWARE
                        TABLE 157 LABWARE: COMPANY OVERVIEW
             13.1.17 LABVANTAGE SOLUTIONS, INC.
                        TABLE 158 LABVANTAGE SOLUTIONS, INC.: COMPANY OVERVIEW
             13.1.18 XIFIN, INC.
                        TABLE 159 XIFIN, INC.: COMPANY OVERVIEW
             13.1.19 SEACOAST LABORATORY DATA SYSTEMS
                        TABLE 160 SEACOAST LABORATORY DATA SYSTEMS: COMPANY OVERVIEW
             13.1.20 VERADIGM LLC
                        TABLE 161 VERADIGM LLC: COMPANY OVERVIEW
                        FIGURE 46 VERADIGM LLC: COMPANY SNAPSHOT (2021)
     13.2 OTHER PLAYERS 
             13.2.1 WEBPATHLAB
             13.2.2 APEX HEALTHWARE
             13.2.3 TECHNIDATA
             13.2.4 PATHAGILITY
             13.2.5 HEX LABORATORY SYSTEMS
             13.2.6 CLINSIS
             13.2.7 ALPHASOFT
             13.2.8 DENDI, INC.
 
*Details on Business Overview, Products Offered, Recent Developments, and MnM View (Key strengths/Right to Win, Strategic Choices Made, and Weaknesses and Competitive Threats) might not be captured in case of unlisted companies.
 
14 APPENDIX (Page No. - 252)
     14.1 DISCUSSION GUIDE 
     14.2 KNOWLEDGESTORE: MARKETSANDMARKETS’  SUBSCRIPTION PORTAL 
     14.3 CUSTOMIZATION OPTIONS 
     14.4 RELATED REPORTS 
     14.5 AUTHOR DETAILS 

The study involved major activities in estimating the current size of the global Laboratory information systems market. Exhaustive secondary research was done to collect information on the peer and parent markets. The next step was to validate these findings, assumptions, and sizing with industry experts across the value chain through primary research. The research process involved the study of various factors affecting the industry to identify the segmentation types, industry trends, key players, competitive landscape, key market dynamics, and key player strategies. Both top-down and bottom-up approaches were employed to estimate the complete market size. Thereafter, market breakdown and data triangulation were used to estimate the market size of the segments and subsegments.

Secondary Research

This research study involved the use of widespread secondary sources; directories; databases, such as D&B, Bloomberg Business, and Factiva; white papers; government sources; corporate filings (such as annual reports, investor presentations, and financial statements); and trade, business, and professional associations; and company house documents. Secondary research was used to identify and collect information for this extensive, technical, market-oriented, and commercial study of the Laboratory information systems market. It was also used to obtain important information about the top players, market classification and segmentation according to industry trends to the bottom-most level, geographic markets, technology perspectives, and key developments related to the market. A database of the key industry leaders was also prepared using secondary research.

Primary Research

In the primary research process, various sources from both the supply and demand sides were interviewed to obtain qualitative and quantitative information for this report. The primary sources from the supply side include industry experts such as CEOs, vice presidents, marketing and sales directors, technology and innovation directors, and related key executives from various key companies and organizations operating in the Laboratory information systems market. The primary sources from the demand side include key executives from hospital laboratories, independent laboratories, physician office laboratories, blood banks, nursing homes, public health labs, and retail clinics.  After the complete market engineering process (which includes calculations for the market statistics, market breakdown, market size estimation, market forecasts, and data triangulation), extensive primary research has been conducted to gather information and verify and validate the critical numbers obtained.

Primary interviews were conducted to gather insights such as market statistics, data on revenue collected from the products and services, market breakdowns, market size estimations, market forecasting, and data triangulation. Primary research also helped in understanding the various trends related to type, deployment, end user, and region.

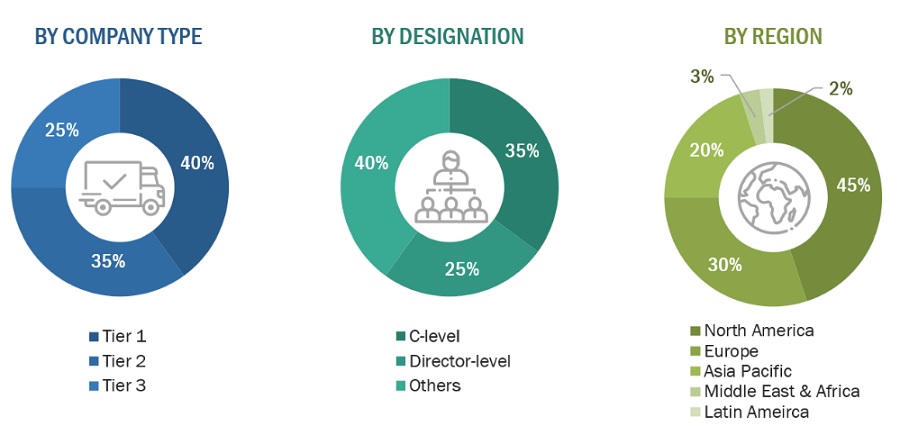
A breakdown of the primary respondents is provided below:
Laboratory Information System Market Size, and Share

*Others include sales managers, marketing managers, and product managers.

Note: Tiers are defined based on a company’s total revenue, as of 2021: Tier 1 = >USD 1 billion, Tier 2 = USD 500 million to USD 1 billion, and Tier 3 = <USD 500 million.

To know about the assumptions considered for the study, download the pdf brochure

Market Size Estimation

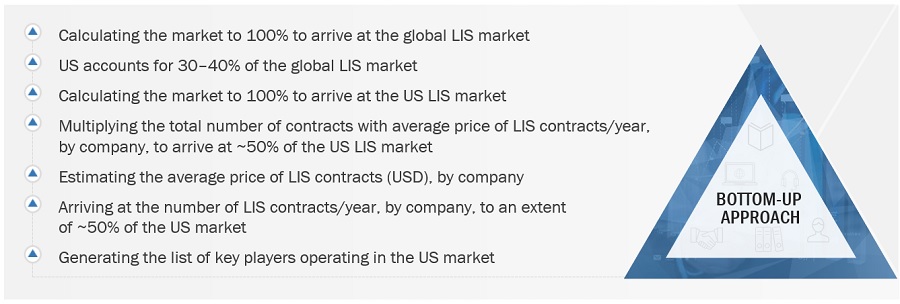
Both top-down (segmental analysis of major segments) and bottom-up approaches (assessment of utilization/adoption/penetration trends by product, component, delivery mode, end-user, and region) were used to estimate and validate the total size of the Laboratory information systems market. These methods were also used extensively to estimate the size of various subsegments in the market. The research methodology used to estimate the market size includes the following:

  • The key players in the industry and market have been identified through extensive secondary research, and their market share in the respective regions has been determined through both primary and secondary research.
  • The industry’s supply chain and market size, in terms of value, have been determined through primary and secondary research processes.
  • All percentage shares, splits, and breakdowns have been determined using secondary sources and verified through primary sources.

Global Laboratory information systems Market Size: Top-Down Approach
Laboratory Information System Market Size, and Share

To know about the assumptions considered for the study, Request for Free Sample Report

Laboratory Information System Market Size, and Share

Data Triangulation

After arriving at the overall market size from the estimation process explained above, the total market has been split into several segments and subsegments. To complete the overall market engineering process and arrive at the exact statistics for all the segments and subsegments, the data triangulation and market breakdown processes have been employed, wherever applicable. The data has been triangulated by studying various factors and trends from both the demand- and supply sides. Along with this, the market has been validated using both the top-down and bottom-up approaches.

Market Definition

A laboratory information systems is a software system specifically designed to manage and streamline the operations of a laboratory. It serves as a comprehensive information management tool that automates and integrates various laboratory processes, including test ordering, sample tracking, result entry, quality control, inventory management, reporting, and storing specimen data.

LIS systems typically include features such as test catalog management, sample tracking, instrument interface connectivity, result validation, data analysis, report generation, and billing integration. LIS has traditionally been adept at sending laboratory test orders to lab instruments, tracking those orders, and recording the results, typically to a searchable database for future reference. Laboratories with a dedicated LIS can strengthen the country public health by sharing data between laboratories, clinicians, and public health networks. Physicians and lab technicians use LIS to coordinate a variety of inpatient and outpatient medical testing, including hematology, chemistry, immunology, and microbiology.

Key Stakeholders

  • Laboratory information systems solution providers
  • Platform providers
  • Technology providers
  • Healthcare providers
  • Hospitals
  • Clinics
  • System Integrators
  • Physician groups and organizations
  • Clinical laboratories, medical laboratories, research laboratories, and other healthcare facilities
  • Forums, alliances, and associations
  • Distributors
  • Venture capitalists
  • Government organizations
  • Institutional investors and investment banks
  • Investors/Shareholders
  • Consulting companies in the LIS sector
  • Raw material and component manufacturers

Objectives of the Study

  • To define, describe, and forecast the laboratory information systems market, by product, component, delivery mode, end-user, and region
  • To provide detailed information regarding the major drivers, restraints, opportunities, and challenges influencing market growth
  • To strategically analyze micro-markets with respect to individual growth trends, prospects, and contributions to the overall laboratory information systems market
  • To analyze market opportunities for stakeholders and provide details of the competitive landscape for key players
  • To forecast the size of the laboratory information systems market in five main regions (along with their respective key countries): North America, Europe, Asia Pacific, the Middle East & Africa, and Latin America.
  • To provide key industry insights such as supply chain analysis, regulatory analysis, patent analysis, and recession impact analysis
  • To profile the key players in the laboratory information systems market and comprehensively analyze their core competencies
  • To track and analyze competitive developments such as product launches & enhancements, partnerships, acquisitions, sales contracts, agreements, collaborations, expansions, and R&D activities of the leading players in the laboratory information systems market
  • To benchmark players within the laboratory information systems market using the Competitive Leadership Mapping framework, which analyzes market players on various parameters within the broad categories of business strategy, market share, and product offering

Available Customizations:

With the given market data, MarketsandMarkets offers customizations as per the client’s specific needs. The following customization options are available for this report:

Product Analysis

  • Product matrix, which gives a detailed comparison of the product portfolio of each company

Geographic Analysis

  • Further breakdown of the Latin American laboratory information systems market into Brazil, Mexico, and the rest of Latin America.
  • Further breakdown of the Middle East & Africa laboratory information systems market into the UAE, Saudi Arabia, South Africa, and the rest of MEA countries

Company Information

  • Detailed analysis and profiling of additional market players (up to five)
Custom Market Research Services

We will customize the research for you, in case the report listed above does not meet with your exact requirements. Our custom research will comprehensively cover the business information you require to help you arrive at strategic and profitable business decisions.

Request Customization

Instant Answers with GPT - Ask Now!

Ask real questions. Get complete answers !
Report Code
HIT 2808
Published ON
Jul, 2023
Choose License Type
BUY NOW
  • SHARE
X
Request Customization
Speak to Analyst
Speak to Analyst
OR FACE-TO-FACE MEETING
PERSONALIZE THIS RESEARCH
  • Triangulate with your Own Data
  • Get Data as per your Format and Definition
  • Gain a Deeper Dive on a Specific Application, Geography, Customer or Competitor
  • Any level of Personalization
REQUEST A FREE CUSTOMIZATION
LET US HELP YOU!
  • What are the Known and Unknown Adjacencies Impacting the Laboratory Information System (LIS) Market
  • What will your New Revenue Sources be?
  • Who will be your Top Customer; what will make them switch?
  • Defend your Market Share or Win Competitors
  • Get a Scorecard for Target Partners
CUSTOMIZED WORKSHOP REQUEST
+1-888-600-6441
  • Call Us
  • +1-888-600-6441 (Corporate office hours)
  • +1-888-600-6441 (US/Can toll free)
  • +44-800-368-9399 (UK office hours)
CONNECT WITH US
ABOUT TRUST ONLINE
©2024 MarketsandMarkets Research Private Ltd. All rights reserved
DMCA.com Protection Status Website Feedback