
Pyrethroids Market by Type (Bifenthrin, Deltamethrin, Permethrin, Cypermethrin, Cyfluthrin, and Lambda-cyhalothrin), by Crop Type (Cereals & Grains, Oilseeds & Pulses, and Fruits & Vegetables) & by Region - Global Trends & Forecasts to 2019
Market Segmentation
| Report Metrics | Details |
|
Market size available for years |
2014 - 2019 |
|
CAGR % |
4.8 |
Top 10 companies in Pyrethroids Market
Pyrethroids Market News
| Publish Date | Pyrethroids Market Updates |
|---|---|
| 19-Dec-2023 | Anopheles gambiae s.s. resistance to pyrethroids and DDT in semi ... |
| 03-Oct-2023 | Effectiveness of piperonyl butoxide and pyrethroid-treated long ... |
| 21-Jul-2023 | Can the performance of pyrethroid-chlorfenapyr nets be reduced ... |


Pyrethroids are a special chemical class of active ingredients; these compounds are related to pyrethrins and resemble them in insecticidal properties. Pyrethroids are low in toxicity to mammals and birds, and require very low doses to kill insects.
Various secondary sources such as encyclopedias, directories, and databases have been used to identify and collect information useful for this extensive commercial study of the pyrethroids market. The primary sources such as experts from related industries and suppliers have been interviewed to obtain and verify critical information as well as to assess the future prospects of pyrethroids.
This report estimates the size of the global pyrethroids market in terms of value. The market has been segmented on the basis of the key active ingredient types, crop types, and regions. The active ingredient types segment is further classified in to bifenthrin, deltamethrin, permethrin, cypermethrin, cyfluthrin, lambda-cyhalothrin, and other pyrethroids. The global pyrethroids market was led by Asia-Pacific, where India, China, and Pakistan in 2013 were estimated to be the largest consumers. Europe was the second-largest region with regard to the consumption of pyrethroids in 2013. The crop type segment is further categorized in cereals & grains, oilseeds & pulses, fruits & vegetables, and other crops. The global pyrethroids market is primarily divided into regions and further segmented on the basis of the key countries in that region, in terms of value. Drivers, restraints, opportunities, and challenges of the market have also been discussed in detail in the report.
The report provides a complete analysis of the key global players in the pyrethroids industry, with a clear insight and commentary on the developments, trends, and their product portfolio. With a huge opportunity in the market, the existing companies are experiencing a significant shift in the industry. We have also profiled the leading players of this industry include FMC Corporation (U.S.), Bayer CropScience AG (Germany), United Phosphorus Limited (India), Sumitomo Chemical, Co., Ltd (Japan), and Syngenta AG (Switzerland), and Nufarm Ltd. (Australia) in the report.
Pyrethroid Market Size, by Region, 2013 vs. 2019 ($Million)
E � Estimated; P � Projected
Source: Expert Interviews, Government Authorities, Related Associations/Institutes, Related Research Publications, Government Publications, and MarketsandMarkets Analysis
Get online access to the report on the World's First Market Intelligence Cloud
Request Sample Scope of the Report

This report focuses on the pyrethroids market. This research categorizes pyrethroids on the basis of the key active ingredient types, crop types, and regions.
On the basis of regions, the market has been segmented as follows:
- North America
- Europe
- Asia-Pacific
- Latin America
- Rest of the World (RoW)
On the basis of the active ingredient type, the market has been segmented as follows:
- Bifenthrin
- Deltamethrin
- Permethrin
- Cypermethrin
- Cyfluthrin
- Lambda-cyhalothrin
- Other types
On the basis of crop type, the market has been segmented as follows:
- Cereals & grains
- Oilseeds & Pulses
- Fruits & vegetables
- Other crop types
The market for pyrethroids has a significant impact on food and processed food markets. Pyrethroids are broadly categorized as bifenthrin, deltamethrin, permethrin, cypermethrin, cyfluthrin, lambda-cyhalothrin on the basis of active ingredients. Pyrethroids are gaining a more favorable response when compared to other insecticide classes. The global market is also segmented on the basis of its applications in different crop types such as cereals & grains, oilseeds & pulses, fruits & vegetables, and others that include turf, forage, and ornamental crops. The oilseeds & pulses were found to form the largest market for pyrethroids in 2013. These products were mostly used to control household pests and maintain turfs & ornamentals, but its usage has become essential for all key crops such as cereals grains, tubers, and vegetables.
The size of the overall market was derived using forecasting techniques based on insecticide production and trade trends in various regions. Asia-Pacific and Europe were estimated to be two of the largest consumers of pyrethroids in 2013. The demand for pyrethroids is increasing in developing countries such as China, Japan, India, and Brazil because of the rising demand. The demand for pyrethroids has been augmented by the intense cultivation of soybeans, corn, potatoes, sugar beets, sugarcane, and oilseeds in Latin America.
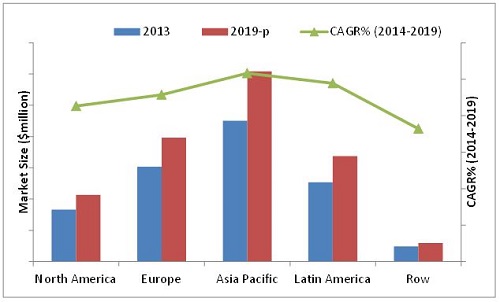
Pyrethroids Market Size, by Region, 2013 vs. 2019 ($Million)
E � Estimated; P � Projected
Source: Expert Interviews, Government Authorities, Related Associations/Institutes, Related Research Publications, Government Publications, and MarketsandMarkets Analysis
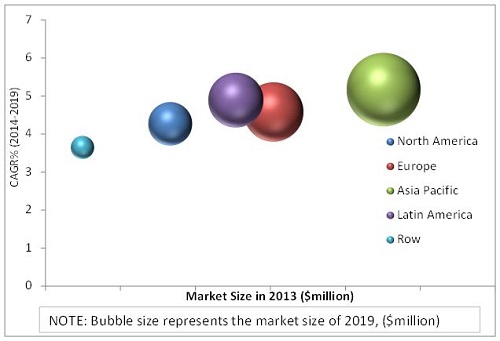
The market for pyrethroids is estimated to be valued at $2,559.62 million in 2014, and is projected to reach $3,233.24 million by 2019, at a CAGR of 4.8%. The pyrethroids market is projected to grow steadily due to the increasing importance regarding the health of crops in the agriculture industry. In 2013, Asia-Pacific was the largest market; this market is projected to grow to $1,216.79 million by 2019, at a CAGR of 5.2%, as studied from 2014. Europe is the second-largest market for pyrethroids after Asia-Pacific and is projected to grow at a CAGR of 4.6% for the period under review.
The key players in this market have developed a range of innovative products to target specific crops needs. Thus, the pyrethroids market is gaining more global presence and acceptance among customers. Key participants in the pyrethroids market include Bayer CropScience AG (Germany), Sumitomo Chemical Co., Ltd. (Japan), Syngenta AG (Switzerland), FMC Corporation (U.S.), and Nufarm Limited (Australia). These players are implementing different strategies to grow in the pyrethroids market. Expansions and acquisitions have been the key moves made by the market players for global expansion. In the next five years, research collaborations and distributional contracts will line up the agenda of the companies.
Table of Contents
1 Introduction (Page No. - 15)
1.1 Objectives of the Study
1.2 Market Definition
1.3 Markets Covered
1.3.1 Period Considered For the Pyrethroids Market
1.4 Base Currency Considered For the Pyrethroids Market
1.5 Stakeholders
1.6 Limitations
2 Research Methodology (Page No. - 18)
2.1 Research Data
2.1.1 Key Data from Secondary Sources
2.1.1 Key Data from Primary Sources
2.1.1.1 Key Industry Insights
2.1.1.2 Breakdown of Primaries
2.2 Factor Analysis
2.2.1 Introduction
2.2.2 Demand-Side Analysis
2.2.2.1 Increased Food Demand of Continuous Growing Population
2.2.2.2 Developing Economies
2.2.2.3 Increasing Middle-Class Population, 2009�2030
2.2.2.4 GDP (PPP), 2013
2.2.3 Supply-Side Analysis
2.2.3.1 Number of New Products Launched
2.2.3.2 Global Rise in Export of Pesticides
2.3 Market Size Estimation
2.3.1 Bottom-Up Approach
2.3.2 Top-Down Approach
2.4 Market Breakdown & Data Triangulation
2.5 Market Share Estimation
2.6 Assumptions
2.7 Limitations
3 Executive Summary (Page No. - 30)
4 Premium Insights (Page No. - 35)
4.1 Extensive Market Opportunities in this Market
4.2 Pyrethroids Market, Key Crop Type Segments ($Million)
4.3 Asia-Pacific: The Largest Consumer of Pyrethroids
4.4 Pyrethroids Market, By Country, 2013
4.5 Pyrethroids Market: Developed Vs. Developing Nations, 2014�2019 ($Million)
4.6 Pyrethroids Market Size, By Application, Type & Region, 2019 ($Million)
4.7 Product Growth Matrix
4.8 Life Cycle Analysis, By Region
4.9 Market Chasm Analysis
5 Market Overview (Page No. - 45)
5.1 Introduction
5.2 Evolution
5.3 Market Segmentation
5.3.1 Pyrethroids Market, By Type
5.3.2 Pyrethroid Market, By Crop Type
5.4 Market Dynamics
5.4.1 Drivers
5.4.1.1 High Stability in Sunlight & Less Quantity Required For Insect Control
5.4.1.2 Increasing Need for Better Yield Due To Decreasing Arable Land
5.4.1.3 Less Hazardous To the Environment
5.4.1.4 Rise in Global Food Consumption
5.4.2 Restraints
5.4.2.1 Environmental and Health-Related Regulations
5.4.2.2 Genetically Modified Seeds/Crops & Advancement in Biotechnology
5.4.3 Opportunity
5.4.3.1 Development of Fourth-Generation Pyrethroids for Pest Control
5.4.4 Challenges
5.4.4.1 Increased Usage of Bio-Insecticides in Agriculture
5.4.4.2 Changes in Pyrethroid and Pyrethrin Products Labeling
5.4.5 Burning Issues
5.4.5.1 Effects of the Use of Pyrethroids on Human and Animal Health
5.4.6 Winning Imperatives
5.4.6.1 Direct Cost Advantage over Other Insecticides
6 Industry Trends (Page No. - 54)
6.1 Introduction
6.2 Value Chain Analysis
6.3 Supply Chain Analysis
6.3.1 Key Influencers
6.4 Industry Trends
6.5 Porter�s Five Forces Analysis
6.5.1 Intensity of Competitive Rivalry
6.5.2 Threat of New Entrants
6.5.3 Threat of Substitutes
6.5.4 Bargaining Power of Suppliers
6.5.5 Bargaining Power of Buyers
6.6 Strategic Benchmarking
6.6.1 Aggressive Expansion Through Acquisitions
6.6.2 Market Consolidation Through Portfolio Enhancement
7 Pyrethroids Market, By Active Ingredient (Page No. - 63)
7.1 Introduction
7.2 Bifenthrin
7.3 Deltamethrin
7.4 Permethrin
7.5 Cypermethrin
7.6 Cyfluthrin
7.7 Lambda-Cyhalothrin
7.8 Other Pyrethroids
8 Pyrethroids Market, By Crop Type (Page No. - 74)
8.1 Introduction
8.2 Cereals & Grains
8.3 Oilseeds & Pulses
8.4 Fruits & Vegetables
8.5 Other Crop Types
9 Pyrethroids Market, By Region (Page No. - 82)
9.1 Introduction
9.2 North America
9.2.1 U.S.
9.2.2 Mexico
9.2.3 Canada
9.3 Europe
9.3.1 Spain
9.3.2 Italy
9.3.3 Germany
9.3.4 France
9.3.5 Poland
9.3.6 Rest of Europe
9.4 Asia-Pacific
9.4.1 China
9.4.2 Japan
9.4.3 Pakistan
9.4.4 India
9.4.5 Australia
9.4.6 Rest of Asia-Pacific
9.5 Latin America
9.5.1 Brazil
9.5.2 Argentina
9.5.3 Rest of Latin America
9.6 Rest of the World
9.6.1 South Africa
9.6.2 Egypt
9.6.3 Other Row Countries
9.7 Pest Analysis
9.7.1 Political Factors
9.7.2 Economic Factors
9.7.3 Social Factors
9.7.4 Technological Factors
10 Competitive Landscape (Page No. - 116)
10.1 Overview
10.2 Pyrethroids Market: Product Portfolio, By Company
10.3 Competitive Situation & Trends
10.4 Expansions & Investments
10.5 Agreements, Collaborations & Partnerships
10.6 Acquisitions
10.7 New Product Launches
11 Company Profiles (Company at a Glance, Recent Financials, Products & Services, Strategies & Insights, & Recent Developments)* (Page No. - 127)
11.1 Introduction
11.2 Bayer Cropscience AG
11.3 Sumitomo Chemical Co., Ltd
11.4 Syngenta Ag
11.5 FMC Corporation
11.6 Nufarm Limited
11.7 BASF SE
11.8 Adama Agricultural Solutions Ltd.
11.9 United Phosphorus Limited
11.10 The Dow Chemical Company
11.11 E.I. Du Pont De Nemours And Company
*Details On Company At A Glance, Recent Financials, Products & Services, Strategies & Insights, & Recent Developments Might Not Be Captured In Case Of Unlisted Companies.
12 Appendix (Page No. - 160)
12.1 Discussion Guide
12.2 Introducing RT: Real-Time Market Intelligence
12.3 Available Customizations
List of Tables (69 Tables)
Table 1 Concern for Environment and Human Health Propels the Demand for Pyrethroids
Table 2 Strict Health Regulations Restrain the Market
Table 3 New Market Opportunities with New Innovations
Table 4 Increased Use Of Natural Insecticides Challenges The Market
Table 5 Pyrethroids Market Size, By Active Ingredient, 2012�2019 ($Million)
Table 6 Bifenthrin Market Size, By Region, 2012�2019 ($Million)
Table 7 Deltamethrin Market Size, By Region, 2012�2019 ($Million)
Table 8 Permethrin Market Size, By Region, 2012�2019 ($Million)
Table 9 Cypermethrin Market Size, By Region, 2012�2019 ($Million)
Table 10 Cyfluthrin Market Size, By Region, 2012�2019 ($Million)
Table 11 Lambda-Cyhalothrin Market Size, By Region, 2012�2019 ($Million)
Table 12 Other Pyrethroids Market Size, By Region, 2012�2019 ($Million)
Table 13 Pyrethroids Market Size, By Crop Type, 2012�2019 ($Million)
Table 14 Pyrethroids in Cereals & Grains Market Size, By Region, 2012�2019 ($Million)
Table 15 Pyrethroids in Oilseeds & Pulses Market Size, By Region, 2012�2019 ($Million)
Table 16 Pyrethroids in Fruits & Vegetables Market Size, By Region, 2012�2019 ($Million)
Table 17 Pyrethroids in Other Crop Types Market Size, By Region, 2012�2019 ($Million)
Table 18 Pyrethroids Market Size, By Region, 2012�2019 ($Million)
Table 19 North America: Pyrethroids Market Size, By Country, 2012�2019 ($Million)
Table 20 U.S.: Pyrethroids Market Size, By Active Ingredient, 2012�2019 ($Million)
Table 21 U.S.: Market Size, By Crop Type, 2012�2019 ($Million)
Table 22 Mexico: Pyrethroids Market Size, By Active Ingredient, 2012�2019 ($Million)
Table 23 Mexico: Market Size, By Crop Type, 2012�2019 ($Million)
Table 24 Canada: Pyrethroids Market Size, By Active Ingredient, 2012�2019 ($Million)
Table 25 Canada: Market Size, By Crop Type, 2012�2019 ($Million)
Table 26 Europe: Pyrethroids Market Size, By Country, 2012�2019 ($Million)
Table 27 Spain: Pyrethroids Market Size, By Active Ingredient, 2012�2019 ($Million)
Table 28 Spain: Market Size, By Crop Type, 2012�2019 ($Million)
Table 29 Italy: Pyrethroids Market Size, By Active Ingredient, 2012�2019 ($Million)
Table 30 Italy: Market Size, By Crop Type, 2012�2019 ($Million)
Table 31 Germany: Pyrethroids Market Size, By Active Ingredient, 2012�2019 ($Million)
Table 32 Germany: Market Size, By Crop Type, 2012�2019 ($Million)
Table 33 France: Pyrethroids Market Size, By Active Ingredient, 2012�2019 ($Million)
Table 34 France: Market Size, By Crop Type, 2012�2019 ($Million)
Table 35 Poland: Pyrethroids Market Size, By Active Ingredient, 2012�2019 ($Million)
Table 36 Poland: Market Size, By Crop Type, 2012�2019 ($Million)
Table 37 Rest of Europe: Pyrethroids Market Size, By Active Ingredient, 2012�2019 ($Million)
Table 38 Rest of Europe: Market Size, By Crop Type, 2012�2019 ($Million)
Table 39 Asia-Pacific: Pyrethroids Market Size, By Country, 2012�2019 ($Million)
Table 40 China: Pyrethroids Market Size, By Active Ingredient, 2012�2019 ($Million)
Table 41 China: Market Size, By Crop Type, 2012�2019 ($Million)
Table 42 Japan: Pyrethroids Market Size, By Active Ingredient, 2012�2019 ($Million)
Table 43 Japan: Market Size, By Crop Type, 2012�2019 ($Million)
Table 44 Pakistan: Pyrethroids Market Size, By Active Ingredient, 2012�2019 ($Million)
Table 45 Pakistan: Market Size, By Crop Type, 2012�2019 ($Million)
Table 46 India: Pyrethroids Market Size, By Active Ingredient, 2012�2019 ($Million)
Table 47 India: Market Size, By Crop Type, 2012�2019 ($Million)
Table 48 Australia: Pyrethroids Market Size, By Active Ingredient, 2012�2019 ($Million)
Table 49 Australia: Market Size, By Crop Type, 2012�2019 ($Million)
Table 50 Rest of Asia-Pacific: Pyrethroids Market Size, By Active Ingredient, 2012�2019 ($Million)
Table 51 Rest of Asia-Pacific: Market Size, By Crop Type, 2012�2019 ($Million)
Table 52 Latin America: Pyrethroids Market By Market Size, By Country, 2012�2019 ($Million)
Table 53 Brazil: Pyrethroids Market By Market Size, By Active Ingredient, 2012�2019 ($Million)
Table 54 Brazil: By Market Size, By Crop Type, 2012�2019 ($Million)
Table 55 Argentina: Pyrethroids Market By Market Size, By Active Ingredient, 2012�2019 ($Million)
Table 56 Argentina: By Market Size, By Crop Type, 2012�2019 ($Million)
Table 57 Rest of Latin America: Pyrethroids Market By Market Size, By Active Ingredient, 2012�2019 ($Million)
Table 58 Rest of Latin America: By Market Size, By Crop Type, 2012�2019 ($Million)
Table 59 ROW: By Market Size, By Country, 2012�2019 ($Million)
Table 60 South Africa: Pyrethroids Market By Market Size, By Active Ingredient, 2012�2019 ($Million)
Table 61 South Africa: By Market Size, By Crop Type, 2012�2019 ($Million)
Table 62 Egypt: Pyrethroids Market By Market Size, By Active Ingredient, 2012�2019 ($Million)
Table 63 Egypt: By Market Size, By Crop Type, 2012�2019 ($Million)
Table 64 Other ROW Countries: Pyrethroids Market By Market Size, By Active Ingredient, 2012�2019 ($Million)
Table 65 Other ROW Countries: By Market Size, By Crop Type, 2012�2019 ($Million)
Table 66 Expansions & Investments, 2010�2014
Table 67 Agreements, Collaborations & Partnerships, 2010�2014
Table 68 Acquisitions, 2010�2014
Table 69 New Product Launches, 2012�2014
List of Figures (72 Figures)
Figure 1 Market Segmentation
Figure 2 Pyrethroids Market Research Methodology
Figure 3 Breakdown of Primary Interviews: By Company Type, Designation & Region
Figure 4 Global Population Projected To reach ~9.5 Billion By 2050
Figure 5 Middle-Class Population In Asia-Pacific Is Projected To Grow & Account For The Largest Share In The Global Market By 2030
Figure 6 Top 5 Economies Based On GDP (PPP) Are U.S., China, India, Japan, & Germany
Figure 7 Export Value of Pesticides, 2002�2012 ($Million)
Figure 8 Market Size Estimation Methodology: Bottom-Up Approach
Figure 9 Market Size Estimation Methodology: Top-Down Approach
Figure 10 Pyrethroids Market Snapshot (2014 vs. 2019): Bifenthrin & Deltamethrin Poised For Better Future Growth ($Million)
Figure 11 Oilseeds & Pulses and Fruits & Vegetables: Most Attractive Market Segments For Investment in the Next Five Years
Figure 12 Asia-Pacific Projected To Register High Growth Rate, 2014�2019
Figure 13 A Growing Market With Increasing Demand Potential, 2014�2019 ($Million)
Figure 14 Cereals & Grains to Grow At the Fastest Rate in Forecast Period, 2014�2019 ($Million)
Figure 15 Asia-Pacific: Top Growing Market Segments, By Crop Type And Country
Figure 16 Significant Consumption Trends in China & Brazil, 2013
Figure 17 Developing Markets Project Promising Growth Opportunities, 2014�2019 ($Million)
Figure 18 Latin America to Dominate Oilseeds & Pulses Segment, 2019 ($Million)
Figure 19 Fourth-Generation Pyrethroids Projected To Achieve Optimum Growth after 2�5 Years
Figure 20 Asia-Pacific Projected To Remain In the Growth Phase in the Next Five Years, 2013
Figure 21 Environmental Risks & Research Expertise Restrain the Production of Fourth-Generation Pyrethroids, 2013
Figure 22 Development Of Pyrethroids
Figure 23 Pyrethroids Market Segmentation, By Type
Figure 24 Market, By Crop Type
Figure 25 Increasing Need for Better Yield Driving the Growth of Pyrethroid Market
Figure 26 R&D and Final Product Blends: The Main Phases of Value Addition
Figure 27 Research Strength & Market Distribution: Critical Checkpoints
Figure 28 Productive Distribution Network Through Regional Tie-Ups & Acquisitions: Leading Trend Among Key Market Players
Figure 29 Porter�s Five Forces Analysis (2014): Stronger R&D Support Has Intensified the Industrial Rivalry
Figure 30 Strategic Benchmarking: Adama & Sumitomo Lead the Aggressive Market Exploration
Figure 31 Strategic Benchmarking: Sumitomo & FMC Improvised and Enhanced Portfolio Structure
Figure 32 Increased Ecological Concerns & Product Innovations Boost the Growth of the Pyrethroid Market
Figure 33 Better Market Growth Projected In Latin America
Figure 34 Asia-Pacific To Witness Higher Demand For Deltamethrin
Figure 35 Third-Generation Permethrin To Have A Strong Presence In All The Regions
Figure 36 Asia-Pacific & Latin America: Potential Markets For Product Launch
Figure 37 Cyfluthrin Projected To Cause Significant Impact Within 3�5 Years
Figure 38 Fourth-Generation Lambda-Cyhalothrin Projected To Record Better Growth In Latin America
Figure 39 Asia-Pacific: Potential Market for Expired Active Ingredient Patents
Figure 40 Fruits & Vegetables Growing With the Highest Growth Rate
Figure 41 Oilseeds & Pulses: The Largest Pyrethroids Segment, 2014 Vs. 2019 ($Million)
Figure 42 Asia-Pacific Leading The Cereals & Grains Segment
Figure 43 The Market For Pyrethroids In Oilseeds & Pulses To Be Highest In The Latin America
Figure 44 Asia-Pacific To Dominate The Fruits & Vegetables Segment
Figure 45 Asia-Pacific To Lead The Other Crop Types Segment In The Next Five Years
Figure 46 Geographic Snapshot: Rapidly Growing China & Germany Are Emerging As New Hotspots, 2014�2019
Figure 47 China to Dominate the Pyrethroids Market
Figure 48 Extensive Demand For Crop Cultivation Driving The Demand For Pyrethroids In North America, 2013
Figure 49 North America: Pyrethroids Market Size, By Active Ingredient, 2014 Vs. 2019
Figure 50 Europe: Pyrethroids Market Size, 2014 vs. 2019 ($Million)
Figure 51 Asia-Pacific: Pyrethroids Market Size, 2014 vs. 2019 ($Million)
Figure 52 Strong Investments for Global Expansion: Key Approach Of Leading Companies
Figure 53 Revenues of Key Companies in the Pyrethroids Market, 2009�2013 ($Million)
Figure 54 Pyrethroids Portfolio Share, By Company, 2010�2014
Figure 55 Significant Investment On Research Facility & Plant Expansion
Figure 56 Research & Distributional Tie-Ups: Popular Strategies For Global Expansion
Figure 57 Geographical Revenue Mix of Top 5 Market Players
Figure 58 Bayer Cropscience AG: Business Overview
Figure 59 Bayer Cropscience AG: SWOT Analysis
Figure 60 Sumitomo Chemical Co., Ltd: Business Overview
Figure 61 Sumitomo Chemical Co., Ltd: SWOT Analysis
Figure 62 Syngenta AG: Business Overview
Figure 63 Syngenta Ag: SWOT Analysis
Figure 64 FMC Corporation: Business Overview
Figure 65 FMC Corporation: SWOT Analysis
Figure 66 Nufarm Limited: Business Overview
Figure 67 Nufarm Limited: SWOT Analysis
Figure 68 BASF SE: Business Overview
Figure 69 Adama Agricultural Solutions Ltd.: Business Overview
Figure 70 United Phosphorus Limited: Business Overview
Figure 71 The Dow Chemical Company: Business Overview
Figure 72 E.I. Du Pont De Nemours And Company: Business Overview


Growth opportunities and latent adjacency in Pyrethroids Market