North America Pressure Pumping Market by Type (Hydraulic Fracturing and Cementing), Resource Type (Conventional and Unconventional), Well Type (Horizontal and Vertical), and Country - Global Forecasts to 2021


[130 Pages Report] The North America pressure pumping market was estimated to be USD 26.29 Billion in 2016, and is expected to grow at a CAGR of 2.6% from 2016 to 2021. Increasing shale explorations in the U.S. and Canada and auction of shale gas fields in Mexico in 2017, are the factors driving the market.
The years considered for the study are as follows:
- Base Year � 2015
- Estimated Year � 2016
- Projected Year � 2021
- Forecast Period � 2016 to 2021
2015 has been considered as the base year for company profiles. Whenever information was unavailable for the base year, the prior year has been considered.
Objectives of the Study
- To define, describe, and forecast the North American pressure pumping market by resource type, well type, service type, and country
- To provide detailed information regarding major factors influencing the growth of the pressure pumping market (drivers, restraints, opportunities, and industry-specific challenges)
- To strategically analyze the pressure pumping market with respect to individual growth trends, future prospects, and contribution of each segment to the market
- To strategically profile key players and comprehensively analyze their market shares and core competencies
- To track and analyze competitive developments such as contracts & agreements and partnerships & collaborations in the North American pressure pumping market
Research Methodology
This research study involved the use of extensive secondary sources, directories, and databases such as Hoover�s, Bloomberg Businessweek, Factiva, and OneSource to identify and collect information useful for a technical, market-oriented, and commercial study of the North American pressure pumping market. Primary sources are mainly industry experts from core and related industries, preferred suppliers, manufacturers, distributors, service providers, technology developers, standard & certification organizations of companies, and organizations related to all the segments of this industry�s value chain. The points given below explain the research methodology.
- Study of annual revenue and market developments of major players that provide pressure pumping services
- Analysis of demands for pressure pumping services from end-users
- Assessment of future trends and growth of end-users in the pressure pumping services market
- Assessment of the pressure pumping services market with respect to service type, well type, and resource type
- Study of market trends in various countries by service type of pressure pumping, used
- Study of contracts & developments related to the pressure pumping services market by key players across North America
- Finalization of overall market sizes by triangulating the supply-side data, which includes product developments, supply chain, and annual revenues of companies manufacturing pressure pumping services across North America
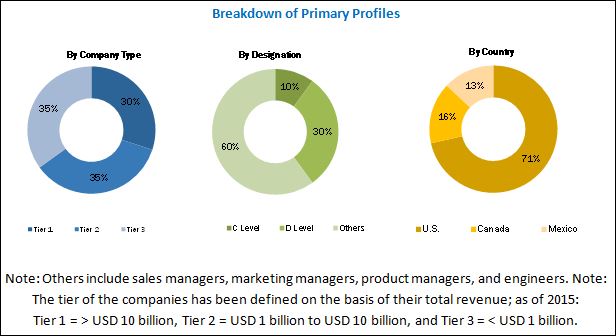
After arriving at the overall market size, the total market has been split into several segments and sub-segments. The figure given below illustrates the breakdown of primaries conducted during the research study on the basis of company type, designation, and region.
To know about the assumptions considered for the study, download the pdf brochure
Market Ecosystem:
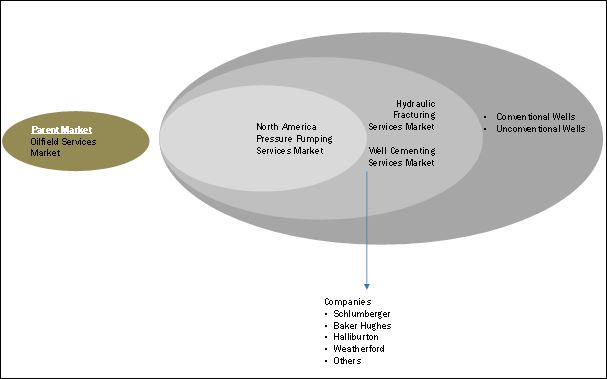
The ecosystem of the North American pressure pumping service market starts with the parent market that is oilfield services market, which is further categorized as service types such as coiled tubing, well completion, well intervention, pressure pumping, OCTG, drilling waste management, drilling & completion fluids, and wireline services. The pressure pumping service market is further classified into hydraulic fracturing services, well cementing services, and others.
Target Audience:
The report�s target audience includes:
- Pressure pumping service providers
- Pressure pumping equipment manufacturers
- Government and research organizations
- National and local government organizations
- Institutional investors
- Associations
Get online access to the report on the World's First Market Intelligence Cloud
Request Sample Scope of the Report
:

- By Service Type
- Hydraulic Fracturing
- Cementing
- Others
- By Well Type
- Horizontal
- Vertical
- By Resource Type
- Conventional
- Unconventional
- By Country
- U.S.
- Canada
- Mexico
Available Customizations:
With the given market data, MarketsandMarkets offers customizations as per the client�s specific needs. The following customization options are available for this report:
Regional Analysis
Further breakdown of region or country-specific analysis
Company Information
Detailed analysis and profiling of additional market players (up to 5)
The global North American pressure pumping market is projected to grow at a CAGR of 2.6% from 2016 to 2021, to reach a market size of USD 29.94 Billion by 2021. This growth is attributed to exploration and shale plays in the U.S. & Canada and scheduled auction of shale fields in Mexico in 2017.
The report segments the North American pressure pumping market on the basis of service type into hydraulic fracturing, well cementing, and other services. The widely used service in the North American pressure pumping market. Production from hydraulically fractured wells, now makes up about two-thirds of the total U.S. marketed gas production. This share of production is even greater than the share of crude oil produced using that method, where hydraulic fracturing accounts for about half of the current U.S. crude oil production.
The North American pressure pumping market is segmented based on well type into horizontal and vertical wells. The horizontal wells segment accounted for the largest market share in 2015 and is expected to grow at the highest CAGR during the forecast period. Increasing hydraulic fracturing activity in the U.S. is expected to propel the demand for pressure pumping in horizontal wells in North America during the forecast period.
The report segments the North American pressure pumping market based on resource type into conventional and unconventional wells. Unconventional wells accounted for the largest market share in 2015, due to abundance of unconventional wells in North America. About 52% of the total U.S. crude oil production in 2015 was from unconventional wells mainly from shale. The unconventional wells segment is also expected to grow at the fastest rate during the forecast period, owing to increasing demand for hydraulic fracturing in the U.S. This segment is expected to create new revenue pockets for the North American pressure pumping market during the forecast period.
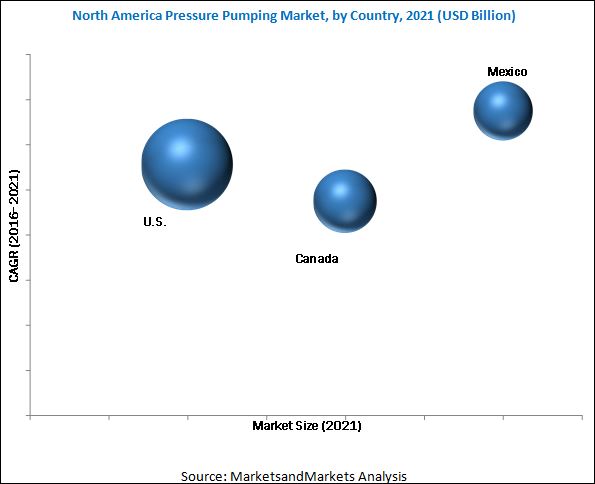
In this report, the North American pressure pumping market has been analyzed with respect to three countries, namely, the U.S., Canada, and Mexico. The U.S. is expected to dominate the North American pressure pumping market during the forecast period, owing to increasing hydraulic fracturing in the country. The Mexican pressure pumping market is projected to grow at the highest CAGR from 2016 to 2021, due to the presence of large untapped reserves in the country that are expected to be auctioned in the year 2017.
Declining oil prices globally could be a restraint for the North American pressure pumping market. Also, increasing public opposition to hydraulic fracturing and environmental concerns regarding effects of hydraulic fracturing could also hamper the pressure pumping market.
Leading players in the North American pressure pumping market include Schlumberger (U.S.), Halliburton (U.S.), Baker Hughes (U.S.), and Weatherford (Switzerland). New product launch was the strategy most commonly adopted by top players in the market from 2013 to 2016. It was followed by expansion.
To speak to our analyst for a discussion on the above findings, click Speak to Analyst
Table of Contents
1 Introduction (Page No. - 12)
1.1 Objectives of the Study
1.2 Market Definition
1.3 Market Scope
1.3.1 Years Considered for Study
1.4 Currency
1.5 Limitation
1.6 Stakeholders
2 Research Methodology (Page No. - 15)
2.1 Research Data
2.1.1 Secondary Data
2.1.1.1 Key Data From Secondary Sources
2.1.2 Primary Data
2.1.2.1 Key Data From Primary Sources
2.1.2.2 Breakdown of Primaries
2.2 Market Size Estimation
2.3 Market Breakdown and Data Triangulation
2.4 Research Assumptions
3 Executive Summary (Page No. - 23)
3.1 Historical Backdrop
3.2 Current Scenario
3.3 Future Outlook
3.4 Conclusion
4 Premium Insights (Page No. - 28)
4.1 Attractive Opportunities in the Market, 2016�2021
4.2 The U.S. Accounted for the Largest Market Share in 2015
4.3 Market, By Service Type, 2016 and 2021
4.4 Market, By Country, 2016
4.5 Market, By Resource Type, 2016 & 2021
4.6 Market, By Well Type , 2016 & 2021
5 Market Overview (Page No. - 32)
5.1 Introduction to Pressure Pumping
5.2 North American Pressure Pumping Market: Market Segmentation
5.2.1 By Service Type
5.2.2 By Resource Type
5.2.3 By Well Type
5.2.4 By Country
5.3 Market Dynamics
5.3.1 Drivers
5.3.1.1 Increased Rate of Hydrocarbon Recovered From Reservoir
5.3.1.2 Growth in Exploration in Canadian Oil Sands
5.3.1.3 Shale Play in the U.S.
5.3.2 Restraints
5.3.2.1 Water Availability and Contamination Concerns for Hydraulic Fracturing
5.3.2.2 Public Opposition to Pressure Pumping
5.3.2.2.1 Concerns About Seismic Activities
5.3.2.3 Adverse Effects of Strict Government Regulations on the Pressure Pumping Industry
5.3.3 Opportunities
5.3.3.1 �Waterless� Fracturing-Foams
5.3.4 Challenges
5.3.4.1 Depressed Oil Prices
5.3.4.2 Fluctuating Prices and Variable Supply of Guar Gum
6 Pressure Pumping Market, By Service Type (Page No. - 41)
6.1 Introduction
6.1.1 Cost Analysis
6.2 Hydraulic Fracturing
6.3 Cementing Services
6.3.1 Primary Cementing
6.3.2 Remedial Cementing
6.3.3 Consistent Market Increment Due to Its Necessary Requirements
6.4 Other Pressure Pumping Services
7 North American Pressure Pumping Market, By Well Type (Page No. - 49)
7.1 Introduction
7.2 Horizontal Wells
7.3 Vertical Wells
8 North American Pressure Pumping Market, By Resource Type (Page No. - 55)
8.1 Introduction
8.2 Conventional
8.3 Unconventional
9 North American Pressure Pumping Market, By Region (Page No. - 60)
9.1 Introduction
9.1.1 By Country
9.1.1.1 U.S.
9.1.1.2 Canada
9.1.1.3 Mexico
10 Competitive Landscape (Page No. - 76)
10.1 Overview
10.2 Key Players of the North American Pressure Pumping Industry
10.2.1 Key Company Focus Area
10.2.1.1 Growth Strategies in the Pressure Pumping Industry
10.3 Market Share Analysis
10.3.1 Global Market Scenario
10.4 Competitive Situations & Trends
10.5 North American Pressure Pumping Market: MnM Dive � Vendor Comparission
11 Company Profiles (Page No. - 83)
(Overview, Products & Services, Strategies & Insights, Developments and MnM View)*
11.1 Introduction
11.2 Baker Hughes Incorporated
11.3 Halliburton Company
11.4 Schlumberger Limited
11.5 Weatherford International PLC.
11.6 Frac Tech Services International
11.7 Trican Well Services Ltd.
11.8 Calfrac Well Services Ltd.
11.9 RPC, Inc.
11.10 Step Energy Services Ltd.
11.11 Key Energy Services
11.12 San Antonio International
11.13 Sanjel Energy Services
11.14 Liberty Oilfields Services
11.15 Magnum Cementing Services, Ltd.
11.16 Consolidated Oil Well Services, LLC
11.17 Nine Energy Services
*Details on Overview, Products & Services, Strategies & Insights, Developments and MnM View Might Not Be Captured in Case of Unlisted Companies.
12 Appendix (Page No. - 122)
12.1 Expert Insights
12.2 Discussion Guide
12.3 Knowledge Store: Marketsandmarkets� Subscription Portal
12.4 Introducing RT: Real-Time Market Intelligence
12.5 Available Customization
12.6 Related Reports
12.7 Author Details
List of Tables (63 Tables)
Table 1 Well Water Use, By Activity
Table 2 Comparison: Fracturing Fluids
Table 3 North America Pressure Pumping Market Size, By Service Type, 2014�2021 (USD Million)
Table 4 Hydraulic Fracturing Market Size, By Country, 2014�2021 (USD Million)
Table 5 Hydraulic Fracturing Market Size, By Well Type, 2014�2021, (USD Million)
Table 6 Hydraulic Fracturing Market, By Resource Type, 2014�2021, (USD Million)
Table 7 Cementing Service Market Size, By Country, 2014�2021 (USD Million)
Table 8 Cementing Services Market, By Resource Type, 2014�2021, (USD Million)
Table 9 Cementing Services Market, By Well Type, 2014�2021, (USD Million)
Table 10 Others Pressure Pumping Services Market Size, By Country, 2014�2021 (USD Million)
Table 11 Others Services Market, By Resource Type, 2014�2021, (USD Million)
Table 12 Other Services Market, By Well Type, 2014�2021, (USD Million)
Table 13 Global Market Size, By Well Type, 2014�2021 (USD Million)
Table 14 Horizontal Well Type Market, By Country, 2014�2021 (USD Million)
Table 15 Horizontal Well Type Market, By Resource Type, 2014�2021 (USD Million)
Table 16 Horizontal Well Type Market, By Service Type, 2014�2021 (USD Million)
Table 17 Horizontal Well Hydraulic Fracturing Market, By Country, 2014�2021 (USD Million)
Table 18 Horizontal Well Cementing Fracturing Market, By Country, 2014�2021 (USD Million)
Table 19 Vertical Well Type Market Size, By Country, 2014�2021 (USD Million)
Table 20 Vertical Well Type Market Size, By Resource Type, 2014�2021 (USD Million)
Table 21 Vertical Well Type Market Size, By Service Type, 2014�2021 (USD Million)
Table 22 Pressure Pumping Market Size, By Type, 2014�2021 (USD Million)
Table 23 Conventional Market, By Country, 2014�2021 (USD Million)
Table 24 Conventional Market, By Service Type, 2014�2021 (USD Million)
Table 25 Conventional Market, By Well Type, 2014�2021 (USD Million)
Table 26 Unconventional Market, By Country, 2014�2021 (USD Million)
Table 27 Unconventional Market, By Service Type, 2014�2021 (USD Million)
Table 28 Unconventional Market, By Well Type, 2014�2021 (USD Million)
Table 29 Global Market, By Country, 2014�2021 (USD Million)
Table 30 U.S. Pressure Pumping Market, By Service Type, 2014�2021, (USD Million)
Table 31 U.S. Pressure Pumping Market, By Resource Type, 2014�2021, (USD Million)
Table 32 U.S. Pressure Pumping Market, By Well Type, 2014�2021, (USD Million)
Table 33 U.S. Hydraulic Fracturing Market, By Resource Type, 2014�2021, (USD Million)
Table 34 U.S. Cementing Services Market, By Resource Type, 2014�2021, (USD Million)
Table 35 U.S. Horizontal Well Market, By Resource Type, 2014�2021, (USD Million)
Table 36 U.S. Vertical Well Market, By Resource Type, 2014�2021, (USD Million)
Table 37 U.S. Hydraulic Fracturing Market, By Well Type, 2014�2021, (USD Million)
Table 38 U.S. Cementing Service Market, By Well Type, 2014�2021, (USD Million)
Table 39 U.S. Conventional Market, By Well Type, 2014�2021, (USD Million)
Table 40 U.S. Unconventional Market, By Well Type, 2014�2021, (USD Million)
Table 41 Canada Pressure Pumping Market, By Service Type, 2014�2021, (USD Million)
Table 42 Canada Pressure Pumping Market, By Resource Type, 2014�2021, (USD Million)
Table 43 Canada Pressure Pumping Market, By Well Type, 2014�2021, (USD Million)
Table 44 Canada Hydraulic Fracturing Market, By Resource Type, 2014�2021, (USD Million)
Table 45 Canada Cementing Services Market, By Resource Type, 2014�2021, (USD Million)
Table 46 Canada Horizontal Well Market, By Resource Type, 2014�2021, (USD Million)
Table 47 Canada Vertical Well Market, By Resource Type, 2014�2021, (USD Million)
Table 48 Canada Hydraulic Fracturing Market, By Well Type, 2014�2021, (USD Million)
Table 49 Canada Cementing Service Market, By Well Type, 2014�2021, (USD Million)
Table 50 Canada Conventional Market, By Well Type, 2014�2021, (USD Million)
Table 51 Canada Unconventional Market, By Well Type, 2014�2021, (USD Million)
Table 52 Mexican Pressure Pumping Market, By Service Type, 2014�2021, (USD Million)
Table 53 Mexican Pressure Pumping Market, By Resource Type, 2014�2021, (USD Million)
Table 54 Mexican Pressure Pumping Market, By Well Type, 2014�2021, (USD Million)
Table 55 Mexican Hydraulic Fracturing Market, By Resource Type, 2014�2021, (USD Million)
Table 56 Mexican Cementing Services Market, By Resource Type, 2014�2021, (USD Million)
Table 57 Mexican Horizontal Well Market, By Resource Type, 2014�2021, (USD Million)
Table 58 Mexican Vertical Well Market, By Resource Type, 2014�2021, (USD Million)
Table 59 Mexican Hydraulic Fracturing Market, By Well Type, 2014�2021, (USD Million)
Table 60 Mexican Cementing Service Market, By Well Type, 2014�2021, (USD Million)
Table 61 Mexican Conventional Market, By Well Type, 2014�2021, (USD Million)
Table 62 Mexican Unconventional Market, By Well Type, 2014�2021, (USD Million)
Table 63 Service Portfolio of Major Pressure Pumping Companies
List of Figures (43 Figures)
Figure 1 Market: Market Segmentation
Figure 2 Market: Research Design
Figure 3 Market Size Estimation Methodology: Bottom-Up Approach
Figure 4 Market Size Estimation Methodology: Top-Down Approach
Figure 5 Data Triangulation Methodology
Figure 6 The U.S. Occupied the Largest Market Share (Value) in 2015
Figure 7 Market, By Resource Type, 2016 & 2021 (USD Million).
Figure 8 The Horizontal Segment Market is Expected to Account for the Maximum Share During the Forecast Period
Figure 9 The Hydraulic Fracturing Segment is Estimated to Dominate in the Next Five Years
Figure 10 Market Snapshot: the U.S. is Expected to Hold the Largest Market Share in the Next Five Years
Figure 11 Top Market Development (2014�2015)
Figure 12 Growth in Exploration of Canadian Oil Sands and Shale Play in the U.S. is Expected to Drive the North American Pressure Pumping Market During the Forecast Period
Figure 13 The Mexican Market is Expected to Grow at A Highest Rate During the Forecast Period
Figure 14 The Hydraulic Fracturing Segment is Expected to Hold the Largest Share During the Forecast Period
Figure 15 Hydraulic Fracturing Segment is Projected to Hold the Largest Share in Market During the Forecast Period
Figure 16 The Unconventional Segment Accounted for the Largest Market Share in 2015
Figure 17 The Horizontal Well Segment is Estimated to Dominate the North America Pressure Pumping During the Forecast Period
Figure 18 Market: By Service Type, Resource Type, Well Type, and Country
Figure 19 Market Dyanamics
Figure 20 Foam Applications in Oil & Gas�1950 Till Date
Figure 21 Guar Gum Price Trends (USD/Pound) 2007�2012
Figure 22 Hydraulic Fracturing Segment is Expected to Account for the Largest Market Share in 2016
Figure 23 Well Drilling Cost Analysis, 2015
Figure 24 The Horizontal Well Segment is Expected to Account for the Largest Market Share During the Forecast Period
Figure 25 The Unconventional Resource Segment is Expected to Account for the Largest Market Share During the Forecast Period
Figure 26 Regional Snapshot � Growth Rates of North American Pressure Pumping Market in Important Countries, 2016�2021
Figure 27 Market, By Country, 2016 and 2021
Figure 28 Market Snapshot (2015)
Figure 29 Companies Adopted New Product/Service Launch and Merger & Acquisition as Key Strategies to Capture the Market, 2010�2016
Figure 30 Market Share Analysis, 2015
Figure 31 Market Evaluation Framework: Contracts & Agreements, New Product/Service Launch, and Mergers & Acquisitions Have Fueled the Growth of the Companies, 2013�2016
Figure 32 Vendor Dive Matrix
Figure 33 Service Strategy Comparission
Figure 34 Business Strategy Comparission
Figure 35 Regional Revenue Mix of the Top Five Players
Figure 36 Baker Hughes Incorporated: Company Snapshot
Figure 37 Halliburton Company: Company Snapshot
Figure 38 Schlumberger Limited: Company Snapshot
Figure 39 Weatherford International PLC.: Company Snapshot
Figure 40 Trican Well Services Ltd.: Company Snapshot
Figure 41 Calfrac Well Services Ltd.: Company Snapshot
Figure 42 RPC, Inc.: Company Snapshot
Figure 43 Key Energy Services: Company Snapshot


Growth opportunities and latent adjacency in North America Pressure Pumping Market