Glass Substrate Market

Glass Substrate Market by Type (Borosilicate, Silicon, Ceramic, And Fused Silica/Quartz-Based Glass Substrates), End-Use Industry (Electronics, Automotive, Medical, Aerospace & Defense, Solar), and Region - Global Forecast to 2028

Report Code: CH 5755 Jan, 2024, by marketsandmarkets.com

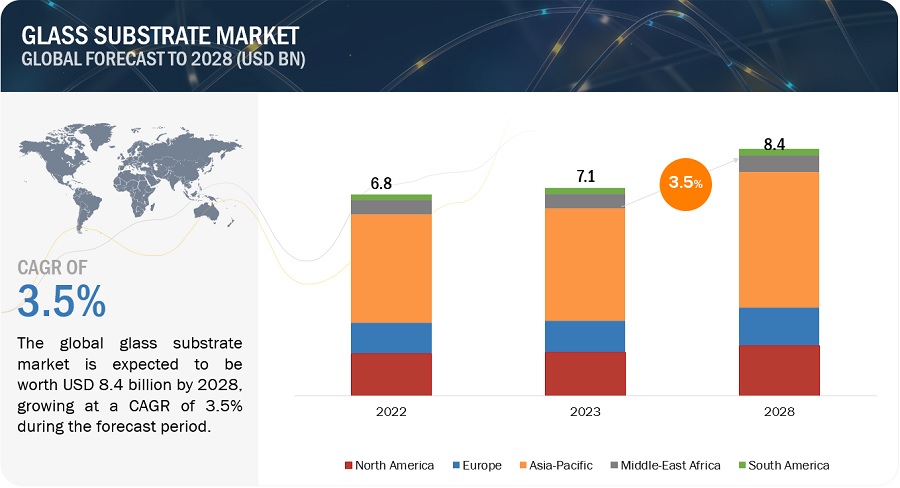
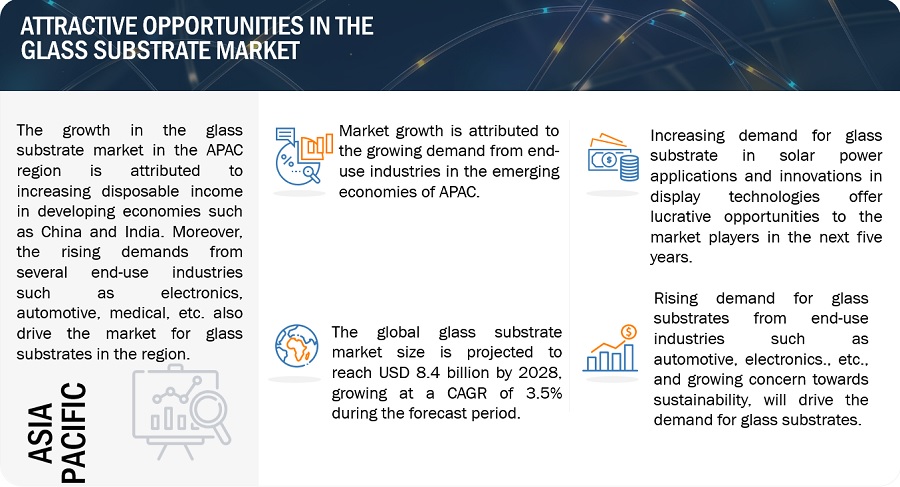
The glass substrate market size is estimated to be USD 7.1 billion in 2023, and it is projected to reach USD 8.4 billion by 2028 at a CAGR of 3.5%. One of the key factors expected to propel the growth of the glass substrate market is the expanding utilization of LCDs in consumer durables, smart handheld devices, and automotive applications. Additionally, the increasing demand for glass substrates is foreseen to be driven by the growth in the semiconductor and electronics industries.

Global Glass Substrate Market Trends
Glass Substrate Market

To know about the assumptions considered for the study, Request for Free Sample Report
Glass Substrate Market

Glass substrate Market Dynamics

Driver: Rising usage of LCDs in consumer electronics and automotive application

The surging demand for LCDs in consumer electronics and automotive applications is a pivotal driver behind the growth of the glass substrate market. LCDs, with their sleek designs and high-resolution displays, have become integral components in devices like smartphones, televisions, and laptops, elevating the visual experience for consumers. In the automotive sector, LCDs are increasingly incorporated into digital dashboards, infotainment systems, and heads-up displays, contributing to enhanced driver interfaces and passenger entertainment. As these industries continue to expand and innovate, the need for high-quality glass substrates to support the production of advanced LCDs becomes paramount. The glass substrate market is thus propelled by the growing usage of LCD technology across these dynamic sectors, reflecting the broader trend toward sophisticated and visually immersive electronic displays.

Restraint: High manufacturing and technology costs

The growth of the glass substrate market faces challenges due to the constraints imposed by high technology and manufacturing costs. The intricate processes involved in producing advanced glass substrates for applications such as electronics, displays, and semiconductors often require sophisticated technologies, leading to elevated development costs. Additionally, the manufacturing processes demand precision and specialized equipment, contributing to higher production costs. These elevated costs act as a deterrent for some market players, impacting their ability to invest and innovate. As a result, the glass substrate market encounters obstacles in achieving broader adoption and market expansion, especially as the industry strives to strike a balance between advancing technology and managing the associated economic considerations. Addressing these cost-related challenges becomes imperative for fostering sustainable growth and widespread accessibility within the glass substrate market.

Opportunity: Growing use of glass substrate in solar power application

The burgeoning use of glass substrates in solar applications presents a significant opportunity for the growth of the glass substrate market. As the solar energy sector continues to expand, glass substrates find extensive application in the manufacturing of photovoltaic cells and solar panels. The transparency, durability, and thermal stability of glass make it an ideal substrate for encapsulating and protecting photovoltaic components, ensuring efficient energy conversion and extended lifespan of solar modules. The escalating demand for sustainable energy solutions, coupled with advancements in solar technologies, propels the need for high-performance glass substrates. This trend opens up avenues for innovation and market growth as the solar industry increasingly relies on robust and technologically advanced materials, positioning glass substrates at the forefront of opportunities within the evolving renewable energy landscape.

Challenges: LCD glass to meet strict quality requirements

A formidable challenge faced by the glass substrate market is the imperative to meet stringent quality restrictions in the production of LCD (Liquid Crystal Display) glass. LCDs, ubiquitous in consumer electronics and other industries, demand precise manufacturing processes to ensure flawless displays. Meeting high-quality standards involves minimizing defects, ensuring uniform thickness, and achieving optimal optical clarity in the glass substrate. The intricate nature of these requirements necessitates sophisticated production techniques, which, in turn, can escalate manufacturing costs. Striking a delicate balance between meeting stringent quality standards and managing production expenses poses a significant challenge for industry players. As the demand for impeccable display quality persists, the glass substrate market navigates the complex task of upholding rigorous quality restrictions while maintaining competitiveness in the dynamic landscape of display technologies.

Ecosystem of Glass Substrate Market
Glass Substrate Market Ecosystem

“Dominance of electronic industry in the Glass substrate end-use industry segment.”

Categorized by end-use industry, the glass substrate market includes segments such as electronics, automotive, medical, aerospace & defense, and solar. Notably, the electronics industry stands out as the largest segment within this market. The significant surge in the production of display devices, electronic components, semiconductors, MEMS devices, and information, computing, and telecommunication devices is anticipated to be a primary driver propelling the growth of the glass substrate market in the electronics sector.

“Borosilicate-based glass substrate is the most usable by type substrate in the glass substrate market.”

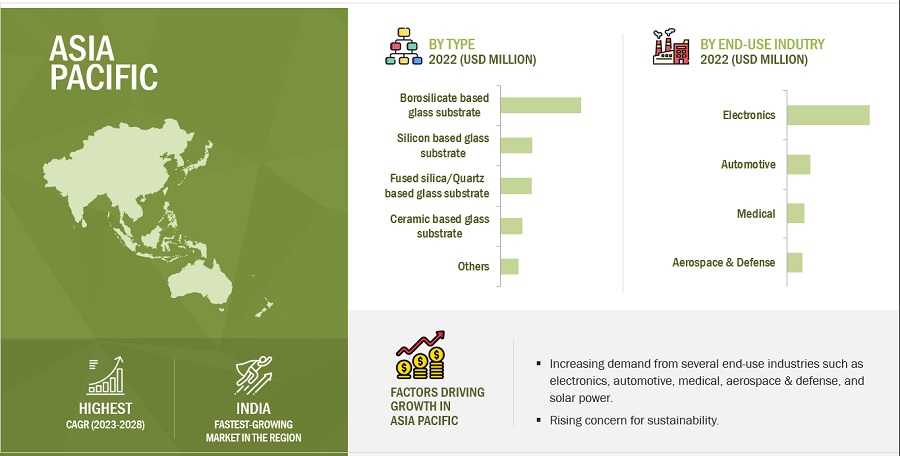
Categorized by type, the glass substrate market exhibits segmentation into borosilicate-based glass substrates, silicon-based glass substrates, ceramic-based glass substrates, fused silica/quartz-based glass substrates, and other variants. Among these, borosilicate-based glass substrates emerge as the most extensively employed type. This prevalence is attributed to their exceptional attributes, including a low coefficient of thermal expansion, high chemical resistivity, and superior surface strength, making them highly favored for various applications.

“APAC is the speediest-growing market for glass substrate market.”

In terms of value, the Asia Pacific will be the fastest-growing region in the overall glass substrate market.

This growth is attributed to rapid urbanization, increasing disposable income, and improving living standards, which drive the demands from several end-use industries such as electronics, automotive, medical, aerospace & defense, and solar power. Apart from this, the growing adoption of electronics gadgets such as consumer wearbales, smart watches, etc. This fuelled the market of glass substrates in the region during the forecast period.
Glass Substrate Market by Region

To know about the assumptions considered for the study, download the pdf brochure

Key Market Players

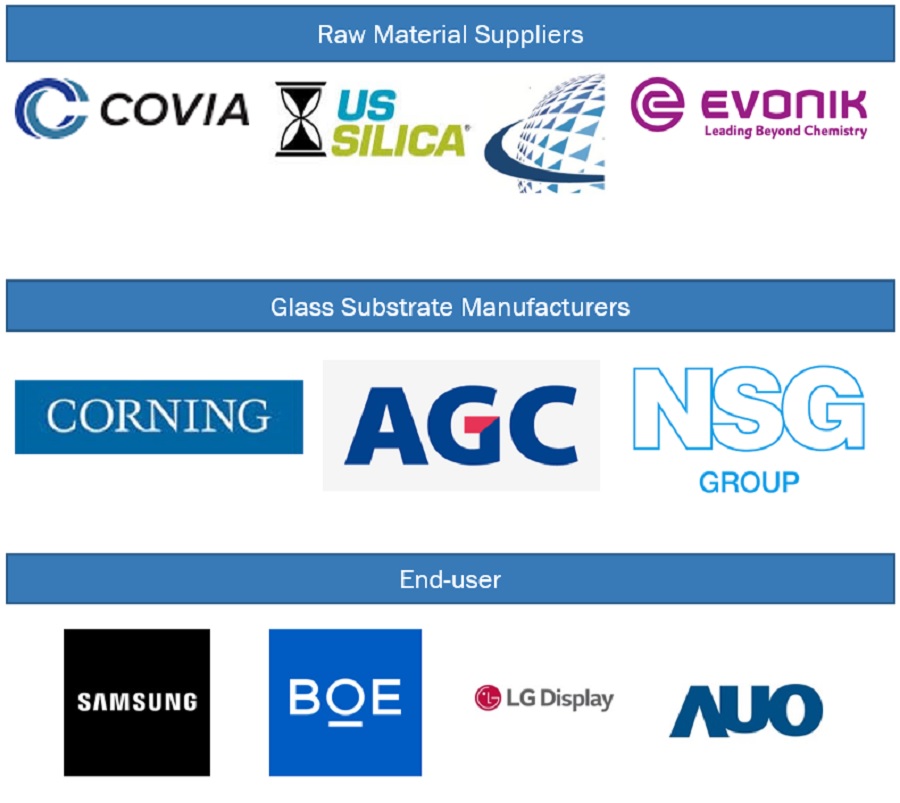
Key stakeholders steering the trajectory of the glass substrate market include AGC Inc. (Japan), Schott (Germany), Corning, Incorporated (US), Nippon Sheet Glass Co., Ltd. (Japan), Plan Optik AG (Germany), HOYA Corporation (Japan), Ohara Inc. (Japan), IRICO Group New Energy Company Limited (China), Toppan Inc. (Japan), Tunghsu Group Co. Ltd. (China). To solidify their positions in this competitive market, these industry frontrunners have judiciously employed a range of growth strategies. This encompasses acquisitions, diversifying their product lineup, geographical expansions, and forging productive partnerships, collaborations, and agreements. Through these strategic maneuvers, they aim to cater to the escalating demand for glass substrates, particularly from dynamic emerging markets.

Get online access to the report on the World's First Market Intelligence Cloud

  • Easy to Download Historical Data & Forecast Numbers
  • Company Analysis Dashboard for high growth potential opportunities
  • Research Analyst Access for customization & queries
  • Competitor Analysis with Interactive dashboard
  • Latest News, Updates & Trend analysis
Request Sample

Scope of the Report

:

Report Metric

Details

Years Considered

2019–2028

Base year

2022

Forecast period

2023–2028

Unit considered 

Value (USD Million/Billion)

Segments

Type, End-Use Industry, and Region

Regions

Asia-Pacific, North America, Europe, South America, and Middle East & Africa.

Companies

The major players are AGC Inc. (Japan), Schott (Germany), Corning Incorporated (US), Nippon Sheet Glass Co., Ltd. (Japan), HOYA Corporation (Japan) and others are covered in the Glass substrate market.

This research report categorizes the global Glass substrate market on the basis of Type, End-use Industries, and Region.

Glass substrate Market, By Type
  • Borosilicate-based glass substrates
  • Silicon-based glass substrates
  • Ceramic-based glass substrates
  • Fused silica-/quartz-based glass substrates
  • Other Types
Glass substrate Market, By End-Use Industries
  • Automotive
  • Electronics
  • Medical
  • Aerospace & Defense
  • Solar Power
Glass substrate Market, By Region
  • Asia Pacific (APAC)
  • North America
  • Europe
  • South America
  • Middle East & Africa

The market has been further analyzed for the key countries in each of these regions.

Recent Developments

  • In December 2023, Schott (Germany) has invested in expanding the research and development site, in Landshut.
  • In November 2023, Nippon Sheet Glass Co., Ltd. (Japan) has announced its plans to invest in additional TCO (transparent conductive oxide) glass production capacity in the United States. to support the growing solar market.
  • In November 2023, Nippon Sheet Glass Co., Ltd. (Japan) has announced the opening of new production plant of solar glass in Malaysia
  • In September 2023, Schott (Germany) has announced a three-point action plan to address the chip industry's needs for glass-substrate-based advanced chip packaging.
  • In May 2023, Corning Incorporated (US) has announced a 20% increment in the prices of display glass substrate
  • In February 2023, AGC Inc. (Japan) has partnered with Saint-Gobain, to design a pilot breakthrough flat glass line that is expected to reduce very significantly direct CO2 emissions.
  • In January 2023, AGC Inc. (Japan) has developed a CADTANK Online Computation and Optimization Assistant (a digital twin technology), used for the glass melting process.
  • In January 2022, Schott (Germany) has introduced, FLEXINITY connect, an ultra-fine structured glass that brings a game-changing element to semiconductor manufacturing, which has traditionally used printed circuit boards (PCB) and silicon interposers for advanced chip packaging solutions.
  • In June 2022, Schott (Germany) has inaugurated a new flat glass, state-of-the-art production plant in Bolu, Turkey
  • In December 2022, Nippon Sheet Glass Co., Ltd. (Japan) has announced the establishment of the Second Research Building, in its Technical Research Laboratory of Japan.

Frequently Asked Questions (FAQ):

To speak to our analyst for a discussion on the above findings, click Speak to Analyst

TABLE OF CONTENTS
 
1 INTRODUCTION (Page No. - 18)
    1.1 STUDY OBJECTIVES 
    1.2 MARKET DEFINITION 
           1.2.1 INCLUSIONS AND EXCLUSIONS
    1.3 MARKET SCOPE 
          FIGURE 1 GLASS SUBSTRATE MARKET SEGMENTATION
           1.3.1 REGIONS COVERED
           1.3.2 YEARS CONSIDERED
    1.4 CURRENCY 
    1.5 STAKEHOLDERS 
    1.6 LIMITATIONS 
    1.7 SUMMARY OF CHANGES 
 
2 RESEARCH METHODOLOGY (Page No. - 22)
    2.1 RESEARCH DATA 
          FIGURE 2 GLASS SUBSTRATE MARKET: RESEARCH DESIGN
    2.2 MARKET SIZE ESTIMATION 
          FIGURE 3 MARKET SIZE ESTIMATION: SUPPLY-SIDE ANALYSIS
           2.2.1 APPROACH – 2
                    FIGURE 4 GLASS SUBSTRATE MARKET: SECOND APPROACH
    2.3 DATA TRIANGULATION 
           2.3.1 SECONDARY DATA
           2.3.2 PRIMARY DATA
                    FIGURE 5 DATA TRIANGULATION
    2.4 KEY MARKET INSIGHTS 
          FIGURE 6 LIST OF STAKEHOLDERS INVOLVED AND BREAKDOWN OF INTERVIEWS  WITH EXPERTS
    2.5 RECESSION IMPACT 
    2.6 RESEARCH ASSUMPTIONS & LIMITATIONS 
           2.6.1 ASSUMPTIONS
                    FIGURE 7 LIMITATIONS
    2.7 LIMITATIONS 
           2.7.1 RISK ASSESSMENT
                    TABLE 1 LIMITATIONS & ASSOCIATED RISKS
    2.8 GROWTH RATE ASSUMPTIONS 
 
3 EXECUTIVE SUMMARY (Page No. - 29)
    FIGURE 8 BOROSILICATE-BASED GLASS SUBSTRATE TO LEAD MARKET  DURING FORECAST PERIOD
    FIGURE 9 ELECTRONICS TO BE LARGER END-USE SEGMENT THROUGH 2028
    FIGURE 10 ASIA PACIFIC TO BE FASTEST-GROWING REGION IN FORECAST PERIOD
 
4 PREMIUM INSIGHTS (Page No. - 32)
    4.1 ATTRACTIVE OPPORTUNITIES FOR PLAYERS IN  GLASS SUBSTRATE MARKET 
          FIGURE 11 DEVELOPING COUNTRIES OFFER ATTRACTIVE OPPORTUNITIES IN GLASS SUBSTRATE MARKET
    4.2 ASIA PACIFIC: GLASS SUBSTRATE, TYPE AND COUNTRY 
          FIGURE 12 ASIA PACIFIC: CHINA WAS LARGEST GLASS SUBSTRATE MARKET IN 2022
    4.3 GLASS SUBSTRATE MARKET, BY TYPE 
          FIGURE 13 BOROSILICATE-BASED GLASS SUBSTRATE SEGMENT TO LEAD MARKET DURING FORECAST PERIOD
    4.4 GLASS SUBSTRATE MARKET, BY END-USE INDUSTRY 
          FIGURE 14 ELECTRONICS TO LEAD MARKET DURING FORECAST PERIOD
    4.5 GLASS SUBSTRATE MARKET, BY COUNTRY 
          FIGURE 15 INDIA GLASS SUBSTRATE MARKET TO RECORD HIGHEST CAGR FROM  2023 TO 2028
 
5 MARKET OVERVIEW (Page No. - 35)
    5.1 INTRODUCTION 
    5.2 MARKET DYNAMICS 
          FIGURE 16 DRIVERS, RESTRAINTS, OPPORTUNITIES, AND CHALLENGES IN GLASS SUBSTRATE MARKET
           5.2.1 DRIVERS
                    5.2.1.1 Rising use of LCDs in consumer electronics and automotive applications
                    5.2.1.2 Growing semiconductor industry
                                FIGURE 17 GLOBAL SEMICONDUCTOR SALES, 2018–2022
           5.2.2 RESTRAINTS
                    5.2.2.1 High technology development and manufacturing cost
           5.2.3 OPPORTUNITIES
                    5.2.3.1 Innovations in display technologies
                    5.2.3.2 Growing use of glass substrates in solar power application
                                FIGURE 18 COUNTRY-WISE SOLAR ENERGY SHARE, 2022
           5.2.4 CHALLENGES
                    5.2.4.1 LCD glass to meet strict quality requirements
 
6 INDUSTRY TRENDS (Page No. - 39)
    6.1 PORTER’S FIVE FORCES ANALYSIS 
          FIGURE 19 PORTER’S FIVE FORCES ANALYSIS
          TABLE 2 GLASS SUBSTRATE MARKET: PORTER’S FIVE FORCES ANALYSIS
           6.1.1 THREAT OF NEW ENTRANTS
           6.1.2 THREAT OF SUBSTITUTES
           6.1.3 BARGAINING POWER OF SUPPLIERS
           6.1.4 BARGAINING POWER OF BUYERS
           6.1.5 INTENSITY OF COMPETITIVE RIVALRY
    6.2 SUPPLY CHAIN ANALYSIS 
    6.3 VALUE CHAIN ANALYSIS 
          FIGURE 20 GLASS SUBSTRATE: VALUE CHAIN ANALYSIS
    6.4 KEY MARKETS FOR IMPORT AND EXPORT (TRADE ANALYSIS) 
           6.4.1 EXPORT SCENARIO OF GLASS SUBSTRATES
                    FIGURE 21 FLOAT GLASS AND SURFACE GROUND OR POLISHED GLASS, IN SHEETS (7005) EXPORTS, BY KEY COUNTRY, 2018–2022 (USD BILLION)
           6.4.2 IMPORT SCENARIO OF GLASS SUBSTRATES
                    FIGURE 22 FLOAT GLASS AND SURFACE GROUND OR POLISHED GLASS, IN SHEETS (7005) EXPORTS, BY KEY COUNTRY, 2018–2022 (USD BILLION)
    6.5 MACROECONOMIC OVERVIEW 
           6.5.1 GLOBAL GDP OUTLOOK
                    TABLE 3 WORLD GDP GROWTH PROJECTION, 2019–2026 (USD BILLION)
    6.6 PRICING ANALYSIS 
           6.6.1 INDICATIVE PRICING ANALYSIS FOR GLASS SUBSTRATES, BY REGION
                    TABLE 4 INDICATIVE PRICING ANALYSIS OF GLASS SUBSTRATES, BY REGION,  2021–2028 (USD/UNIT)
    6.7 TECHNOLOGY ANALYSIS 
    6.8 TRENDS/DISRUPTIONS IMPACTING CUSTOMER’S BUSINESS 
          FIGURE 23 GROWING CONCERN FOR SUSTAINABILITY, TECHNOLOGICAL ADVANCEMENTS TO BRING IN CHANGE IN FUTURE REVENUE MIX
    6.9 TARIFF AND REGULATORY LANDSCAPE 
           6.9.1 TARIFF RELATED TO GLASS SUBSTRATE MARKET
           6.9.2 REGULATORY BODIES, GOVERNMENT AGENCIES, AND OTHER ORGANIZATIONS
                    TABLE 5 NORTH AMERICA: LIST OF REGULATORY BODIES, GOVERNMENT AGENCIES, AND OTHER ORGANIZATIONS
                    TABLE 6 EUROPE: LIST OF REGULATORY BODIES, GOVERNMENT AGENCIES, AND OTHER ORGANIZATIONS
                    TABLE 7 ASIA PACIFIC: LIST OF REGULATORY BODIES, GOVERNMENT AGENCIES, AND OTHER ORGANIZATIONS
                    TABLE 8 MIDDLE EAST AND AFRICA: LIST OF REGULATORY BODIES, GOVERNMENT AGENCIES, AND OTHER ORGANIZATIONS
                    TABLE 9 SOUTH AMERICA: LIST OF REGULATORY BODIES, GOVERNMENT AGENCIES, AND OTHER ORGANIZATIONS
    6.10 CASE STUDY ANALYSIS 
           6.10.1 SAFE TRANSPORT CONTAINERS FOR SCHOTT TELESCOPE MIRROR SUBSTRATE
                    6.10.1.1 Introduction
                    6.10.1.2 Challenge
                    6.10.1.3 Solution
    6.11 KEY CONFERENCES & EVENTS, 2022–2023 
           TABLE 10 GLASS SUBSTRATE MARKET: DETAILED LIST OF CONFERENCES & EVENTS
    6.12 ECOSYSTEM/MARKET MAP 
           TABLE 11 GLASS SUBSTRATE MARKET: ECOSYSTEM
           FIGURE 24 ECOSYSTEM MAP
    6.13 KEY STAKEHOLDERS & BUYING CRITERIA 
           6.13.1 KEY STAKEHOLDERS IN BUYING PROCESS
                     FIGURE 25 INFLUENCE OF STAKEHOLDERS ON BUYING PROCESS FOR APPLICATIONS
                     TABLE 12 INFLUENCE OF STAKEHOLDERS IN BUYING PROCESS FOR END-USE INDUSTRIES (%)
           6.13.2 BUYING CRITERIA
                     FIGURE 26 KEY BUYING CRITERIA FOR END-USE INDUSTRIES
                     TABLE 13 KEY BUYING CRITERIA FOR GLASS SUBSTRATE FOR END-USE INDUSTRIES
    6.14 PATENT ANALYSIS 
           6.14.1 INTRODUCTION
                     FIGURE 27 NUMBER OF PATENTS GRANTED FOR GLASS SUBSTRATES (2013–2023)
                     FIGURE 28 REGIONAL ANALYSIS OF PATENT GRANTED FOR GLASS SUBSTRATES,  2013–2023
                     TABLE 14 LIST OF A FEW PATENTS IN GLASS SUBSTRATE MARKET, 2022–2023
 
7 GLASS SUBSTRATE MARKET, BY TYPE (Page No. - 61)
    7.1 INTRODUCTION 
          FIGURE 29 BOROSILICATE-BASED GLASS SUBSTRATE TO DOMINATE MARKET IN 2023
          TABLE 15 GLASS SUBSTRATE MARKET, BY TYPE, 2019–2021 (USD MILLION)
          TABLE 16 GLASS SUBSTRATE MARKET, BY TYPE, 2022–2028 (USD MILLION)
    7.2 BOROSILICATE-BASED GLASS SUBSTRATES 
           7.2.1 ADVANTAGEOUS PROPERTIES OF GLASS SUBSTRATES TO DRIVE DEMAND
                    TABLE 17 BOROSILICATE-BASED GLASS SUBSTRATE MARKET, BY REGION,  2019–2021 (USD MILLION)
                    TABLE 18 BOROSILICATE-BASED GLASS SUBSTRATE MARKET, BY REGION,  2022–2028 (USD MILLION)
    7.3 SILICON-BASED GLASS SUBSTRATES 
           7.3.1 MECHANICAL SUPPORT FOR INTEGRATED CIRCUITS TO SUPPORT GROWTH
                    TABLE 19 SILICON-BASED GLASS SUBSTRATE MARKET, BY REGION, 2019–2021 (USD MILLION)
                    TABLE 20 SILICON-BASED GLASS SUBSTRATE MARKET, BY REGION, 2022–2028 (USD MILLION)
    7.4 CERAMIC-BASED GLASS SUBSTRATES 
           7.4.1 ABILITY TO WITHSTAND THERMAL SHOCKS TO DRIVE DEMAND
                    TABLE 21 CERAMIC-BASED GLASS SUBSTRATE MARKET, BY REGION, 2019–2021 (USD MILLION)
                    TABLE 22 CERAMIC-BASED GLASS SUBSTRATE MARKET, BY REGION, 2022–2028 (USD MILLION)
    7.5 FUSED SILICA-/QUARTZ-BASED GLASS SUBSTRATES 
           7.5.1 GOOD THERMAL SHOCK RESISTANCE TO DRIVE DEMAND
                    TABLE 23 FUSED SILICA/QUARTZ-BASED GLASS SUBSTRATE MARKET, BY REGION,  2019–2021 (USD MILLION)
                    TABLE 24 FUSED SILICA/QUARTZ -BASED GLASS SUBSTRATE MARKET, BY REGION,  2022–2028 (USD MILLION)
    7.6 OTHER TYPES 
          TABLE 25 OTHER GLASS SUBSTRATES MARKET, BY REGION, 2019–2021 (USD MILLION)
          TABLE 26 OTHER GLASS SUBSTRATES MARKET, BY REGION, 2022–2028 (USD MILLION)
 
8 GLASS SUBSTRATE MARKET, BY END-USE INDUSTRY (Page No. - 69)
    8.1 INTRODUCTION 
          FIGURE 30 ELECTRONICS TO ACCOUNT FOR LARGEST MARKET SHARE IN 2023
          TABLE 27 GLASS SUBSTRATE MARKET, BY END-USE INDUSTRY, 2019–2021 (USD MILLION)
          TABLE 28 GLASS SUBSTRATE MARKET, BY END-USE INDUSTRY, 2022–2028 (USD MILLION)
    8.2 ELECTRONICS 
           8.2.1 INCREASING DEMAND FOR ELECTRONICS PRODUCTS TO DRIVE DEMAND
                    TABLE 29 GLASS SUBSTRATE MARKET IN ELECTRONICS END-USE INDUSTRY, BY REGION,  2019–2021 (USD MILLION)
                    TABLE 30 GLASS SUBSTRATE MARKET IN ELECTRONICS END-USE INDUSTRY, BY REGION, 2022–2028 (USD MILLION)
    8.3 AUTOMOTIVE 
           8.3.1 RISING DEMAND FOR ELECTRIC VEHICLES TO DRIVE DEMAND
                    TABLE 31 GLASS SUBSTRATE MARKET IN AUTOMOTIVE END-USE INDUSTRY, BY REGION,  2019–2021 (USD MILLION)
                    TABLE 32 GLASS SUBSTRATE MARKET IN AUTOMOTIVE END-USE INDUSTRY, BY REGION,  2022–2028 (USD MILLION)
    8.4 MEDICAL 
           8.4.1 GROWING MEDICAL DEVICE INDUSTRY TO DRIVE DEMAND
                    TABLE 33 GLASS SUBSTRATE MARKET IN MEDICAL END-USE INDUSTRY, BY REGION,  2019–2021 (USD MILLION)
                    TABLE 34 GLASS SUBSTRATE MARKET IN MEDICAL END-USE INDUSTRY, BY REGION, 2022–2028 (USD MILLION)
    8.5 AEROSPACE & DEFENSE 
           8.5.1 HIGH OPTICAL CLARITY AND RESISTANCE TO ENVIRONMENTAL FACTORS TO DRIVE DEMAND
                    TABLE 35 GLASS SUBSTRATE MARKET IN AEROSPACE AND DEFENSE END-USE INDUSTRY,  BY REGION, 2019–2021 (USD MILLION)
                    TABLE 36 GLASS SUBSTRATE MARKET IN AEROSPACE AND DEFENSE END-USE INDUSTRY,  BY REGION, 2022–2028 (USD MILLION)
    8.6 SOLAR POWER 
           8.6.1 RAISING CONCERN FOR CLIMATE CHANGE AND ENVIRONMENTAL ISSUES TO DRIVE DEMAND
                    TABLE 37 GLASS SUBSTRATE MARKET IN SOLAR POWER END-USE INDUSTRY, BY REGION,  2019–2021 (USD MILLION)
                    TABLE 38 GLASS SUBSTRATE MARKET IN SOLAR POWER END-USE INDUSTRY, BY REGION,  2022–2028 (USD MILLION)
 
9 GLASS SUBSTRATE MARKET, BY REGION (Page No. - 77)
    9.1 INTRODUCTION 
          FIGURE 31 GLASS SUBSTRATE MARKET GROWTH RATE, BY COUNTRY, 2023–2028
          TABLE 39 GLASS SUBSTRATE MARKET, BY REGION, 2019–2021 (USD MILLION)
          TABLE 40 GLASS SUBSTRATE MARKET, BY REGION, 2022–2028 (USD MILLION)
    9.2 NORTH AMERICA 
           9.2.1 RECESSION IMPACT
                    TABLE 41 NORTH AMERICA: GLASS SUBSTRATE MARKET, BY COUNTRY, 2019–2021 (USD MILLION)
                    TABLE 42 NORTH AMERICA: GLASS SUBSTRATE MARKET, BY COUNTRY, 2022–2028 (USD MILLION)
                    TABLE 43 NORTH AMERICA: GLASS SUBSTRATE MARKET, BY TYPE, 2019–2021 (USD MILLION)
                    TABLE 44 NORTH AMERICA: GLASS SUBSTRATE MARKET, BY TYPE, 2022–2028 (USD MILLION)
                    TABLE 45 NORTH AMERICA: GLASS SUBSTRATE MARKET, BY END-USE INDUSTRY,  2019–2021 (USD MILLION)
                    TABLE 46 NORTH AMERICA: GLASS SUBSTRATE MARKET, BY END-USE INDUSTRY,  2022–2028 (USD MILLION)
           9.2.2 US
                    9.2.2.1 Growing semiconductor and automotive industries to drive demand
                                TABLE 47 US: GLASS SUBSTRATE MARKET, BY TYPE, 2019–2021 (USD MILLION)
                                TABLE 48 US: GLASS SUBSTRATE MARKET, BY TYPE, 2022–2028 (USD MILLION)
                                TABLE 49 US: GLASS SUBSTRATE MARKET, BY END-USE INDUSTRY, 2019–2021 (USD MILLION)
                                TABLE 50 US: GLASS SUBSTRATE MARKET, BY END-USE INDUSTRY, 2022–2028 (USD MILLION)
           9.2.3 CANADA
                    9.2.3.1 Rising solar and automotive industries to drive demand
                                TABLE 51 CANADA: GLASS SUBSTRATE MARKET, BY TYPE, 2019–2021 (USD MILLION)
                                TABLE 52 CANADA: GLASS SUBSTRATE MARKET, BY TYPE, 2022–2028 (USD MILLION)
                                TABLE 53 CANADA: GLASS SUBSTRATE MARKET, BY END-USE INDUSTRY,  2019–2021 (USD MILLION)
                                TABLE 54 CANADA: GLASS SUBSTRATE MARKET, BY END-USE INDUSTRY,  2022–2028 (USD MILLION)
           9.2.4 MEXICO
                    9.2.4.1 Increasing automotive industry to grow market
                                TABLE 55 MEXICO: GLASS SUBSTRATE MARKET, BY TYPE, 2019–2021 (USD MILLION)
                                TABLE 56 MEXICO: GLASS SUBSTRATE MARKET, BY TYPE, 2022–2028 (USD MILLION)
                                TABLE 57 MEXICO: GLASS SUBSTRATE MARKET, BY END-USE INDUSTRY,  2019–2021 (USD MILLION)
                                TABLE 58 MEXICO: GLASS SUBSTRATE MARKET, BY END-USE INDUSTRY,  2022–2028 (USD MILLION)
    9.3 ASIA PACIFIC 
           9.3.1 RECESSION IMPACT
                    FIGURE 32 ASIA PACIFIC: MARKET SNAPSHOT
                    TABLE 59 ASIA PACIFIC: GLASS SUBSTRATE MARKET, BY COUNTRY, 2019–2021 (USD MILLION)
                    TABLE 60 ASIA PACIFIC: GLASS SUBSTRATE MARKET, BY COUNTRY, 2022–2028 (USD MILLION)
                    TABLE 61 ASIA PACIFIC: GLASS SUBSTRATE MARKET, BY TYPE, 2019–2021 (USD MILLION)
                    TABLE 62 ASIA PACIFIC: GLASS SUBSTRATE MARKET, BY TYPE, 2022–2028 (USD MILLION)
                    TABLE 63 ASIA PACIFIC: GLASS SUBSTRATE MARKET, BY END-USE INDUSTRY,  2019–2021 (USD MILLION)
                    TABLE 64 ASIA PACIFIC: GLASS SUBSTRATE MARKET, BY END-USE INDUSTRY,  2022–2028 (USD MILLION)
           9.3.2 CHINA
                    9.3.2.1 Government subsidies for semiconductor manufacturers to drive market
           9.3.3 INDIA
                    9.3.3.1 Rising medical device and automotive industry to increase demand
                                TABLE 65 INDIA: GLASS SUBSTRATE MARKET, BY TYPE, 2019–2021 (USD MILLION)
                                TABLE 66 INDIA: GLASS SUBSTRATE MARKET, BY TYPE, 2022–2028 (USD MILLION)
                                TABLE 67 INDIA: GLASS SUBSTRATE MARKET, BY END-USE INDUSTRY, 2019–2021 (USD MILLION)
                                TABLE 68 INDIA: GLASS SUBSTRATE MARKET, BY END-USE INDUSTRY, 2022–2028 (USD MILLION)
           9.3.4 JAPAN
                    9.3.4.1 Growing automotive and semiconductor industries to support market
                                TABLE 69 JAPAN: GLASS SUBSTRATE MARKET, BY TYPE, 2019–2021 (USD MILLION)
                                TABLE 70 JAPAN: GLASS SUBSTRATE MARKET, BY TYPE, 2022–2028 (USD MILLION)
                                TABLE 71 JAPAN: GLASS SUBSTRATE MARKET, BY END-USE INDUSTRY, 2019–2021 (USD MILLION)
                                TABLE 72 JAPAN: GLASS SUBSTRATE MARKET, BY END-USE INDUSTRY, 2022–2028 (USD MILLION)
           9.3.5 SOUTH KOREA
                    9.3.5.1 Growing electric vehicle market and government initiatives to drive demand
                                TABLE 73 SOUTH KOREA: GLASS SUBSTRATE MARKET, BY TYPE, 2019–2021 (USD MILLION)
                                TABLE 74 SOUTH KOREA: GLASS SUBSTRATE MARKET, BY TYPE, 2022–2028 (USD MILLION)
                                TABLE 75 SOUTH KOREA: GLASS SUBSTRATE MARKET, BY END-USE INDUSTRY,  2019–2021 (USD MILLION)
                                TABLE 76 SOUTH KOREA: GLASS SUBSTRATE MARKET, BY END-USE INDUSTRY,  2022–2028 (USD MILLION)
           9.3.6 TAIWAN
                    9.3.6.1 Growing semiconductor industry to drive market
                                TABLE 77 TAIWAN: GLASS SUBSTRATE MARKET, BY TYPE, 2019–2021 (USD MILLION)
                                TABLE 78 TAIWAN: GLASS SUBSTRATE MARKET, BY TYPE, 2022–2028 (USD MILLION)
                                TABLE 79 TAIWAN: GLASS SUBSTRATE MARKET, BY END-USE INDUSTRY,  2019–2021 (USD MILLION)
                                TABLE 80 TAIWAN: GLASS SUBSTRATE MARKET, BY END-USE INDUSTRY,  2022–2028 (USD MILLION)
           9.3.7 REST OF ASIA PACIFIC
                    TABLE 81 REST OF ASIA PACIFIC: GLASS SUBSTRATE MARKET, BY TYPE, 2019–2021 (USD MILLION)
                    TABLE 82 REST OF ASIA PACIFIC: GLASS SUBSTRATE MARKET, BY TYPE, 2022–2028 (USD MILLION)
                    TABLE 83 REST OF ASIA PACIFIC: GLASS SUBSTRATE MARKET, BY END-USE INDUSTRY,  2019–2021 (USD MILLION)
                    TABLE 84 REST OF ASIA PACIFIC: GLASS SUBSTRATE MARKET, BY END-USE INDUSTRY,  2022–2028 (USD MILLION)
    9.4 EUROPE 
           9.4.1 RECESSION IMPACT
                    FIGURE 33 EUROPE: MARKET SNAPSHOT
                    TABLE 85 EUROPE: GLASS SUBSTRATE MARKET, BY COUNTRY, 2019–2021 (USD MILLION)
                    TABLE 86 EUROPE: GLASS SUBSTRATE MARKET, BY COUNTRY, 2022–2028 (USD MILLION)
                    TABLE 87 EUROPE: GLASS SUBSTRATE MARKET, BY TYPE, 2019–2021 (USD MILLION)
                    TABLE 88 EUROPE: GLASS SUBSTRATE MARKET, BY TYPE, 2022–2028 (USD MILLION)
                    TABLE 89 EUROPE: GLASS SUBSTRATE MARKET, BY END-USE INDUSTRY,  2019–2021 (USD MILLION)
                    TABLE 90 EUROPE: GLASS SUBSTRATE MARKET, BY END-USE INDUSTRY,  2022–2028 (USD MILLION)
           9.4.2 GERMANY
                    9.4.2.1 Growing end-use industries to drive demand
                                TABLE 91 GERMANY: GLASS SUBSTRATE MARKET, BY TYPE, 2019–2021 (USD MILLION)
                                TABLE 92 GERMANY: GLASS SUBSTRATE MARKET, BY TYPE, 2022–2028 (USD MILLION)
                                TABLE 93 GERMANY: GLASS SUBSTRATE MARKET, BY END-USE INDUSTRY,  2019–2021 (USD MILLION)
                                TABLE 94 GERMANY: GLASS SUBSTRATE MARKET, BY END-USE INDUSTRY,  2022–2028 (USD MILLION)
           9.4.3 UK
                    9.4.3.1 Government initiatives to provide growth opportunities
                                TABLE 95 UK: GLASS SUBSTRATE MARKET, BY TYPE, 2019–2021 (USD MILLION)
                                TABLE 96 UK: GLASS SUBSTRATE MARKET, BY TYPE, 2022–2028 (USD MILLION)
                                TABLE 97 UK: GLASS SUBSTRATE MARKET, BY END-USE INDUSTRY, 2019–2021 (USD MILLION)
                                TABLE 98 UK: GLASS SUBSTRATE MARKET, BY END-USE INDUSTRY, 2022–2028 (USD MILLION)
           9.4.4 FRANCE
                    9.4.4.1 Government initiatives and growing automotive industry to drive demand
                                TABLE 99 FRANCE: GLASS SUBSTRATE MARKET, BY TYPE, 2019–2021 (USD MILLION)
                                TABLE 100 FRANCE: GLASS SUBSTRATE MARKET, BY TYPE, 2022–2028 (USD MILLION)
                                TABLE 101 FRANCE: GLASS SUBSTRATE MARKET, BY END-USE INDUSTRY,  2019–2021 (USD MILLION)
                                TABLE 102 FRANCE: GLASS SUBSTRATE MARKET, BY END-USE INDUSTRY,  2022–2028 (USD MILLION)
           9.4.5 ITALY
                    9.4.5.1 Growing solar power industry to drive market
                                TABLE 103 ITALY: GLASS SUBSTRATE MARKET, BY TYPE, 2019–2021 (USD MILLION)
                                TABLE 104 ITALY: GLASS SUBSTRATE MARKET, BY TYPE, 2022–2028 (USD MILLION)
                                TABLE 105 ITALY: GLASS SUBSTRATE MARKET, BY END-USE INDUSTRY, 2019–2021 (USD MILLION)
                                TABLE 106 ITALY: GLASS SUBSTRATE MARKET, BY END-USE INDUSTRY, 2022–2028 (USD MILLION)
           9.4.6 RUSSIA
                    9.4.6.1 Government investment to generate demand
                                TABLE 107 RUSSIA: GLASS SUBSTRATE MARKET, BY TYPE, 2019–2021 (USD MILLION)
                                TABLE 108 RUSSIA: GLASS SUBSTRATE MARKET, BY TYPE, 2022–2028 (USD MILLION)
                                TABLE 109 RUSSIA: GLASS SUBSTRATE MARKET, BY END-USE INDUSTRY,  2019–2021 (USD MILLION)
                                TABLE 110 RUSSIA: GLASS SUBSTRATE MARKET, BY END-USE INDUSTRY,  2022–2028 (USD MILLION)
           9.4.7 REST OF EUROPE
                    TABLE 111 REST OF EUROPE: GLASS SUBSTRATE MARKET, BY TYPE, 2019–2021 (USD MILLION)
                    TABLE 112 REST OF EUROPE: GLASS SUBSTRATE MARKET, BY TYPE, 2022–2028 (USD MILLION)
                    TABLE 113 REST OF EUROPE: GLASS SUBSTRATE MARKET, BY END-USE INDUSTRY, 2019–2021 (USD MILLION)
                    TABLE 114 REST OF EUROPE: GLASS SUBSTRATE MARKET, BY END-USE INDUSTRY, 2022–2028 (USD MILLION)
    9.5 SOUTH AMERICA 
           9.5.1 RECESSION IMPACT
                    TABLE 115 SOUTH AMERICA: GLASS SUBSTRATE MARKET, BY COUNTRY, 2019–2021 (USD MILLION)
                    TABLE 116 SOUTH AMERICA: GLASS SUBSTRATE MARKET, BY COUNTRY, 2022–2028 (USD MILLION)
                    TABLE 117 SOUTH AMERICA: GLASS SUBSTRATE MARKET, BY TYPE, 2019–2021 (USD MILLION)
                    TABLE 118 SOUTH AMERICA: GLASS SUBSTRATE MARKET, BY TYPE, 2022–2028 (USD MILLION)
                    TABLE 119 SOUTH AMERICA: GLASS SUBSTRATE MARKET, BY END-USE INDUSTRY,  2019–2021 (USD MILLION)
                    TABLE 120 SOUTH AMERICA: GLASS SUBSTRATE MARKET, BY END-USE INDUSTRY, 2022–2028 (USD MILLION)
           9.5.2 BRAZIL
                    9.5.2.1 Growing automotive industry and government initiatives to drive market
                                TABLE 121 BRAZIL: GLASS SUBSTRATE MARKET, BY TYPE, 2019–2021 (USD MILLION)
                                TABLE 122 BRAZIL: GLASS SUBSTRATE MARKET, BY TYPE, 2022–2028 (USD MILLION)
                                TABLE 123 BRAZIL: GLASS SUBSTRATE MARKET, BY END-USE INDUSTRY,  2019–2021 (USD MILLION)
                                TABLE 124 BRAZIL: GLASS SUBSTRATE MARKET, BY END-USE INDUSTRY,  2022–2028 (USD MILLION)
           9.5.3 ARGENTINA
                    9.5.3.1 Renewable energy initiatives and growing automotive industry to boost market
                                TABLE 125 ARGENTINA: GLASS SUBSTRATE MARKET, BY TYPE, 2019–2021 (USD MILLION)
                                TABLE 126 ARGENTINA: GLASS SUBSTRATE MARKET, BY TYPE, 2022–2028 (USD MILLION)
                                TABLE 127 ARGENTINA: GLASS SUBSTRATE MARKET, BY END-USE INDUSTRY,  2019–2021 (USD MILLION)
                                TABLE 128 ARGENTINA: GLASS SUBSTRATE MARKET, BY END-USE INDUSTRY,  2022–2028 (USD MILLION)
           9.5.4 REST OF SOUTH AMERICA
                    TABLE 129 REST OF SOUTH AMERICA: GLASS SUBSTRATE MARKET, BY TYPE, 2019–2021 (USD MILLION)
                    TABLE 130 REST OF SOUTH AMERICA: GLASS SUBSTRATE MARKET, BY TYPE,  2022–2028 (USD MILLION)
                    TABLE 131 REST OF SOUTH AMERICA: GLASS SUBSTRATE MARKET, BY END-USE INDUSTRY,  2019–2021 (USD MILLION)
                    TABLE 132 REST OF SOUTH AMERICA: GLASS SUBSTRATE MARKET, BY END-USE INDUSTRY,  2022–2028 (USD MILLION)
 
10 COMPETITIVE LANDSCAPE (Page No. - 124)
     10.1 OVERVIEW 
     10.2 OVERVIEW OF STRATEGIES ADOPTED  BY KEY GLASS SUBSTRATE PLAYERS 
     10.3 MARKET SHARE ANALYSIS 
             FIGURE 34 GLASS SUBSTRATE MARKET: MARKET SHARE ANALYSIS
             TABLE 133 GLASS SUBSTRATE MARKET: DEGREE OF COMPETITION
     10.4 REVENUE ANALYSIS OF TOP MARKET PLAYERS 
             FIGURE 35 REVENUE ANALYSIS FOR KEY COMPANIES IN GLASS SUBSTRATE MARKET IN PAST FIVE YEARS
     10.5 COMPANY EVALUATION MATRIX 
             10.5.1 STARS
             10.5.2 EMERGING LEADERS
             10.5.3 PERVASIVE PLAYERS
             10.5.4 PARTICIPANTS
                        FIGURE 36 COMPANY EVALUATION MATRIX, 2022
     10.6 COMPANY FOOTPRINT 
             FIGURE 37 GLASS SUBSTRATE MARKET: PRODUCT FOOTPRINT (25 COMPANIES)
             TABLE 134 GLASS SUBSTRATE MARKET: END-USE INDUSTRY FOOTPRINT (25 COMPANIES)
             TABLE 135 GLASS SUBSTRATE MARKET: REGIONAL FOOTPRINT (25 COMPANIES)
             TABLE 136 GLASS SUBSTRATE MARKET: COMPANY FOOTPRINT (25 COMPANIES)
     10.7 START-UPS/SMES EVALUATION MATRIX, 2022 
             10.7.1 PROGRESSIVE COMPANIES
             10.7.2 RESPONSIVE COMPANIES
             10.7.3 DYNAMIC COMPANIES
             10.7.4 STARTING BLOCKS
                        FIGURE 38 START-UPS/SMES EVALUATION MATRIX: GLASS SUBSTRATE MARKET, 2022
     10.8 COMPETITIVE BENCHMARKING 
             TABLE 137 GLASS SUBSTRATE MARKET: DETAILED LIST OF KEY START-UP/SMES
             TABLE 138 GLASS SUBSTRATE MARKET: COMPETITIVE BENCHMARKING OF KEY START-UP/SMES
     10.9 COMPETITIVE SCENARIO AND TRENDS 
             10.9.1 PRODUCT LAUNCHES
                        TABLE 139 PRODUCT LAUNCHES, 2019–2023
             10.9.2 DEALS
                        TABLE 140 DEALS, 2019–2023
 
11 COMPANY PROFILES (Page No. - 140)
     11.1 KEY PLAYERS 
(Business Overview, Products/Solutions/Services offered, Recent Developments, MnM View)*
             11.1.1 AGC INC.
                        TABLE 141 AGC INC.: COMPANY OVERVIEW
                        FIGURE 39 AGC INC.: COMPANY SNAPSHOT
                        TABLE 142 AGC INC.: DEALS
                        TABLE 143 AGC INC.: PRODUCT LAUNCHES
                        TABLE 144 AGC INC.: OTHERS
             11.1.2 SCHOTT AG
                        TABLE 145 SCHOTT AG: COMPANY OVERVIEW
                        FIGURE 40 SCHOTT AG: COMPANY SNAPSHOT
                        TABLE 146 SCHOTT AG: DEALS
                        TABLE 147 SCHOTT AG: PRODUCT LAUNCHES
                        TABLE 148 SCHOTT AG: OTHERS
             11.1.3 CORNING INCORPORATED
                        TABLE 149 CORNING INCORPORATED: COMPANY OVERVIEW
                        FIGURE 41 CORNING INCORPORATED: COMPANY SNAPSHOT
                        TABLE 150 CORNING INCORPORATED: DEALS
                        TABLE 151 CORNING INCORPORATED: PRODUCT LAUNCHES
                        TABLE 152 CORNING INCORPORATED: OTHERS
             11.1.4 NIPPON SHEET GLASS CO., LTD.
                        TABLE 153 NIPPON SHEET GLASS CO., LTD.: COMPANY OVERVIEW
                        FIGURE 42 NIPPON SHEET GLASS CO., LTD.: COMPANY SNAPSHOT
                        TABLE 154 NIPPON SHEET GLASS CO., LTD.: DEALS
                        TABLE 155 NIPPON SHEET GLASS CO., LTD.: PRODUCT LAUNCHES
                        TABLE 156 NIPPON SHEET GLASS CO., LTD.: OTHERS
             11.1.5 PLAN OPTIK AG
                        TABLE 157 PLAN OPTIK AG: COMPANY OVERVIEW
                        FIGURE 43 PLAN OPTIK AG: COMPANY SNAPSHOT
                        TABLE 158 PLAN OPTIK AG: DEALS
             11.1.6 HOYA CORPORATION
                        TABLE 159 HOYA CORPORATION: COMPANY OVERVIEW
                        FIGURE 44 HOYA CORPORATION: COMPANY SNAPSHOT
             11.1.7 OHARA INC.
                        TABLE 160 OHARA INC.: COMPANY OVERVIEW
                        FIGURE 45 OHARA INC.: COMPANY SNAPSHOT
             11.1.8 IRICO GROUP NEW ENERGY COMPANY LIMITED
                        TABLE 161 IRICO GROUP NEW ENERGY COMPANY LIMITED: COMPANY OVERVIEW
                        FIGURE 46 IRICO GROUP NEW ENERGY COMPANY LIMITED: COMPANY SNAPSHOT
             11.1.9 TOPPAN INC.
                        TABLE 162 TOPPAN INC.: COMPANY OVERVIEW
                        FIGURE 47 TOPPAN INC.: COMPANY SNAPSHOT
             11.1.10 TUNGHSU GROUP CO. LTD.
                        TABLE 163 TUNGHSU GROUP CO. LTD.: COMPANY OVERVIEW
             11.1.11 NIPPON ELECTRIC GLASS CO., LTD.
                        TABLE 164 NIPPON ELECTRIC GLASS CO., LTD.: COMPANY OVERVIEW
                        FIGURE 48 NIPPON ELECTRIC GLASS CO., LTD.: COMPANY SNAPSHOT
                        TABLE 165 NIPPON ELECTRIC GLASS CO., LTD.: DEALS
                        TABLE 166 NIPPON ELECTRIC GLASS CO., LTD.: PRODUCT LAUNCHES
     11.2 OTHER PLAYERS 
             11.2.1 SPECIALTY GLASS PRODUCTS
                        TABLE 167 SPECIALTY GLASS PRODUCTS: COMPANY OVERVIEW
             11.2.2 ABSOLICS INC.
                        TABLE 168 ABSOLICS INC.: COMPANY OVERVIEW
             11.2.3 BIOTAIN CRYSTAL CO., LIMITED
                        TABLE 169 BIOTAIN CRYSTAL CO., LIMITED: COMPANY OVERVIEW
             11.2.4 YATEKS
                        TABLE 170 YATEKS: COMPANY OVERVIEW
             11.2.5 VALLEY DESIGN CORP.
                        TABLE 171 VALLEY DESIGN CORP.: COMPANY OVERVIEW
             11.2.6 AVANSTRATE INC.
                        TABLE 172 AVANSTRATE INC.: COMPANY OVERVIEW
             11.2.7 KYODO INTERNATIONAL, INC.
                        TABLE 173 KYODO INTERNATIONAL, INC.: COMPANY OVERVIEW
             11.2.8 TAIWAN GLASS IND. CORP.
                        TABLE 174 TAIWAN GLASS IND. CORP.: COMPANY OVERVIEW
             11.2.9 GUARDIAN INDUSTRIES
                        TABLE 175 GUARDIAN INDUSTRIES: COMPANY OVERVIEW
             11.2.10 TECNISCO, LTD.
                        TABLE 176 TECNISCO, LTD.: COMPANY OVERVIEW
             11.2.11 ARRYAIT CORPORATION
                        TABLE 177 ARRYAIT CORPORATION: COMPANY OVERVIEW
             11.2.12 PRÄZISIONS GLAS & OPTIK GMBH
                        TABLE 178 PRÄZISIONS GLAS & OPTIK GMBH: COMPANY OVERVIEW
             11.2.13 JIANGSU SUCHUAN TECHNOLOGY CO., LTD.
                        TABLE 179 JIANGSU SUCHUAN TECHNOLOGY CO., LTD.: COMPANY OVERVIEW
             11.2.14 BUWON PRECISION SCIENCES CO., LTD.
                        TABLE 180 BUWON PRECISION SCIENCES CO., LTD.: COMPANY OVERVIEW
             11.2.15 VIRACON
                        TABLE 181 VIRACON: COMPANY OVERVIEW
 
*Details on Business Overview, Products/Solutions/Services offered, Recent Developments, MnM View might not be captured in case of unlisted companies.
 
12 ADJACENT MARKET (Page No. - 182)
     12.1 INTRODUCTION 
     12.2 DISPLAY MARKET 
             TABLE 182 DISPLAY MARKET, BY REGION, 2019–2022 (USD BILLION)
             TABLE 183 DISPLAY MARKET, BY REGION, 2023–2028 (USD BILLION)
 
13 APPENDIX (Page No. - 184)
     13.1 DISCUSSION GUIDE 
     13.2 KNOWLEDGESTORE: MARKETSANDMARKETS’  SUBSCRIPTION PORTAL 
     13.3 AVAILABLE CUSTOMIZATIONS 
     13.4 RELATED REPORTS 
     13.5 AUTHOR DETAILS 

This research involved the use of extensive secondary sources and databases, such as Factiva and Bloomberg, to identify and collect information useful for a technical and market-oriented study of the Glass substrate market. Primary sources included industry experts from related industries and preferred suppliers, manufacturers, distributors, technologists, standards & certification organizations, and organizations related to all segments of the value chain of this industry. In-depth interviews have been conducted with various primary respondents, such as key industry participants, subject matter experts (SMEs), executives of key companies, and industry consultants, to obtain and verify critical qualitative and quantitative information as well as to assess growth prospects.

Secondary Research

In the secondary research process, various sources such as annual reports, press releases, and investor presentations of companies; white papers; and publications from recognized websites and databases have been referred to for identifying and collecting information. Secondary research has been used to obtain key information about the industry's supply chain, the total pool of key players, market classification and segmentation according to the industry trends to the bottom-most level, regional markets, and key developments from both market- and technology-oriented perspectives.

Primary Research

The Glass substrate market comprises several stakeholders in the supply chain, which include suppliers, processors, and end-product users. Various primary sources from the supply and demand sides of the markets have been interviewed to obtain qualitative and quantitative information. The primary participants from the demand side include key opinion leaders, executives, managers, directors, and CEOs of companies in the Glass substrate market. Primary sources from the supply side include associations and institutions involved in the Glass substrate industry, key opinion leaders, and processing players.

Following is the breakdown of primary respondents
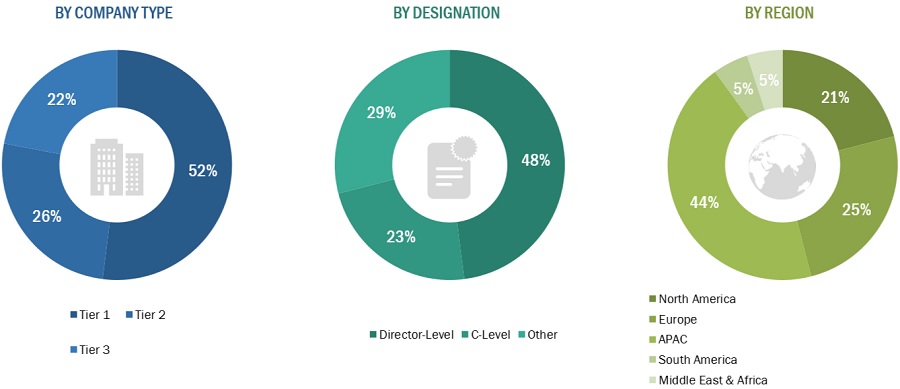
Glass Substrate Market Size, and Share

To know about the assumptions considered for the study, download the pdf brochure

Market Size Estimation

Both top-down and bottom-up approaches were used to estimate and validate the size of the global Glass substrate market. The research methodology used to estimate the market size includes the following:

  • The key players in the industry were identified through extensive secondary research.
  • The supply chain of the industry and market size, in terms of value, were determined through primary and secondary research.
  • All percentage shares split, and breakdowns were determined using secondary sources and verified through primary sources.
  • All possible parameters that affect the markets covered in this research study were accounted for, viewed in extensive detail, verified through primary research, and analyzed to obtain the final quantitative and qualitative data.
  • The research includes the study of reports, reviews, and newsletters of key industry players along with extensive interviews with key officials, such as directors and marketing executives.

Market Size Estimation: Bottom-Up Approach
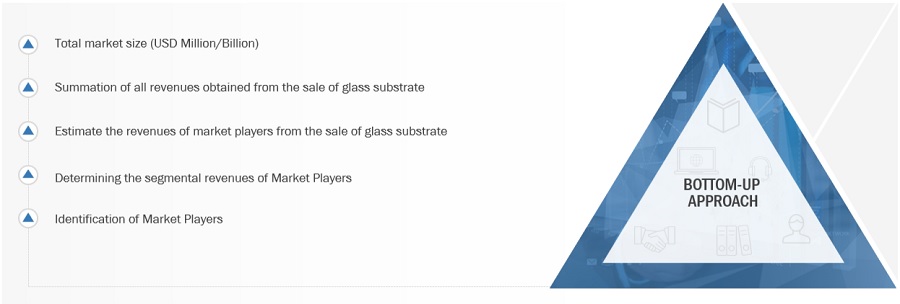
Glass Substrate Market Size, and Share

To know about the assumptions considered for the study, Request for Free Sample Report

Market Size Estimation: Top-Down Approach
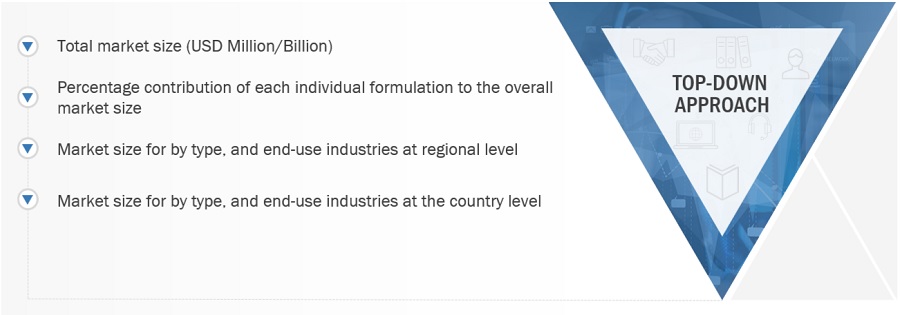
Glass Substrate Market Size, and Share

Data Triangulation

After arriving at the total market size from the estimation process explained above, the overall market was split into several segments and subsegments. To complete the overall market size estimation process and arrive at the exact statistics for all segments and subsegments, the data triangulation and market breakdown procedures have been employed, wherever applicable. The data have been triangulated by studying various factors and trends from both the demand and supply sides. In addition, the market size has been validated by using both the top-down and bottom-up approaches.

Market Definition

Glass substrates serve as thin, flat boards onto which a precise thin circuit is deposited. These substrates are crafted from various raw materials, including borosilicate, silicon, ceramic, fused silica/quartz, soda-lime, and aluminosilicate. They come in the form of disks and panels. Disk-shaped glass substrates, referred to as wafers, find primary applications in semiconductor manufacturing, while panel-shaped glass substrates are predominantly used in LCD manufacturing. The characteristics of glass substrates, such as shape, size, thickness, sharpness, and flexibility, are tailored to meet the specific requirements of their end-use industries, dictating their manufacturing processes accordingly.

Key Stakeholders

  • Material Suppliers and Producers
  • Regulatory Bodies
  • End User
  • Research and Development Organizations
  • Industrial Associations
  • Glass substrate manufacturers, dealers, traders, and suppliers.

Report Objectives

  • To define, describe, and forecast the global Glass substrate market in terms of value.
  • To provide insights regarding the significant factors influencing the growth of the market (drivers, restraints, opportunities, and challenges)
  • To analyze and forecast the market based on type, end-use industries, and region
  • To forecast the market size, in terms of value, with respect to five main regions: North America, Europe, Asia Pacific, South America, and Middle East & Africa.
  • To analyze the opportunities in the market for stakeholders and provide details of the competitive landscape.
  • To strategically profile key players in the market.
  • To analyze competitive developments in the market, such as new product launches, capacity expansions, and mergers & acquisitions.
  • To strategically profile the leading players and comprehensively analyze their key developments in the market.

Available Customizations:

Along with the given market data, MarketsandMarkets offers customizations as per the specific needs of the companies. The following customization options are available for the report:

Product Analysis:

  • Product Matrix which gives a detailed comparison of the product portfolio of each company

Regional Analysis:

  • Further breakdown of the Rest of the APAC Glass substrate market
  • Further breakdown of the Rest of Europe’s Glass substrate market

Company Information:

  • Detailed analysis and profiling of additional market players (up to 5)
Custom Market Research Services

We will customize the research for you, in case the report listed above does not meet with your exact requirements. Our custom research will comprehensively cover the business information you require to help you arrive at strategic and profitable business decisions.

Request Customization
Report Code
CH 5755
Published ON
Jan, 2024
Choose License Type
BUY NOW
  • SHARE
X
Request Customization
Speak to Analyst
Speak to Analyst
OR FACE-TO-FACE MEETING
PERSONALIZE THIS RESEARCH
  • Triangulate with your Own Data
  • Get Data as per your Format and Definition
  • Gain a Deeper Dive on a Specific Application, Geography, Customer or Competitor
  • Any level of Personalization
REQUEST A FREE CUSTOMIZATION
LET US HELP YOU!
  • What are the Known and Unknown Adjacencies Impacting the Glass Substrate Market
  • What will your New Revenue Sources be?
  • Who will be your Top Customer; what will make them switch?
  • Defend your Market Share or Win Competitors
  • Get a Scorecard for Target Partners
CUSTOMIZED WORKSHOP REQUEST
+1-888-600-6441
  • Call Us
  • +1-888-600-6441 (Corporate office hours)
  • +1-888-600-6441 (US/Can toll free)
  • +44-800-368-9399 (UK office hours)
CONNECT WITH US
ABOUT TRUST ONLINE
©2024 MarketsandMarkets Research Private Ltd. All rights reserved
DMCA.com Protection Status Website Feedback