Energy Recovery Ventilator Market by Technology Type (Plate Heat Exchanger, Heat Pipe Heat Exchanger, Rotary Heat Exchanger, Run-Around Coil), Application (Commercial, Residential), and Region (NA, EU, APAC, MEA, SA) - Global Forecast to 2022


[127 Pages report] Energy Recovery Ventilator Market size is projected to grow from USD 1.76 Billion in 2016 to USD 3.37 Billion by 2022, at a CAGR of 11.4% from 2017 to 2022.
The objectives of this study are:
- To define, describe, and forecast the energy recovery ventilator market based on technology type, application, and region in terms of value
- To forecast the size of the energy recovery ventilator market in terms of value for five key regions namely, Asia Pacific, North America, Europe, the Middle East & Africa, and South America, along with their respective key countries
- To strategically analyze micromarkets with respect to individual growth trends, future prospects, and contribution to the energy recovery ventilator market
- To analyze opportunities in the energy recovery ventilator market for the stakeholders and provide a competitive landscape for the market
- To strategically profile the key players operating in the energy recovery ventilator market and comprehensively analyze their core competencies
- To analyze competitive developments such as expansions, new product launches, and mergers & acquisitions adopted by the leading players in the energy recovery ventilator market
The years that have been considered for the study are as follows:
- Base Year � 2016
- Estimated Year � 2017
- Projected Year � 2022
- Forecast Period � 2017 to 2022
- For the company profiles in the report, 2016 has been considered the base year. In certain cases, wherein information is unavailable for the base year, the years prior to it have been considered.
Research Methodology
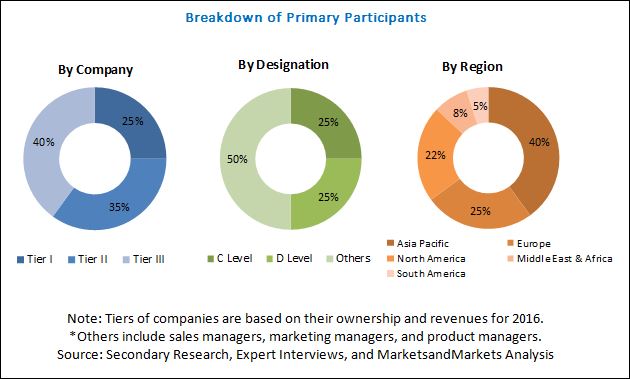
The research methodology that has been used to estimate and forecast the size of the energy recovery ventilator market begins with capturing data from the revenues of key vendors. This data has been obtained from various secondary sources such as Hoovers, Bloomberg, Factiva, and various other government and private websites. The offerings of vendors have been taken into consideration to determine the segmentation of the energy recovery ventilator market. After arriving at the overall market size, it has been split into several segments and subsegments, which have been later verified through primary research by conducting extensive interviews with key personnel such as chief executive officers, vice presidents, directors, and executives of the leading companies operating in the energy recovery ventilator market. Data triangulation and market breakdown procedures have been employed to complete the overall market engineering process and arrive at the exact statistics for all segments and subsegments of the energy recovery ventilator market. The breakdown of profiles of primaries has been depicted in the figure below.
To know about the assumptions considered for the study, download the pdf brochure
The energy recovery ventilator market has a diversified ecosystem of upstream players, which includes raw material suppliers, along with downstream stakeholders, vendors of energy recovery ventilators, end users, and government organizations. Mitsubishi Electric Corporation (Japan), Daikin (Japan), Panasonic Corporation (Japan), LG Electronics (South Korea), Johnson Controls (US), Munters (Sweden), FUJITSU GENERAL (Japan), Carrier Corporation (US), Nortek Air Solutions (US), and Greenheck Fan (US) are the key players operating in the energy recovery ventilator market.
Target Audience
- Manufacturers, Dealers, and Suppliers of Energy Recovery Ventilators
- Government Bodies
- End-use Industries
- Industry Associations
- Investment Banks
- Consulting Companies/Consultants in the Construction and Ventilation Sectors
�This study answers several questions for the stakeholders, primarily the market segments that they need to focus upon during the next two to five years, so that they can prioritize their efforts and investments accordingly.�
Scope of the Report: This research report categorizes the energy recovery ventilator market based on technology type, application, and region. It forecasts revenues as well as analyzes trends in each of the following submarkets.
Energy Recovery Ventilator Market, by Technology Type:
- Plate Heat Exchanger
- Heat Pipe Heat Exchanger
- Rotary Heat Exchanger
- Run-Around Coil
- Others (Thermosiphon and Twin Tower)
Energy Recovery Ventilator Market, by Application:
- Commercial
- Residential
- Others (Warehouses, Distribution Centers, and Industrial Space (Factories and Production Facilities)
Energy Recovery Ventilator Market, by Region:
- Asia Pacific
- North America
- Europe
- Middle East & Africa
- South America
The following customization options are available for the report:
With the given market data, MarketsandMarkets offers customizations as per the specific needs of companies. The following customization options are available for the report:
- Further breakdown of the Rest of Asia Pacific, Rest of Europe, and Rest of Middle East & Africa energy recovery ventilator market
- Detailed analysis and profiling of the additional market players (up to five)
- Further breakdown of the technology type segment of the energy recovery ventilator market based on application
The energy recovery ventilator market is projected to grow from USD 1.97 Billion in 2017 to USD 3.37 Billion by 2022, at a CAGR of 11.4% from 2017 to 2022. Increasing innovations in energy recovery ventilators to meet the customized ventilation requirements of various end users act as an opportunity for the growth of the energy recovery ventilator market across the globe.
Among technology types, the plate heat exchanger segment is expected to lead the energy recovery ventilator market during the forecast period. The increasing demand for plate heat exchangers from the commercial and residential sectors to manage, control, and monitor energy consumption in buildings is expected to drive the growth of the plate heat exchanger technology type segment of the energy recovery ventilator market from 2017 to 2022.
The commercial application segment is expected to lead the energy recovery ventilator market from 2017 to 2022. This segment of the market is also projected to grow at the highest CAGR during the forecast period. The growth of the commercial application segment of the energy recovery ventilator market can be attributed to the increasing use of these ventilators in commercial and residential applications. Moreover, rise in the number of green buildings, formulation and stringent implementation of various government regulations to reduce energy consumption in buildings, and increased demand for highly efficient energy recovery ventilators across the globe are also contributing to the growth of the commercial application segment of the market.
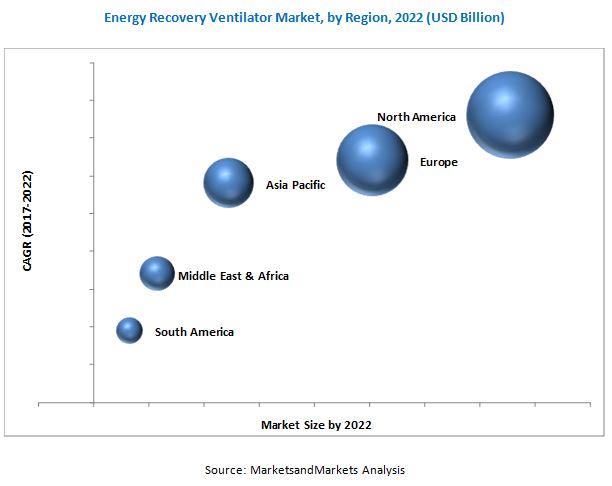
The North American region is the largest market for energy recovery ventilators across the globe. The growing demand for energy recovery ventilators from the residential and commercial sectors of the region is expected to fuel the growth of the North America energy recovery ventilator market during the forecast period.
Lack of awareness about benefits offered by energy recovery ventilators and high cost involved in the purchase, installation, and maintenance of energy recovery ventilators are the factors expected to inhibit the growth of the energy recovery ventilator market across the globe.
Mitsubishi Electric Corporation (Japan), Daikin (Japan), Panasonic Corporation (Japan), LG Electronics (South Korea), Johnson Controls (US), Munters (Sweden), FUJITSU GENERAL (Japan), Carrier Corporation (US), Nortek Air Solutions (US), and Greenheck Fan (US) are the leading players operating in the energy recovery ventilator market. These companies have adopted various strategies such as new product launches, expansions, and mergers & acquisitions to meet the growing demand for energy recovery ventilators as well as increase their market shares.
To speak to our analyst for a discussion on the above findings, click Speak to Analyst
Table of Contents
1 Introduction (Page No. - 14)
1.1 Objectives of the Study
1.2 Market Definition
1.3 Market Scope
1.3.1 Years Considered for the Study
1.4 Currency
1.5 Limitations
1.6 Stakeholders
2 Research Methodology (Page No. - 17)
2.1 Research Data
2.1.1 Secondary Data
2.1.1.1 Key Data From Secondary Sources
2.1.2 Primary Data
2.1.2.1 Key Data From Primary Sources
2.1.2.2 Key Industry Insights
2.1.2.3 Breakdown of Primary Interviews
2.2 Market Size Estimation
2.2.1 Bottom-Up Approach
2.2.2 Top-Down Approach
2.3 Data Triangulation
2.4 Assumptions
3 Executive Summary (Page No. - 25)
4 Premium Insights (Page No. - 28)
4.1 Attractive Market Opportunities in Energy Recovery Ventilator
4.2 Market of Energy Recovery Ventilator, By Technology Type
4.3 Market of Energy Recovery Ventilator, By Application
4.4 Market of Energy Recovery Ventilator, By Region
5 Market Overview (Page No. - 30)
5.1 Introduction
5.2 Market Dynamics
5.2.1 Drivers
5.2.1.1 Growing Need to Reduce Energy Consumption in Residential and Commercial Buildings
5.2.1.2 Increasing Number of Green Buildings Across the Globe
5.2.1.3 Growing Importance of Indoor Air Quality
5.2.2 Restraints
5.2.2.1 Lack of Awareness About the Benefits Offered By Energy Recovery Ventilators
5.2.2.2 High Cost Involved in the Purchase, Installation, and Maintenance of Energy Recovery Ventilators
5.2.3 Opportunities
5.2.3.1 Innovations in Energy Recovery Ventilators
5.2.4 Challenges
5.2.4.1 Complexities Involved in Retrofitting Existing Buildings With New and Advanced Energy Recovery Ventilators
5.3 Porter�s Five Forces Analysis
5.3.1 Bargaining Power of Suppliers
5.3.2 Bargaining Power of Buyers
5.3.3 Threat of Substitutes
5.3.4 Threat of New Entrants
5.3.5 Intensity of Competitive Rivalry
6 Energy Recovery Ventilator Market, By Technology Type (Page No. - 39)
6.1 Introduction
6.2 Plate Heat Exchanger
6.3 Heat Pipe Heat Exchanger
6.4 Rotary Heat Exchanger
6.5 Run-Around Coil
6.6 Others
7 Energy Recovery Ventilator Market, By Application (Page No. - 47)
7.1 Introduction
7.2 Commercial
7.3 Residential
7.4 Others
8 Energy Recovery Ventilator Market, By Region (Page No. - 53)
8.1 Introduction
8.2 North America
8.2.1 US
8.2.2 Canada
8.2.3 Mexico
8.3 Europe
8.3.1 Germany
8.3.2 UK
8.3.3 France
8.3.4 Italy
8.3.5 Spain
8.3.6 Scandinavia
8.3.7 Benelux
8.3.8 Rest of Europe
8.4 Asia Pacific
8.4.1 China
8.4.2 Japan
8.4.3 India
8.4.4 South Korea
8.4.5 Australia
8.4.6 New Zealand
8.4.7 Indonesia
8.4.8 Rest of Asia Pacific
8.5 Middle East & Africa
8.5.1 Saudi Arabia
8.5.2 UAE
8.5.3 Egypt
8.5.4 Rest of Middle East & Africa
8.6 South America
8.6.1 Brazil
8.6.2 Argentina
8.6.3 Rest of South America
9 Competitive Landscape (Page No. - 92)
9.1 Overview
9.2 Market Ranking Analysis
9.3 Competitive Scenario
9.3.1 New Product Launches
9.3.2 Expansions
9.3.3 Mergers & Acquisitions
9.3.4 Joint Ventures
10 Company Profiles (Page No. - 97)
(Overview, Financial*, Products & Services, Strategy, and Developments)
10.1 Mitsubishi Electric Corporation
10.2 Daikin
10.3 Panasonic Corporation
10.4 LG Electronics
10.5 Johnson Controls
10.6 Fujitsu General
10.7 Carrier Corporation
10.8 Nortek Air Solutions
10.9 Munters
10.10 Greenheck Fan Corporation
10.11 Heatex AB
10.12 Other Key Players
10.12.1 Renewaire
10.12.2 Airxchange
10.12.3 Loren Cook Company
10.12.4 Broan-Nutone
10.12.5 Paschal Heat, Air & Geothermal
10.12.6 Ostberg Group
10.12.7 Trane
10.12.8 Lennox International
10.12.9 Flaktgroup
10.12.10 Reznor Manufacturing Company
10.12.11 Desiccant Rotors International (DRI)
10.12.12 Zehnder America
10.12.13 Ruskin Rooftop Systems
10.12.14 Dunnair
*Details Might Not Be Captured in Case of Unlisted Companies
11 Appendix (Page No. - 121)
11.1 Discussion Guide
11.2 Knowledge Store: Marketsandmarkets Subscription Portal
11.3 Introducing RT: Real-Time Market Intelligence
11.4 Available Customizations
11.5 Related Reports
11.6 Author Details
List of Tables (84 Tables)
Table 1 Market Snapshot of Energy Recovery Ventilator
Table 2 Cost Analysis of Energy Recovery Ventilators
Table 3 Market, By Technology Type, 2015�2022 (USD Million)
Table 4 Market for Plate Heat Exchanger, By Region, 2015�2022 (USD Million)
Table 5 Market for Heat Pipe Heat Exchanger, By Region, 2015�2022 (USD Million)
Table 6 Market for Rotary Heat Exchanger, By Region, 2015�2022 (USD Million)
Table 7 Market for Run-Around Coil, By Region, 2015�2022 (USD Million)
Table 8 Market for Other Technology Types, By Region, 2015�2022 (USD Million)
Table 9 Market, By Application, 2015�2022 (USD Million)
Table 10 Market in Commercial, By Region, 2015�2022 (USD Million)
Table 11 Market in Residential, By Region, 2015�2022 (USD Million)
Table 12 Market in Other Applications, By Region, 2015�2022 (USD Million)
Table 13 Market, By Region, 2015�2022 (USD Million)
Table 14 North America Market, By Country, 2015-2022 (USD Million)
Table 15 North America Market, By Technology Type, 2015-2022 (USD Million)
Table 16 North America Market, By Application, 2015-2022 (USD Million)
Table 17 US Market, By Technology Type, 2015�2022 (USD Million)
Table 18 US Market, By Application, 2015-2022 (USD Million)
Table 19 Canada Market, By Technology Type, 2015�2022 (USD Million)
Table 20 Canada Market, By Application, 2015-2022 (USD Million)
Table 21 Mexico Market, By Technology Type, 2015�2022 (USD Million)
Table 22 Mexico Market, By Application, 2015-2022 (USD Million)
Table 23 Europe Market, By Country, 2015�2022 (USD Million)
Table 24 Europe Market, By Technology Type, 2015�2022 (USD Million)
Table 25 Europe Market, By Application, 2015�2022 (USD Million)
Table 26 Germany Market, By Technology Type, 2015�2022 (USD Million)
Table 27 Germany Market, By Application, 2015�2022 (USD Million)
Table 28 UK Market, By Technology Type, 2015�2022 (USD Million)
Table 29 UK Market, By Application, 2015�2022 (USD Million)
Table 30 France Market, By Technology Type, 2015�2022 (USD Million)
Table 31 France Market, By Application, 2015�2022 (USD Million)
Table 32 Italy Market, By Technology Type, 2015�2022 (USD Million)
Table 33 Italy Market, By Application, 2015�2022 (USD Million)
Table 34 Spain Market, By Technology Type, 2015�2022 (USD Million)
Table 35 Spain Market, By Application, 2015�2022 (USD Million)
Table 36 Scandinavia Market, By Technology Type, 2015�2022 (USD Million)
Table 37 Scandinavia Market, By Application, 2015�2022 (USD Million)
Table 38 Benelux Market, By Technology Type, 2015�2022 (USD Million)
Table 39 Benelux Market, By Application, 2015�2022 (USD Million)
Table 40 Rest of Europe Market, By Technology Type, 2015�2022 (USD Million)
Table 41 Rest of Europe Market, By Application, 2015�2022 (USD Million)
Table 42 Asia Pacific Market, By Country, 2015�2022 (USD Million)
Table 43 Asia Pacific Market, By Technology Type, 2015�2022 (USD Million)
Table 44 Asia Pacific Market, By Application, 2015�2022 (USD Million)
Table 45 China Market, By Technology Type, 2015�2022 (USD Million)
Table 46 China Market, By Application, 2015�2022 (USD Million)
Table 47 Japan Market, By Technology Type, 2015�2022 (USD Million)
Table 48 Japan Market, By Application, 2015�2022 (USD Million)
Table 49 India Market, By Technology Type, 2015�2022 (USD Million)
Table 50 India Market, By Application, 2015�2022 (USD Million)
Table 51 South Korea Market, By Technology Type, 2015�2022 (USD Million)
Table 52 South Korea Market, By Application, 2015�2022 (USD Million)
Table 53 Australia Market, By Technology Type, 2015�2022 (USD Million)
Table 54 Australia Market, By Application, 2015�2022 (USD Million)
Table 55 New Zealand Market, By Technology Type, 2015�2022 (USD Million)
Table 56 New Zealand Market, By Application, 2015�2022 (USD Million)
Table 57 Indonesia Market, By Technology Type, 2015�2022 (USD Million)
Table 58 Indonesia Market, By Application, 2015�2022 (USD Million)
Table 59 Rest of Asia Pacific Market, By Technology Type, 2015�2022 (USD Million)
Table 60 Rest of Asia Pacific Market, By Application, 2015�2022 (USD Million)
Table 61 Middle East & Africa Market, By Country, 2015�2022 (USD Million)
Table 62 Middle East & Africa Market, By Technology Type, 2015�2022 (USD Million)
Table 63 Middle East & Africa Market, By Application, 2015�2022 (USD Million)
Table 64 Saudi Arabia Market, By Technology Type, 2015-2022 (USD Million)
Table 65 Saudi Arabia Market, By Application, 2015�2022 (USD Million)
Table 66 UAE Market, By Technology Type, 2015-2022 (USD Million)
Table 67 UAE Market, By Application, 2015�2022 (USD Million)
Table 68 Egypt Market, By Technology Type, 2015-2022 (USD Million)
Table 69 Egypt Market, By Application, 2015�2022 (USD Million)
Table 70 Rest of Middle East & Africa Market, By Technology Type, 2015-2022 (USD Million)
Table 71 Rest of Middle East & Africa Market, By Application, 2015�2022 (USD Million)
Table 72 South America Market, By Country, 2015�2022 (USD Million)
Table 73 South America Market, By Technology Type, 2015�2022 (USD Million)
Table 74 South America Market, By Application, 2015�2022 (USD Million)
Table 75 Brazil Market, By Technology Type, 2015�2022 (USD Million)
Table 76 Brazil Market, By Application, 2015�2022 (USD Million)
Table 77 Argentina Market, By Technology Type, 2015�2022 (USD Million)
Table 78 Argentina Market, By Application, 2015�2022 (USD Million)
Table 79 Rest of South America Market, By Technology Type, 2015�2022 (USD Million)
Table 80 Rest of South America Market, By Application, 2015�2022 (USD Million)
Table 81 New Product Launches, 2012-2017
Table 82 Expansions, 2012-2017
Table 83 Mergers & Acquisitions, 2012-2017
Table 84 Joint Ventures, 2012-2017
List of Figures (35 Figures)
Figure 1 Market Research Design of Energy Recovery Ventilator
Figure 2 Market Data Triangulation of Energy Recovery Ventilator
Figure 3 Plate Heat Exchanger Technology is Expected to Lead the Market of Energy Recovery Ventilator Through 2022
Figure 4 Commercial Application is Expected to Lead the Market of Energy Recovery Ventilator By 2022
Figure 5 North America is Expected to Lead the Market of Energy Recovery Ventilator in 2017
Figure 6 Increasing Demand for Energy-Efficient Devices is Creating Opportunities for Market Growth of Energy Recovery Ventilator
Figure 7 North America to Be the Largest Market Across All Technology Types for Energy Recovery Ventilator in 2017
Figure 8 North America to Be the Largest Market Across All Applications for Energy Recovery Ventilator in 2017
Figure 9 North America Market of Energy Recovery Ventilator is Projected to Grow at the Fastest Rate Between 2017 and 2022
Figure 10 Market of Energy Recovery Ventilator: Drivers, Restraints, Challenges, and Opportunities
Figure 11 Average Green Share of Building Project Activity, By Country, 2015
Figure 12 Market of Energy Recovery Ventilator: Porter�s Five Forces Analysis
Figure 13 Market Overview of Energy Recovery Ventilator: By Technology Type
Figure 14 Plate Heat Exchanger Segment in North America is Expected to Grow at the Highest CAGR During the Forecast Period
Figure 15 Heat Pipe Heat Exchanger Segment is Expected to Grow at the Second-Highest CAGR in Europe During the Forecast Period
Figure 16 Rotary Heat Exchanger Segment is Expected to Lead in North America During the Forecast Period
Figure 17 Run-Around Coil Segment is Expected to Be the Third-Largest in Asia Pacific During the Forecast Period
Figure 18 Other Technology Type is Expected to Lead in North America During the Forecast Period
Figure 19 Market of Energy Recovery Ventilator, By Application
Figure 20 Commercial Application Segment is Expected to Lead in North America During the Forecast Period
Figure 21 Residential Application Segment in Europe is Expected to Grow at the Second-Highest CAGR During the Forecast Period
Figure 22 North America to Be the Largest Market for Other Applications of Energy Recovery Ventilator
Figure 23 Market of Energy Recovery Ventilator in North America and Europe is Projected to Witness High Growth During the Forecast Period
Figure 24 North America Market Snapshot of Energy Recovery Ventilator
Figure 25 Europe Market Snapshot of Energy Recovery Ventilator
Figure 26 Asia Pacific Market Snapshot of Energy Recovery Ventilator
Figure 27 Middle East & Africa Market Snapshot of Energy Recovery Ventilator
Figure 28 South America Market Snapshot of Energy Recovery Ventilator
Figure 29 Companies Primarily Adopted Organic Growth Strategies Between 2012 and 2017
Figure 30 Mitsubishi Electric Corporation: Company Snapshot
Figure 31 Daikin: Company Snapshot
Figure 32 Panasonic Corporation: Company Snapshot
Figure 33 LG Electronics: Company Snapshot
Figure 34 Johnson Controls: Company Snapshot
Figure 35 Fujitsu General: Company Snapshot


Growth opportunities and latent adjacency in Energy Recovery Ventilator Market
General information on Energy Recovery Ventilator Market
Information on rotating heat exchangers from the report
Interested in the Ventilators market
Interested in learning about the market size, segments, dynamics, trends, and major players.
Need forecast data on Energy Recovery Ventilator markets in countries such as Germany, US, Australia, Saudi Arabia, and Italy. Also, identifying top 5 applications in the market with key players.
To understand the growth of Energy recovery ventilator market in the U.S. for a potential product development.
Incomplete