Viral Inactivation Market by Product (Kits, Reagents, Systems, Services), Application (Stem Cell, Blood, Tissue, Cell & Gene Therapy), Method (Solvent Detergent, Pasteurization) & End User (Pharmaceutical and Biotechnology, CROs) - Global Forecast to 2021


The global viral inactivation market was valued at USD 320.5 Million in 2016 and poised to grow at a CAGR of 12.3% between 2016 and 2021, to reach USD 573.0 Million in 2021. Viral inactivation testing is necessary by regulatory authorities for investigational new drug (IND) submission and is mainly critical in process development for biologicals including tissue and tissue products, stem cell products, cellular and gene therapy products, blood and blood products, and vaccine and therapeutics. The major drivers for the market are rapid growth in pharmaceutical and biotechnology industries and strong trend of R&D investments in life sciences industry. Increasing number of new drug launches, rise in chronic disease burden, and increasing government support for the pharmaceutical and biotechnology industries will also aid the growth of this market.
In this report, the global market is segmented based on method, product, application, end user, and geography. The method segments included in the report are solvent detergent method, pasteurization, and other methods.
The product segments included in the report are kits and reagents, services, and viral inactivation systems and accessories.
The application segments included in the report are blood & blood products, cellular & gene therapy products, stem cell products, tissue & tissue products, and vaccines and therapeutics.
Based on end user this market is categorized into pharmaceutical and biotechnology companies, contract research organizations, academic research institutes, and other end users.
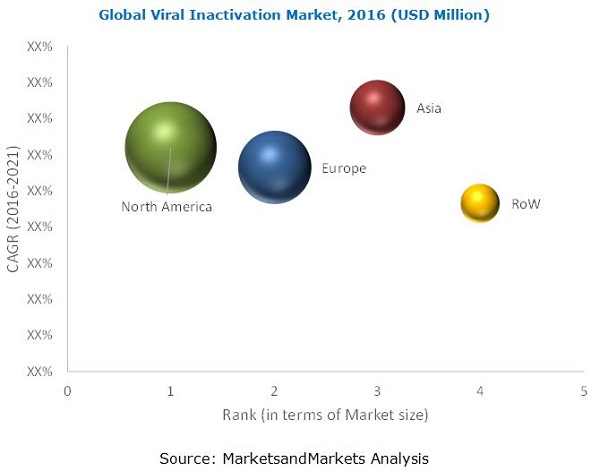
Based on geography the viral inactivation market is segmented into North America, Europe, Asia and Rest of the World (RoW).
A combination of bottom-up and top-down approaches were used to calculate market sizes and growth rates of the global market and its subsegments. Secondary information was used to identify overall revenue, geographic reach, and product portfolios of market players. Estimates of their viral inactivation market segment revenues were validated through primary interviews. Primary interviews with key opinion leaders were also used to determine the percentage shares of each subsegment and the relative differences in growth rates
Major players in the viral inactivation market include Clean Cells (France), Charles River Laboratories International, Inc. (U.S.), Danaher Corporation (U.S.), Merck KGaA (Germany), Parker Hannifin (U.S.), Rad Source Technologies (U.S.), Sartorius AG (Germany), SGS S.A. (Switzerland), Texcell, Inc. (France), Viral Inactivated Plasma Systems SA (Switzerland), and WuXi PharmaTech (Cayman) Inc. (China).
Target Audience for this Report:
- Viral inactivation product manufacturers and vendors
- Research associations related to pharmaceutical and biotechnological research
- contract research organizations (CROs)
- Various research and consulting firms
- Healthcare institutions
- Research institutes
- Distributors of viral inactivation equipment
To know about the assumptions considered for the study, download the pdf brochure
Get online access to the report on the World's First Market Intelligence Cloud
- Easy to Download Historical Data & Forecast Numbers
- Company Analysis Dashboard for high growth potential opportunities
- Research Analyst Access for customization & queries
- Competitor Analysis with Interactive dashboard
- Latest News, Updates & Trend analysis
Request Sample Scope of the Report
Get online access to the report on the World's First Market Intelligence Cloud
- Easy to Download Historical Data & Forecast Numbers
- Company Analysis Dashboard for high growth potential opportunities
- Research Analyst Access for customization & queries
- Competitor Analysis with Interactive dashboard
- Latest News, Updates & Trend analysis

This research report categorizes the global viral inactivation market into the following segments and subsegments:
Viral Inactivation Market By Method
- Solvent Detergent Method
- Pasteurization
- Other Viral Inactivation Method
Viral Inactivation Market By Product
- Kits and Reagents
- Services
- Viral Inactivation Systems and Accessories
Viral Inactivation Market By Application
- Blood & Blood Products
- Cellular & Gene Therapy Products
- Stem Cell Products
- Tissue & Tissue Products
- Vaccines and Therapeutics
Viral Inactivation Market By End User
- Pharmaceutical and Biotechnology Companies
- Contract Research Organizations
- Academic Research Institutes
- Other End Users
Viral Inactivation Market By Geography
-
North America
- Canada
- U.S.
- Europe
-
Asia
- China
- Japan
- India
- Rest of Asia
- Rest of the World
Available Customizations
With the given market data, MarketsandMarkets offers customizations as per the company’s specific needs. The following customization options are available for the report:
Geographic Analysis for Viral Inactivation Market
- Further breakdown of the viral inactivation market into specific countries/regions in Europe, and Rest of The World
Company Information
- Detailed analysis and profiling of additional market players (Up to 5)
Viral inactivation is important and mandatory step in the manufacturing process of biological products to remove or inactivate potential contaminant viruses. These biological products are used for the treatment and diagnostic purposes in humans. As the disease burden in the world is increasing the demand for the medicines is increasing hence the production of biologicals, injectables etc., is on a rise. Also, many of pharmaceutical and biotechnology firms are gearing to cater to the growing demands of medicines. This aids to the growth of market.
This report segments the global viral inactivation market into method, product, application, end user, and geography. The method segments included in the report are solvent detergent method, pasteurization, and other methods. Other viral inactivation method includes low pH, microwave heating, irradiation, and high-energy light.
The product segments included in the report are kits and reagents, services, and viral inactivation systems and accessories.
Based on end user this market is categorized into pharmaceutical and biotechnology companies, contract research organizations, academic research institutes, and other end users. Other end user segment primarily includes cell banks, small cell culture laboratories and consultants, microbiology laboratories, immunology laboratories, molecular laboratories, animal facilities, toxicology laboratories, and media/sera manufacturers.
The application segments included in the report are blood & blood products, cellular & gene therapy products, stem cell products, tissue & tissue products, and vaccines and therapeutics. Based on geography the market is segmented into North America, Europe, Asia and Rest of the World (RoW).
The high degree of market consolidation is a major factor restraining the growth of this market. The major players in the Viral Inactivation Market include Clean Cells (France), Charles River Laboratories International, Inc. (U.S.), Danaher Corporation (U.S.), Merck KGaA (Germany), Parker Hannifin (U.S.), Rad Source Technologies (U.S.), Sartorius AG (Germany), SGS S.A. (Switzerland), Texcell, Inc. (France), Viral Inactivated Plasma Systems SA (Switzerland), and WuXi PharmaTech (Cayman) Inc. (China).
To speak to our analyst for a discussion on the above findings, click Speak to Analyst
Table of Contents
1 Introduction (Page No. - 13)
1.1 Objectives of the Study
1.2 Market Definition
1.2.1 Markets Covered
1.2.2 Years Considered for the Study
1.3 Currency
1.4 Limitations
1.5 Stakeholders
2 Research Methodology (Page No. - 16)
2.1 Market Size Estimation
2.2 Market Breakdown and Data Triangulation
2.3 Market Share Estimation
2.3.1 Key Data From Secondary Sources
2.3.2 Key Data From Primary Sources
2.3.3 Assumptions
3 Executive Summary (Page No. - 23)
4 Premium Insights (Page No. - 28)
4.1 Global Viral Inactivation Market Overview
4.2 Life Cycle Analysis, By Region
5 Market Overview (Page No. - 32)
5.1 Introduction
5.1.1 Market Segmentation
5.2 Market Dynamics
5.2.1 Drivers
5.2.1.1 Rapid Growth in Pharmaceutical and Biotechnology Industries
5.2.1.2 Increasing Number of New Drug Launches
5.2.1.3 Strong R&D Investments in the Life Sciences Industry
5.2.1.4 Increasing Government Support for Pharmaceutical and Biotechnology Industries
5.2.1.5 High Incidence and Large Economic Burden of Chronic Diseases
5.2.2 Restraint
5.2.2.1 High Degree of Consolidation to Act as A Major Barrier for New Entrants
5.2.3 Opportunities
5.2.3.1 Increasing Pharmaceutical Outsourcing
5.2.3.2 Developing Countries Present Significant Growth Opportunities for the Market
5.2.4 Challenge
5.2.4.1 Stringent Regulatory Frameworks and Time-Consuming Approval Processes for Viral Inactivation Products
6 Viral Inactivation Market, By Method (Page No. - 41)
6.1 Introduction
6.2 Solvent Detergent Method
6.3 Pasteurization
6.4 Other Methods
7 Viral Inactivation Market, By Product (Page No. - 47)
7.1 Introduction
7.2 Kits and Reagents
7.3 Services
7.4 Viral Inactivation Systems and Accessories
8 Viral Inactivation Market, By Application (Page No. - 54)
8.1 Introduction
8.2 Vaccines and Therapeutics
8.3 Blood and Blood Products
8.4 Cellular and Gene Therapy Products
8.5 Tissues and Tissue Products
8.6 Stem Cell Products
9 Viral Inactivation Market, By End User (Page No. - 64)
9.1 Introduction
9.2 Pharmaceutical and Biotechnology Companies
9.3 Contract Research Organizations
9.4 Academic Research Institutes
9.5 Other End Users
10 Viral Inactivation Market, By Geography (Page No. - 73)
10.1 Introduction
10.2 North America
10.2.1 U.S.
10.2.2 Canada
10.3 Europe
10.4 Asia
10.4.1 China
10.4.2 Japan
10.4.3 India
10.4.4 Rest of Asia
10.5 Rest of the World
11 Competitive Landscape (Page No. - 111)
11.1 Overview
11.2 Strategic Overview
11.3 Leading Players in the Viral Inactivation Market
11.4 Competitive Situation and Trends
11.4.1 Expansions
11.4.2 Acquisitions
11.4.3 Agreements, Collaborations, and Partnerships
11.4.4 Services Launches
12 Company Profiles (Page No. - 119)
(Introduction, Products & Services, Strategy, & Analyst Insights, Developments, Mnm View)*
12.1 Introduction
12.2 Danaher Corporation
12.3 Merck KGAA
12.4 Parker Hannifin Corporation
12.5 Sartorius AG
12.6 SGS SA
12.7 Charles River Laboratories International, Inc.
12.8 Clean Cells Inc.
12.9 Rad Source Technologies, Inc.
12.10 Texcell, Inc.
12.11 Viral Inactivated Plasma Systems SA
12.12 Wuxi Pharmatech (Cayman) Inc.
*Details on Marketsandmarkets View, Introduction, Product & Services, Strategy, & Analyst Insights, New Developments Might Not Be Captured in Case of Unlisted Companies.
13 Appendix (Page No. - 145)
13.1 Insights of Industry Experts
13.2 Discussion Guide
13.3 Other Developments
13.4 Knowledge Store: Marketsandmarkets’ Subscription Portal
13.5 Introducing RT: Real-Time Market Intelligence
13.6 Available Customizations
13.7 Related Reports
List of Tables (72 Tables)
Table 1 Viral Inactivation Market Summary
Table 2 Rapid Growth in Pharmaceutical and Biotechnology Industries Driving the Growth of the Market
Table 3 High Degree of Consolidation to Restrict Entry of New Players
Table 4 Increasing Pharmaceutical Outsourcing to Offer Significant Growth Opportunities in the Market
Table 5 Stringent Regulatory Frameworks for Viral Inactivation Products are A Major Market Challenge
Table 6 Market Size, By Method, 2014–2021 (USD Million)
Table 7 Market Size for Solvent Detergent Method, By Region, 2014–2021 (USD Million)
Table 8 Market Size for Pasteurization Method, By Region, 2014–2021 (USD Million)
Table 9 Market Size for Other Methods, By Region, 2014–2021 (USD Million)
Table 10 Market Size, By Product, 2014–2021 (USD Million)
Table 11 Viral Inactivation Kits and Reagents Market Size, By Region, 2014–2021 (USD Million)
Table 12 Viral Inactivation Services Market Size, By Region, 2014–2021 (USD Million)
Table 13 Viral Inactivation Systems and Accessories Market Size, By Region, 2014–2021 (USD Million)
Table 14 Market Size, By Application, 2014–2021 (USD Million)
Table 15 Market Size for Vaccines and Therapeutics, By Region, 2014–2021 (USD Million)
Table 16 Market Size for Blood and Blood Products, By Region, 2014–2021 (USD Million)
Table 17 Market Size for Cellular and Gene Therapy Products, By Region, 2014–2021 (USD Million)
Table 18 Market Size for Tissues and Tissue Products, By Region, 2014–2021 (USD Million)
Table 19 Market Size for Stem Cell Products, By Region, 2014–2021 (USD Million)
Table 20 Market Size, By End User, 2014–2021 (USD Million)
Table 21 Market Size for Pharmaceutical and Biotechnology Companies, By Region, 2014–2021 (USD Million)
Table 22 Market Size for Contract Research Organizations, By Region, 2014–2021 (USD Million)
Table 23 Market Size for Academic Research Institutes, By Region, 2014–2021 (USD Million)
Table 24 Market Size for Other End Users, By Region, 2014–2021 (USD Million)
Table 25 Market Size, By Region, 2014–2021 (USD Million)
Table 26 North America: Market Size, By Country, 2014–2021 (USD Million)
Table 27 North America: Market Size, By Application, 2014–2021 (USD Million)
Table 28 North America: Market Size, By End User, 2014–2021 (USD Million)
Table 29 North America: Market Size, By Method, 2014–2021 (USD Million)
Table 30 North America: Market Size, By Product, 2014–2021 (USD Million)
Table 31 U.S.: Market Size, By Application, 2014–2021 (USD Million)
Table 32 U.S.: Market Size, By End User, 2014–2021 (USD Million)
Table 33 U.S.: Market Size, By Method, 2014–2021 (USD Million)
Table 34 U.S.: Market Size, By Product, 2014–2021 (USD Million)
Table 35 Canada: Market Size, By Application, 2014–2021 (USD Million)
Table 36 Canada: Market Size, By End User, 2014–2021 (USD Million)
Table 37 Canada: Market Size, By Method, 2014–2021 (USD Million)
Table 38 Canada: Market Size, By Product, 2014–2021 (USD Million)
Table 39 Europe: Market Size, By Application, 2014–2021 (USD Million)
Table 40 Europe: Market Size, By End User, 2014–2021 (USD Million)
Table 41 Europe: Market Size, By Method, 2014–2021 (USD Million)
Table 42 Europe: Market Size, By Product, 2014–2021 (USD Million)
Table 43 Asia: Market Size, By Country, 2014–2021 (USD Million)
Table 44 Asia: Market Size, By Application, 2014–2021 (USD Million)
Table 45 Asia: Market Size, By End User, 2014–2021 (USD Million)
Table 46 Asia: Market Size, By Method, 2014–2021 (USD Million)
Table 47 Asia: Market Size, By Product, 2014–2021 (USD Million)
Table 48 China: Market Size, By Application, 2014–2021 (USD Million)
Table 49 China: Market Size, By End User, 2014–2021 (USD Million)
Table 50 China: Market Size, By Method, 2014–2021 (USD Million)
Table 51 China: Market Size, By Product, 2014–2021 (USD Million)
Table 52 Japan: Market Size, By Application, 2014–2021 (USD Million)
Table 53 Japan: Market Size, By End User, 2014–2021 (USD Million)
Table 54 Japan: Market Size, By Method, 2014–2021 (USD Million)
Table 55 Japan: Market Size, By Product, 2014–2021 (USD Million)
Table 56 India: Market Size, By Application, 2014–2021 (USD Million)
Table 57 India: Market Size, By End User, 2014–2021 (USD Million)
Table 58 India: Market Size, By Method, 2014–2021 (USD Million)
Table 59 India: Market Size, By Product, 2014–2021 (USD Million)
Table 60 RoA: Market Size, By Application, 2014–2021 (USD Million)
Table 61 RoA: Market Size, By End User, 2014–2021 (USD Million)
Table 62 RoA: Market Size, By Method, 2014–2021 (USD Million)
Table 63 RoA: Market Size, By Product, 2014–2021 (USD Million)
Table 64 RoW: Market Size, By Application, 2014–2021 (USD Million)
Table 65 RoW: Market Size, By End User, 2014–2021 (USD Million)
Table 66 RoW: Market Size, By Method, 2014–2021 (USD Million)
Table 67 RoW: Market Size, By Product, 2014–2021 (USD Million)
Table 68 Market Developments Between 2012 and 2016
Table 69 Expansions, 2012–2016
Table 70 Acquisitions, 2012–2016
Table 71 Agreements, Collaborations, and Partnerships, 2012–2016
Table 72 Services Launches, 2012–2015
List of Figures (70 Figures)
Figure 1 Global Viral Inactivation Market
Figure 2 Research Design
Figure 3 Market Size Estimation Methodology: Bottom-Up Approach
Figure 4 Market Size Estimation Methodology: Top-Down Approach
Figure 5 Breakdown of Primary Interviews: By Company Type, Designation, and Region
Figure 6 Data Triangulation Methodology
Figure 7 Market Size, By Method, 2016 vs 2021 (USD Million)
Figure 8 Market Size, By Product, 2016 vs 2021 (USD Million)
Figure 9 Market Size, By Application, 2016 vs 2021 (USD Million)
Figure 10 Market Size, By End User, 2016 vs 2021 (USD Million)
Figure 11 Market Size, By Region, 2016 vs 2021 USD Million)
Figure 12 Growth in Pharmaceutical and Biotechnology Industries Will Drive the Viral Inactivation Market During the Forecast Period (2016-2021)
Figure 13 Kits and Reagents Product Segment to Account for the Largest Viral Inactivation Market Share in 2016
Figure 14 Asia to Grow at the Highest Rate During the Forecast Period
Figure 15 Asia Holds Lucrative Growth Opportunities
Figure 16 Market Segmentation
Figure 17 Market: Drivers, Restraints, Opportunities, & Challenges
Figure 18 Number of New Pharmaceutical Drug Launched, 2003–2013
Figure 19 Market Size, By Method, 2016 (USD Million)
Figure 20 North America to Dominate the Solvent Detergent Method Segment in 2016
Figure 21 North America to Dominate the Pasteurization Segment in 2016
Figure 22 North America to Dominate the Other Methods Segment in 2016
Figure 23 Kits and Reagents to Form the Largest Product Segment in 2016
Figure 24 North America to Dominate the Viral Inactivation Kits and Reagents Market in 2016
Figure 25 North America to Command the Largest Share of the Viral Inactivation Services Market in 2016
Figure 26 North America to Command the Largest Share of the Viral Inactivation Systems and Accessories Market in 2016
Figure 27 Viral Inactivation Market Size, By Application, 2016 (USD Million)
Figure 28 North America to Dominate the Vaccines and Therapeutics Segment in 2016
Figure 29 North America Holds the Largest Share in the Blood and Blood Products Segment in 2016
Figure 30 Asia to Witness Highest Growth in the Cellular and Gene Therapy Products Segment During the Forecast Period
Figure 31 North America to Command Largest Share of the Tissues and Tissue Products Segment During the Forecast Period
Figure 32 Asia to Witness Highest Growth in the Stem Cell Products Segment During the Forecast Period
Figure 33 Viral Inactivation Market, By End User
Figure 34 Viral Inactivation Market Size, By End User, 2016 (USD Million)
Figure 35 North America to Dominate the Pharmaceutical and Biotechnology Companies End-User Segment During the Forecast Period
Figure 36 Asia to Witness the Highest Growth in the Contract Research Organization End-User Segment During the Forecast Period
Figure 37 Asia to Witness the Highest Growth in the Academic Research Institutes End-User Segment During the Forecast Period
Figure 38 North America to Dominate the Other End Users Segment During the Forecast Period
Figure 39 North America to Dominate the Global Market in 2016
Figure 40 Asian Market to Witness the Highest Growth During the Forecast Period (2016–2021)
Figure 41 North America: Viral Inactivation Market Snapshot
Figure 42 U.S. to Witness Highest Growth in the North American Viral Inactivation Market During the Forecast Period (2016–2021)
Figure 43 Vaccines and Therapeutics Segment to Command the Largest Share of the North American Viral Inactivation Market in 2016
Figure 44 Pharmaceutical and Biotechnology Companies to Dominate the North American Viral Inactivation End-User Market in 2016
Figure 45 Solvent Detergent Method Segment to Dominate the North American Market in 2016
Figure 46 Kits and Reagents Estimated to Form the Largest Product Segment in the North American Viral Inactivation Market in 2016
Figure 47 Vaccines and Therapeutics Segment to Command the Largest Share of the European Viral Inactivation Market in 2016
Figure 48 Pharmaceutical and Biotechnology Companies to Dominate the European Viral Inactivation End-Users Market in 2016
Figure 49 Solvent Detergent Methods Segment to Dominate the Viral Inactivation Market in Europe in 2016
Figure 50 Kits and Reagents to Form the Largest Product Segment in the European Viral Inactivation Market in 2016
Figure 51 Asia: Viral Inactivation Market Snapshot
Figure 52 China to Witness Highest Growth in the Asian Viral Inactivation Market in 2016
Figure 53 Vaccines and Therapeutics Segment to Command the Largest Share of the Asian Viral Inactivation Market in 2016
Figure 54 Pharmaceutical and Biotechnology Companies to Dominate the Asian Viral Inactivation End-Users Market in 2016
Figure 55 Solvent Detergent Method Segment to Dominate the Asian Market in 2016
Figure 56 Kits and Reagents Estimated to Form the Largest Product Segment in the Asian Viral Inactivation Market in 2016
Figure 57 Vaccines and Therapeutics Segment to Command the Largest Share of the Viral Inactivation Market in the Rest of the World in 2016
Figure 58 Pharmaceutical and Biotechnology Companies to Dominate the Viral Inactivation End-Users Market in the Rest of the World in 2016
Figure 59 Solvent Detergent Method Segment to Dominate the Viral Inactivation Market in the Rest of the World Region in 2016
Figure 60 Kits and Reagents to Form the Largest Viral Inactivation Product Segment in the Rest of the World Region in 2016
Figure 61 Expansions and Acquisitions—Key Strategies Adopted By Players
Figure 62 Viral Inactivation Market Share Analysis, By Key Player, 2015
Figure 63 Financial Performance of Leading Market Players (2013–2015)
Figure 64 Company Snapshot: Danaher Corporation
Figure 65 Company Snapshot: Merck KGAA
Figure 66 Company Snapshot: Parker Hannifin Corporation
Figure 67 Company Snapshot: Sartorius AG
Figure 68 Company Snapshot: SGS SA
Figure 69 Company Snapshot: Charles River Laboratories International, Inc.
Figure 70 Company Snapshot: Wuxi Pharmatech (Cayman) Inc.

 Generating Response ...


Growth opportunities and latent adjacency in Viral Inactivation Market