Drug Discovery Informatics Market Size by Function (Target Data, Sequencing Data Analysis, Docking), Solution (Software, Services), Application (Drug Development), End User (Pharmaceutical, Biotechnology, Contract Research Organizations) & Region - Global Forecast to 2025


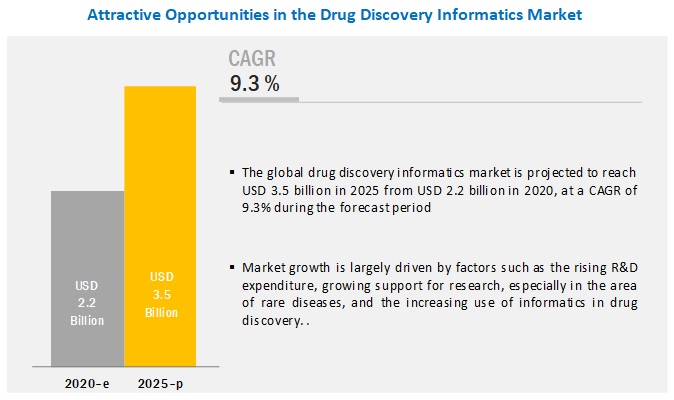
The global size of drug discovery informatics market in terms of revenue was estimated to be worth USD 2.2 billion in 2020 and is poised to reach USD 3.5 billion by 2025, growing at a CAGR of 9.3% from 2020 to 2025. The research study consists of an industry trend analysis, pricing analysis, patent analysis, conference and webinar materials, key stakeholders, and buying behaviour in the market.
Market growth is largely driven by factors such as the rising R&D expenditure, growing support for research, especially in the area of rare diseases, and the increasing use of informatics in drug discovery. However, the scarcity of skilled professionals and the high setup cost of informatics software are expected to limit market growth to a certain extent.
By function, the sequencing and target data analysis segment accounted for the largest share for the drug discovery informatics market.
The sequencing and target data analysis segment accounted for the largest share of the drug discovery informatics market for the function segment of the market. The large share of this segment can be attributed to increased application for sequencing analysis for the new drug entity and ease of handling of information from different sources and different domains.
By the end-user, the pharmaceutical companies segment accounted for the largest share of the market.
The pharmaceutical companies segment accounted for the largest share of the drug discovery informatics market; pharmaceutical companies are using this informatics software extensively for pre-clinical research & development, target identification, compound screening and lead identification, and streamlining their drug discovery process which is the major factor for driving the growth of this segment.
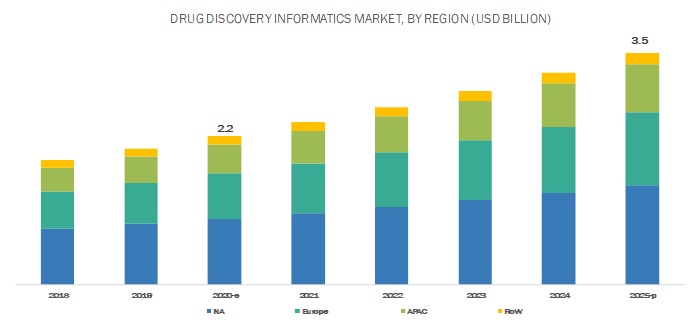
North America accounted for the largest share of the market.
The drug discovery informatics market is divided into four major regions-north America, Europe, Asia Pacific, and the Rest of the World (RoW). North America accounted for the largest share of the global drug discovery informatics market, closely followed by Europe. The large share of North America in the global market can be attributed to the presence of well-established CROs, rising R&D expenditure by pharmaceutical and biopharmaceutical companies
The Asia Pacific is estimated to grow at the highest CAGR during the forecast period. Factors such as the rapid growth in the pharmaceutical and biopharmaceutical industry, rising number of CROs, and the presence of less-stringent regulations for drug discovery processes
Drug Discovery Informatics Market Key Players
The major companies in the drug discovery informatics market include Jubilant Life Sciences Limited (India), Charles River Laboratories (US), IBM (US), Clarivate Analytics (US), and Accenture (Ireland).
Jubilant Life Sciences (India) has marked its presence among the major players in the discovery informatics market. To sustain its position in the drug discovery informatics market, the company focuses on collaborations to emerge as a preferred provider of drug discovery informatics services. For instance, in 2017, the company collaborated with Orion Corporation to provide drug discovery services. Such collaborations help the company to achieve business growth as well as advertise its expertise in the drug discovery informatics market.
Drug Discovery Informatics Market Scope
|
Report Metric |
Details |
|
Market Size Available for Years |
2017–2025 |
|
Base Year Considered |
2018 |
|
Forecast Period |
2019–2025 |
|
Forecast Units |
Values (USD) |
|
Segments Covered |
Function, Application, Solution, End User, and Region |
|
Geographies Covered |
North America (US, Canada), Europe (Germany, UK, France, Italy, Spain and RoE), APAC, and RoW |
|
Top Companies Covered |
Jubilant Life Sciences Limited (India), Charles River Laboratories (US), IBM (US), Clarivate Analytics (US), Eurofins Scientific (Germany), Thermo Fisher Scientific (US), Accenture PLC (Ireland), PerkinElmer Inc (US), Charles River Laboratories International (US), Schrödinger, Inc. (US), Albany Molecular Research (US), Certara (US), Evotec AG (Germany), Dassault Systèmes (Germany), Infosys Limited (India), Collaborative Drug Discovery (CDD), GVK Biosciences (India), Open Eye Scientific (US), Novo Informatics (India), Selvita (Poland), Cognizant (US), Scilligence (US), WuXi AppTec (China), Asteris, IO Informatics (US), Domainex (UK) |
This report categorizes the drug discovery informatics market into the following segments and subsegments:
By Function
- Sequencing and Target Data Analysis
- Docking
- Molecular Modelling
- Library & Database Preparation
- Other functions
By Application
- Drug Discovery
- Drug Development
By Solution
- Software
- Services
By End User
- Pharmaceutical Companies
- Biotechnology Companies
- Contract Research Organization (CROs)
- Other End Users
By Region
-
North America
- US
- Canada
-
Europe
- Germany
- UK
- France
- Italy
- Spain
- RoE
-
Asia Pacific
- China
- Japan
- India
- RoW
Recent Developments:
- In May 2019, Jubilant selected the CDD Vault informatics platform as its discovery research informatics platform for five years
- In May, 2019, Dassault Systèmes acquired Medidata Solution adding its clinical expertise and cloud-based solutions to Dassault’s portfolio
- In September 2019 Evotec collaborated with Takeda Pharmaceutical Company Limited to establish five drug discovery programs with clinical candidates from Evotec for further clinical development by Takeda across multiple therapy areas
Key questions addressed by the report:
- Who are the major players in the drug discovery informatics market?
- What are the regional growth trends and the largest revenue-generating regions in the drug discovery informatics market?
- What are the major drivers and challenges in the drug discovery informatics market?
- What are the major function segments in the drug discovery informatics market?
- What are the major end users in the drug discovery informatics market?
Frequently Asked Questions (FAQ):
How have you defined the drug discovery informatics market?
Drug discovery informatics is used for the analysis and interpretation of a large pool of clinical data and information to help researchers identify potential drug candidates for the development of new drug entities by using drug discovery informatics software and services.
Which is the leading type of function used in the drug discovery informatics market?
The sequencing and target data analysis segment accounted for the largest share of the drug discovery informatics market in 2019.
What are the major players active in global drug discovery informatics market?
The report contains in-detailed company profiles of 20 companies such as Jubilant Life Sciences Limited (India), Charles River Laboratories (US), IBM (US), Clarivate Analytics (US), and Accenture (Ireland) among others in the report.
What are the key stakeholders in drug discovery informatics Market?
The key stakeholders of the drug discovery informatics Market are research institutes, pharmaceutical and biotechnology companies, contract research organizations, government associations, healthcare associations/ institutes and drug discovery informatics solution providers.
To speak to our analyst for a discussion on the above findings, click Speak to Analyst
TABLE OF CONTENTS
1 INTRODUCTION (Page No. - 16)
1.1 OBJECTIVES OF THE STUDY
1.2 MARKET DEFINITION
1.2.1 INCLUSIONS & EXCLUSIONS
1.3 MARKET SCOPE
1.3.1 MARKETS COVERED
1.3.2 YEARS CONSIDERED FOR THE STUDY
1.4 CURRENCY
1.5 LIMITATIONS
1.6 STAKEHOLDERS
2 RESEARCH METHODOLOGY (Page No. - 20)
2.1 RESEARCH DATA
2.1.1 SECONDARY DATA
2.1.2 PRIMARY DATA
2.1.3 MARKET DATA ESTIMATION & TRIANGULATION
2.1.4 DATA TRIANGULATION
2.2 MARKET ESTIMATION METHODOLOGY
2.3 MARKET GROWTH RATE PROJECTIONS
2.4 RESEARCH ASSUMPTIONS
3 EXECUTIVE SUMMARY (Page No. - 26)
4 PREMIUM INSIGHTS (Page No. - 29)
4.1 DRUG DISCOVERY INFORMATICS MARKET OVERVIEW
4.2 NORTH AMERICA: DRUG DISCOVERY INFORMATICS MARKET, BY SOLUTION AND COUNTRY (2019)
4.3 DRUG DISCOVERY INFORMATICS MARKET, BY FUNCTION (USD MILLION)
4.4 DRUG DISCOVERY INFORMATICS MARKET SHARE, BY END USER, 2019
5 MARKET OVERVIEW (Page No. - 31)
5.1 INTRODUCTION
5.2 MARKET DYNAMICS
5.2.1 DRIVERS
5.2.1.1 Increased research spending on informatics by the pharmaceutical and biotechnology industries
5.2.1.2 Growing demand and support for rare disease and orphan drug research
5.2.1.3 Focus on drug discovery using informatics software
5.2.2 RESTRAINTS
5.2.2.1 High setup costs of informatics software
5.2.3 OPPORTUNITIES
5.2.3.1 Patent expiry
5.2.3.2 Growing biotechnology industry and biologics market
5.2.3.3 Growth in emerging markets
5.2.4 CHALLENGE
5.2.4.1 Dearth of skilled professionals
6 DRUG DISCOVERY INFORMATICS MARKET, BY FUNCTION (Page No. - 35)
6.1 INTRODUCTION
6.2 SEQUENCING & TARGET DATA ANALYSIS
6.2.1 SEQUENCING & TARGET DATA ANALYSIS HOLDS LARGEST SHARE OF THE MARKET, BY FUNCTION
6.3 DOCKING
6.3.1 MOLECULAR DOCKING TARGETS THE DEVELOPMENT OF POTENTIAL MOLECULES
6.4 MOLECULAR MODELING
6.4.1 CAPABILITY TO GENERATE ESTIMATIONS OF DRUG POTENTIAL MAKE MODELING A PROMINENT TOOL
6.5 LIBRARY & DATABASE PREPARATION
6.5.1 INCREASE IN DRUG RESEARCH IS EXPANDING THE USE OF DRUG DATABASES
6.6 OTHER FUNCTIONS
7 DRUG DISCOVERY INFORMATICS MARKET, BY APPLICATION (Page No. - 45)
7.1 INTRODUCTION
7.2 DRUG DEVELOPMENT
7.2.1 PRECLINICAL TESTING
7.2.1.1 Growth in the number of preclinical testing activities to support market growth
7.2.2 CLINICAL TRIALS
7.2.2.1 Informatics software help assess important aspects about clinical trial success
7.3 DRUG DISCOVERY
7.3.1 INCREASED SPENDING ON DRUG DISCOVERY TO DRIVE MARKET GROWTH
8 DRUG DISCOVERY INFORMATICS MARKET, BY SOLUTION (Page No. - 51)
8.1 INTRODUCTION
8.2 SOFTWARE
8.2.1 BENEFITS OF INFORMATICS SOFTWARE IN DRUG DISCOVERY ARE DRIVING THE GROWTH OF THE MARKET
8.3 SERVICES
8.3.1 A WIDE RANGE OF SERVICES IS AVAILABLE IN THE MARKET, FROM INSTALLATION TO POST-SALES SUPPORT
9 DRUG DISCOVERY INFORMATICS MARKET, BY END USER (Page No. - 56)
9.1 INTRODUCTION
9.2 PHARMACEUTICAL COMPANIES
9.2.1 PHARMACEUTICAL COMPANIES ACCOUNTED FOR THE LARGEST SHARE OF THE MARKET IN 2018
9.3 BIOTECHNOLOGY COMPANIES
9.3.1 INCREASING DEMAND FOR PERSONALIZED MEDICINE TO BOOST THE USE OF INFORMATICS IN BIOTECHNOLOGY COMPANIES
9.4 CONTRACT RESEARCH ORGANIZATIONS
9.4.1 RISE IN OUTSOURCING TO DRIVE THE GROWTH OF THIS END-USER SEGMENT
9.5 OTHER END USERS
10 DRUG DISCOVERY INFORMATICS MARKET, BY REGION (Page No. - 64)
10.1 INTRODUCTION
10.2 NORTH AMERICA
10.2.1 US
10.2.1.1 Rising R&D to support the growth of the drug discovery informatics market in the US
10.2.2 CANADA
10.2.2.1 Presence of a strong pharmaceuticals industry to propel market growth in Canada
10.3 EUROPE
10.3.1 UK
10.3.1.1 The UK is the largest market for drug discovery informatics in Europe
10.3.2 FRANCE
10.3.2.1 Loss of patent exclusivity of biologics to support the growth of the drug discovery informatics market in France
10.3.3 GERMANY
10.3.3.1 Increasing focus on drug discovery & development to drive market growth
10.3.4 ITALY
10.3.4.1 High production volume to boost drug informatics growth
10.3.5 SPAIN
10.3.5.1 Rising R&D expenditure to drive market growth in Spain
10.3.6 REST OF EUROPE
10.4 ASIA PACIFIC
10.4.1 CHINA
10.4.1.1 Large R&D pharmaceutical footprint to drive market growth in China
10.4.2 INDIA
10.4.2.1 Presence of a large number of CROs in India to propel market growth
10.4.3 JAPAN
10.4.3.1 Rising government initiatives for drug discovery to support the adoption of informatics software in Japan
10.4.4 REST OF ASIA PACIFIC
10.5 ROW
10.5.1 LATIN AMERICA IS AN ATTRACTIVE MARKET FOR DRUG DISCOVERY INFORMATICS IN THE ROW
11 COMPETITIVE LANDSCAPE (Page No. - 96)
11.1 INTRODUCTION
11.2 MARKET RANKING ANALYSIS, 2018
11.3 COMPETITIVE LEADERSHIP MAPPING
11.3.1 VISIONARY LEADERS
11.3.2 DYNAMIC DIFFERENTIATORS
11.3.3 EMERGING COMPANIES
11.4 COMPETITIVE SCENARIO
11.4.1 KEY PRODUCT & SERVICE LAUNCHES
11.4.2 KEY ACQUISITIONS
11.4.3 KEY PARTNERSHIPS, AGREEMENTS, AND COLLABORATIONS
11.4.4 KEY EXPANSIONS
12 COMPANY PROFILES (Page No. - 101)
12.1 JUBILANT LIFE SCIENCES
12.2 CHARLES RIVER LABORATORIES INTERNATIONAL
12.3 IBM
12.4 CLARIVATE ANALYTICS
12.5 ACCENTURE
12.6 PERKINELMER
12.7 DASSAULT SYSTÈMES
12.8 EUROFINS SCIENTIFIC
12.9 EVOTEC AG
12.10 COGNIZANT
12.11 INFOSYS LIMITED
12.12 THERMO FISHER SCIENTIFIC
12.13 ALBANY MOLECULAR RESEARCH
12.14 SCHRÖDINGER
12.15 SELVITA
12.16 CERTARA
12.17 GVK BIOSCIENCES
12.18 OPENEYE SCIENTIFIC SOFTWARE
12.19 IO INFORMATICS
12.20 CDD
*Details on Business Overview, Products/Servies Offered, Recent Developments, SWOT Analysis, and MnM View might not be captured in case of unlisted companies.
13 APPENDIX (Page No. - 134)
13.1 DISCUSSION GUIDE
13.2 KNOWLEDGE STORE: MARKETSANDMARKETS’ SUBSCRIPTION PORTAL
13.3 AVAILABLE CUSTOMIZATIONS
13.4 RELATED REPORTS
13.5 AUTHOR DETAILS
LIST OF TABLES (124 Tables)
TABLE 1 DRUG DISCOVERY INFORMATICS MARKET, BY FUNCTION, 2017–2025 (USD MILLION)
TABLE 2 DRUG DISCOVERY INFORMATICS MARKET FOR SEQUENCING & TARGET DATA ANALYSIS, BY REGION, 2017–2025 (USD MILLION)
TABLE 3 NORTH AMERICA: DRUG DISCOVERY INFORMATICS MARKET FOR SEQUENCING & TARGET DATA ANALYSIS, BY COUNTRY, 2017–2025 (USD MILLION)
TABLE 4 EUROPE: DRUG DISCOVERY INFORMATICS MARKET FOR SEQUENCING & TARGET DATA ANALYSIS, BY COUNTRY, 2017–2025 (USD MILLION)
TABLE 5 APAC: DRUG DISCOVERY INFORMATICS MARKET FOR SEQUENCING & TARGET DATA ANALYSIS, BY COUNTRY, 2017–2025 (USD MILLION)
TABLE 6 DRUG DISCOVERY INFORMATICS MARKET FOR DOCKING, BY REGION, 2017–2025 (USD MILLION)
TABLE 7 NORTH AMERICA: DRUG DISCOVERY INFORMATICS MARKET FOR DOCKING, BY COUNTRY, 2017–2025 (USD MILLION)
TABLE 8 EUROPE: DRUG DISCOVERY INFORMATICS MARKET FOR DOCKING, BY COUNTRY, 2017–2025 (USD MILLION)
TABLE 9 APAC: DRUG DISCOVERY INFORMATICS MARKET FOR DOCKING, BY COUNTRY, 2017–2025 (USD MILLION)
TABLE 10 DRUG DISCOVERY INFORMATICS MARKET FOR MOLECULAR MODELING, BY REGION, 2017–2025 (USD MILLION)
TABLE 11 NORTH AMERICA: DRUG DISCOVERY INFORMATICS MARKET FOR MOLECULAR MODELING, BY COUNTRY, 2017–2025 (USD MILLION)
TABLE 12 EUROPE: DRUG DISCOVERY INFORMATICS MARKET FOR MOLECULAR MODELING, BY COUNTRY, 2017–2025 (USD MILLION)
TABLE 13 APAC: DRUG DISCOVERY INFORMATICS MARKET FOR MOLECULAR MODELING, BY COUNTRY, 2017–2025 (USD MILLION)
TABLE 14 DRUG DISCOVERY INFORMATICS MARKET FOR LIBRARY & DATABASE PREPARATION, BY REGION, 2017–2025 (USD MILLION)
TABLE 15 NORTH AMERICA: DRUG DISCOVERY INFORMATICS MARKET FOR LIBRARY & DATABASE PREPARATION, BY COUNTRY, 2017–2025 (USD MILLION)
TABLE 16 EUROPE: DRUG DISCOVERY INFORMATICS MARKET FOR LIBRARY & DATABASE PREPARATION, BY COUNTRY, 2017–2025 (USD MILLION)
TABLE 17 APAC: DRUG DISCOVERY INFORMATICS MARKET FOR LIBRARY & DATABASE PREPARATION, BY COUNTRY, 2017–2025 (USD MILLION)
TABLE 18 DRUG DISCOVERY INFORMATICS MARKET FOR OTHER FUNCTIONS, BY REGION, 2017–2025 (USD MILLION)
TABLE 19 NORTH AMERICA: DRUG DISCOVERY INFORMATICS MARKET FOR OTHER FUNCTIONS, BY COUNTRY, 2017–2025 (USD MILLION)
TABLE 20 EUROPE: DRUG DISCOVERY INFORMATICS MARKET FOR OTHER FUNCTIONS, BY COUNTRY, 2017–2025 (USD MILLION)
TABLE 21 APAC: DRUG DISCOVERY INFORMATICS MARKET FOR OTHER FUNCTIONS, BY COUNTRY, 2017–2025 (USD MILLION)
TABLE 22 DRUG DISCOVERY INFORMATICS MARKET, BY APPLICATION, 2017–2025 (USD MILLION)
TABLE 23 DRUG DISCOVERY INFORMATICS MARKET FOR DRUG DEVELOPMENT APPLICATIONS, BY REGION, 2017–2025 (USD MILLION)
TABLE 24 NORTH AMERICA: DRUG DISCOVERY INFORMATICS MARKET FOR DRUG DEVELOPMENT APPLICATIONS, BY COUNTRY, 2017–2025 (USD MILLION)
TABLE 25 EUROPE: DRUG DISCOVERY INFORMATICS MARKET FOR DRUG DEVELOPMENT APPLICATIONS, BY COUNTRY, 2017–2025 (USD MILLION)
TABLE 26 APAC: DRUG DISCOVERY INFORMATICS MARKET FOR DRUG DEVELOPMENT APPLICATIONS, BY COUNTRY, 2017–2025 (USD MILLION)
TABLE 27 DRUG DISCOVERY INFORMATICS MARKET FOR DRUG DISCOVERY APPLICATIONS, BY REGION, 2017–2025 (USD MILLION)
TABLE 28 NORTH AMERICA: DRUG DISCOVERY INFORMATICS MARKET FOR DRUG DISCOVERY APPLICATIONS, BY COUNTRY, 2017–2025 (USD MILLION)
TABLE 29 EUROPE: DRUG DISCOVERY INFORMATICS MARKET FOR DRUG DISCOVERY APPLICATIONS, BY COUNTRY, 2017–2025 (USD MILLION)
TABLE 30 APAC: DRUG DISCOVERY INFORMATICS MARKET FOR DRUG DISCOVERY APPLICATIONS, BY COUNTRY, 2017–2025 (USD MILLION)
TABLE 31 DRUG DISCOVERY INFORMATICS MARKET, BY SOLUTION, 2017–2025 (USD MILLION)
TABLE 32 DRUG DISCOVERY INFORMATICS MARKET FOR SOFTWARE, BY REGION, 2017–2025 (USD MILLION)
TABLE 33 NORTH AMERICA: DRUG DISCOVERY INFORMATICS MARKET FOR SOFTWARE, BY COUNTRY, 2017–2025 (USD MILLION)
TABLE 34 EUROPE: DRUG DISCOVERY INFORMATICS MARKET FOR SOFTWARE, BY COUNTRY, 2017–2025 (USD MILLION)
TABLE 35 APAC: DRUG DISCOVERY INFORMATICS MARKET FOR SOFTWARE, BY COUNTRY, 2017–2025 (USD MILLION)
TABLE 36 DRUG DISCOVERY INFORMATICS MARKET FOR SERVICES, BY REGION, 2017–2025 (USD MILLION)
TABLE 37 NORTH AMERICA: DRUG DISCOVERY INFORMATICS MARKET FOR SERVICES, BY COUNTRY, 2017–2025 (USD MILLION)
TABLE 38 EUROPE: DRUG DISCOVERY INFORMATICS MARKET FOR SERVICES, BY COUNTRY, 2017–2025 (USD MILLION)
TABLE 39 APAC: DRUG DISCOVERY INFORMATICS MARKET FOR SERVICES, BY COUNTRY, 2017–2025 (USD MILLION)
TABLE 40 DRUG DISCOVERY INFORMATICS MARKET, BY END USER,2017–2025 (USD MILLION)
TABLE 41 DRUG DISCOVERY INFORMATICS MARKET FOR PHARMACEUTICAL COMPANIES,BY REGION, 2017–2025 (USD MILLION)
TABLE 42 NORTH AMERICA: DRUG DISCOVERY INFORMATICS MARKET FOR PHARMACEUTICAL COMPANIES, BY COUNTRY, 2017–2025 (USD MILLION)
TABLE 43 EUROPE: DRUG DISCOVERY INFORMATICS MARKET FOR PHARMACEUTICAL COMPANIES, BY COUNTRY, 2017–2025 (USD MILLION)
TABLE 44 APAC: DRUG DISCOVERY INFORMATICS MARKET FOR PHARMACEUTICAL COMPANIES, BY COUNTRY, 2017–2025 (USD MILLION)
TABLE 45 DRUG DISCOVERY INFORMATICS MARKET FOR BIOTECHNOLOGY COMPANIES, BY REGION, 2017–2025 (USD MILLION)
TABLE 46 NORTH AMERICA: DRUG DISCOVERY INFORMATICS MARKET FOR BIOTECHNOLOGY COMPANIES, BY COUNTRY, 2017–2025 (USD MILLION)
TABLE 47 EUROPE: DRUG DISCOVERY INFORMATICS MARKET FOR BIOTECHNOLOGY COMPANIES, BY COUNTRY, 2017–2024 (USD MILLION)
TABLE 48 APAC: DRUG DISCOVERY INFORMATICS MARKET FOR BIOTECHNOLOGY COMPANIES, BY COUNTRY, 2017–2025 (USD MILLION)
TABLE 49 DRUG DISCOVERY INFORMATICS MARKET FOR CONTRACT RESEARCH ORGANIZATIONS, BY REGION, 2017–2025 (USD MILLION)
TABLE 50 NORTH AMERICA: DRUG DISCOVERY INFORMATICS MARKET FOR CONTRACT RESEARCH ORGANIZATIONS, BY COUNTRY, 2017–2025 (USD MILLION)
TABLE 51 EUROPE: DRUG DISCOVERY INFORMATICS MARKET FOR CONTRACT RESEARCH ORGANIZATIONS, BY COUNTRY, 2017–2025 (USD MILLION)
TABLE 52 APAC: DRUG DISCOVERY INFORMATICS MARKET FOR CONTRACT RESEARCH ORGANIZATIONS, BY COUNTRY, 2017–2025 (USD MILLION)
TABLE 53 DRUG DISCOVERY INFORMATICS MARKET FOR OTHER END USERS, BY REGION, 2017–2025 (USD MILLION)
TABLE 54 NORTH AMERICA: DRUG DISCOVERY INFORMATICS MARKET FOR OTHER END USERS, BY COUNTRY, 2017–2025 (USD MILLION)
TABLE 55 EUROPE: DRUG DISCOVERY INFORMATICS MARKET FOR OTHER END USERS, BY REGION, 2017–2025 (USD MILLION)
TABLE 56 APAC: DRUG DISCOVERY INFORMATICS MARKET FOR OTHER END USERS, BY COUNTRY, 2017–2025 (USD MILLION)
TABLE 57 DRUG DISCOVERY INFORMATICS MARKET, BY REGION, 2017–2025 (USD MILLION)
TABLE 58 NORTH AMERICA: DRUG DISCOVERY INFORMATICS MARKET, BY COUNTRY, 2017–2025 (USD MILLION)
TABLE 59 NORTH AMERICA: DRUG DISCOVERY INFORMATICS MARKET, BY FUNCTION, 2017–2025 (USD MILLION)
TABLE 60 NORTH AMERICA: DRUG DISCOVERY INFORMATICS MARKET, BY SOLUTION, 2017–2025 (USD MILLION)
TABLE 61 NORTH AMERICA: DRUG DISCOVERY INFORMATICS MARKET, BY APPLICATION, 2017–2025 (USD MILLION)
TABLE 62 NORTH AMERICA: DRUG DISCOVERY INFORMATICS MARKET, BY END USER, 2017–2025 (USD MILLION)
TABLE 63 US: DRUG DISCOVERY INFORMATICS MARKET, BY FUNCTION, 2017–2025 (USD MILLION)
TABLE 64 US: DRUG DISCOVERY INFORMATICS MARKET, BY SOLUTION, 2017–2025 (USD MILLION)
TABLE 65 US: DRUG DISCOVERY INFORMATICS MARKET, BY APPLICATION, 2017–2025 (USD MILLION)
TABLE 66 US: DRUG DISCOVERY INFORMATICS MARKET, BY END USER, 2017–2025 (USD MILLION)
TABLE 67 CANADA: DRUG DISCOVERY INFORMATICS MARKET, BY FUNCTION,2017–2025 (USD MILLION)
TABLE 68 CANADA: DRUG DISCOVERY INFORMATICS MARKET, BY SOLUTION, 2017–2025 (USD MILLION)
TABLE 69 CANADA: DRUG DISCOVERY INFORMATICS MARKET, BY APPLICATION, 2017–2025 (USD MILLION)
TABLE 70 CANADA: DRUG DISCOVERY INFORMATICS MARKET, BY END USER,2017–2025 (USD MILLION)
TABLE 71 EUROPE: DRUG DISCOVERY INFORMATICS MARKET, BY COUNTRY, 2017–2025 (USD MILLION)
TABLE 72 EUROPE: DRUG DISCOVERY INFORMATICS MARKET, BY FUNCTION, 2017–2025 (USD MILLION)
TABLE 73 EUROPE: DRUG DISCOVERY INFORMATICS MARKET, BY SOLUTION, 2017–2025 (USD MILLION)
TABLE 74 EUROPE: DRUG DISCOVERY INFORMATICS MARKET, BY APPLICATION, 2017–2025 (USD MILLION)
TABLE 75 EUROPE: DRUG DISCOVERY INFORMATICS MARKET, BY END USER, 2017–2025 (USD MILLION)
TABLE 76 UK: DRUG DISCOVERY INFORMATICS MARKET, BY FUNCTION, 2017–2025 (USD MILLION)
TABLE 77 UK: DRUG DISCOVERY INFORMATICS MARKET, BY SOLUTION, 2017–2025 (USD MILLION)
TABLE 78 UK: DRUG DISCOVERY INFORMATICS MARKET, BY APPLICATION, 2017–2025 (USD MILLION)
TABLE 79 UK: DRUG DISCOVERY INFORMATICS MARKET, BY END USER, 2017–2025 (USD MILLION)
TABLE 80 FRANCE: DRUG DISCOVERY INFORMATICS MARKET, BY FUNCTION, 2017–2025 (USD MILLION)
TABLE 81 FRANCE: DRUG DISCOVERY INFORMATICS MARKET, BY SOLUTION, 2017–2025 (USD MILLION)
TABLE 82 FRANCE: DRUG DISCOVERY INFORMATICS MARKET, BY APPLICATION, 2017–2025 (USD MILLION)
TABLE 83 FRANCE: DRUG DISCOVERY INFORMATICS MARKET, BY END USER, 2017–2025 (USD MILLION)
TABLE 84 GERMANY: DRUG DISCOVERY INFORMATICS MARKET, BY FUNCTION, 2017–2025 (USD MILLION)
TABLE 85 GERMANY: DRUG DISCOVERY INFORMATICS MARKET, BY SOLUTION, 2017–2025 (USD MILLION)
TABLE 86 GERMANY: DRUG DISCOVERY INFORMATICS MARKET, BY APPLICATION, 2017–2025 (USD MILLION)
TABLE 87 GERMANY: DRUG DISCOVERY INFORMATICS MARKET, BY END USER, 2017–2025 (USD MILLION)
TABLE 88 ITALY: DRUG DISCOVERY INFORMATICS MARKET, BY FUNCTION, 2017–2025 (USD MILLION)
TABLE 89 ITALY: DRUG DISCOVERY INFORMATICS MARKET, BY SOLUTION, 2017–2025 (USD MILLION)
TABLE 90 ITALY: DRUG DISCOVERY INFORMATICS MARKET, BY APPLICATION, 2017–2025 (USD MILLION)
TABLE 91 ITALY: DRUG DISCOVERY INFORMATICS MARKET, BY END USER, 2017–2025 (USD MILLION)
TABLE 92 SPAIN: DRUG DISCOVERY INFORMATICS MARKET, BY FUNCTION, 2017–2025 (USD MILLION)
TABLE 93 SPAIN: DRUG DISCOVERY INFORMATICS MARKET, BY SOLUTION, 2017–2025 (USD MILLION)
TABLE 94 SPAIN: DRUG DISCOVERY INFORMATICS MARKET, BY APPLICATION, 2017–2025 (USD MILLION)
TABLE 95 SPAIN: DRUG DISCOVERY INFORMATICS MARKET, BY END USER, 2017–2025 (USD MILLION)
TABLE 96 ROE: DRUG DISCOVERY INFORMATICS MARKET, BY FUNCTION, 2017–2025 (USD MILLION)
TABLE 97 ROE: DRUG DISCOVERY INFORMATICS MARKET, BY SOLUTION, 2017–2025 (USD MILLION)
TABLE 98 ROE: DRUG DISCOVERY INFORMATICS MARKET, BY APPLICATION, 2017–2025 (USD MILLION)
TABLE 99 ROE: DRUG DISCOVERY INFORMATICS MARKET, BY END USER, 2017–2025 (USD MILLION)
TABLE 100 APAC: DRUG DISCOVERY INFORMATICS MARKET, BY COUNTRY, 2017–2025 (USD MILLION)
TABLE 101 APAC: DRUG DISCOVERY INFORMATICS MARKET, BY FUNCTION, 2017–2025 (USD MILLION)
TABLE 102 APAC: DRUG DISCOVERY INFORMATICS MARKET, BY SOLUTION, 2017–2025 (USD MILLION)
TABLE 103 APAC: DRUG DISCOVERY INFORMATICS MARKET, BY APPLICATION, 2017–2025 (USD MILLION)
TABLE 104 APAC: DRUG DISCOVERY INFORMATICS MARKET, BY END USER, 2017–2025 (USD MILLION)
TABLE 105 CHINA: DRUG DISCOVERY INFORMATICS MARKET, BY FUNCTION, 2017–2025 (USD MILLION)
TABLE 106 CHINA: DRUG DISCOVERY INFORMATICS MARKET, BY SOLUTION,2017–2025 (USD MILLION)
TABLE 107 CHINA: DRUG DISCOVERY INFORMATICS MARKET, BY APPLICATION, 2017–2025 (USD MILLION)
TABLE 108 CHINA: DRUG DISCOVERY INFORMATICS MARKET, BY END USER, 2017–2025 (USD MILLION)
TABLE 109 INDIA: DRUG DISCOVERY INFORMATICS MARKET, BY FUNCTION, 2017–2025 (USD MILLION)
TABLE 110 INDIA: DRUG DISCOVERY INFORMATICS MARKET, BY SOLUTION, 2017–2025 (USD MILLION)
TABLE 111 INDIA: DRUG DISCOVERY INFORMATICS MARKET, BY APPLICATION, 2017–2025 (USD MILLION)
TABLE 112 INDIA: DRUG DISCOVERY INFORMATICS MARKET, BY END USER, 2017–2025 (USD MILLION)
TABLE 113 JAPAN: DRUG DISCOVERY INFORMATICS MARKET, BY FUNCTION,2017–2025 (USD MILLION)
TABLE 114 JAPAN: DRUG DISCOVERY INFORMATICS MARKET, BY SOLUTION, 2017–2025 (USD MILLION)
TABLE 115 JAPAN: DRUG DISCOVERY INFORMATICS MARKET, BY APPLICATION, 2017–2025 (USD MILLION)
TABLE 116 JAPAN: DRUG DISCOVERY INFORMATICS MARKET, BY END USER, 2017–2025 (USD MILLION)
TABLE 117 ROAPAC: DRUG DISCOVERY INFORMATICS MARKET, BY FUNCTION, 2017–2025 (USD MILLION)
TABLE 118 ROAPAC: DRUG DISCOVERY INFORMATICS MARKET, BY SOLUTION, 2017–2025 (USD MILLION)
TABLE 119 ROAPAC: DRUG DISCOVERY INFORMATICS MARKET, BY APPLICATION, 2017–2025 (USD MILLION)
TABLE 120 ROAPAC: DRUG DISCOVERY INFORMATICS MARKET, BY END USER, 2017–2025 (USD MILLION)
TABLE 121 ROW: DRUG DISCOVERY INFORMATICS MARKET, BY FUNCTION, 2017–2025 (USD MILLION)
TABLE 122 ROW: DRUG DISCOVERY INFORMATICS MARKET, BY SOLUTION, 2017–2025 (USD MILLION)
TABLE 123 ROW: DRUG DISCOVERY INFORMATICS MARKET, BY APPLICATION, 2017–2025 (USD MILLION)
TABLE 124 ROW: DRUG DISCOVERY INFORMATICS MARKET, BY END USER, 2017–2025 (USD MILLION)
LIST OF FIGURES (32 Figures)
FIGURE 1 BREAKDOWN OF PRIMARIES: DRUG DISCOVERY INFORMATICS MARKET
FIGURE 2 DATA TRIANGULATION METHODOLOGY
FIGURE 3 MARKET SIZE ESTIMATION: APPROACH 1 (BOTTOM-UP APPROACH)
FIGURE 4 DRUG DISCOVERY INFORMATICS: MARKET SIZE (USD BILLION)
FIGURE 5 DRUG DISCOVERY INFORMATICS MARKET: CAGR PROJECTIONS
FIGURE 6 CAGR PROJECTIONS FROM THE ANALYSIS OF DEMAND-SIDE DRIVERS, OPPORTUNITIES, & CHALLENGES
FIGURE 7 DRUG DISCOVERY INFORMATICS MARKET SHARE & CAGR, BY FUNCTION
FIGURE 8 DRUG DISCOVERY INFORMATICS MARKET, BY END USER, 2019−2025
FIGURE 9 DRUG DISCOVERY INFORMATICS MARKET, BY SOLUTION, 2019 VS. 2025 (USD MILLION)
FIGURE 10 GEOGRAPHICAL SNAPSHOT OF THE DRUG DISCOVERY INFORMATICS MARKET
FIGURE 11 RISING R&D EXPENDITURE IS THE PRIMARY GROWTH DRIVER FOR THE MARKET
FIGURE 12 SOFTWARE SEGMENT ACCOUNTED FOR THE LARGEST SHARE OF THE NORTH AMERICAN DRUG DISCOVERY INFORMATICS MARKET IN 2019
FIGURE 13 SEQUENCING & TARGET DATA ANALYSIS SEGMENT ACCOUNTED FOR THE LARGEST MARKET SHARE IN 2019
FIGURE 14 PHARMACEUTICAL COMPANIES ACCOUNTED FOR THE LARGEST SHARE OF THE MARKET IN 2019
FIGURE 15 DRUG DISCOVERY INFORMATICS MARKET : MARKET DYNAMICS
FIGURE 16 DRUG DISCOVERY INFORMATICS MARKET, BY REGION, 2019 VS. 2024
FIGURE 17 NORTH AMERICA: DRUG DISCOVERY INFORMATICS MARKET SNAPSHOT
FIGURE 18 APAC: DRUG DISCOVERY INFORMATICS MARKET SNAPSHOT
FIGURE 19 RANK OF COMPANIES IN THE DRUG DISCOVERY INFORMATICS MARKET, 2018
FIGURE 20 DRUG DISCOVERY INFORMATICS MARKET (GLOBAL) COMPETITIVELEADERSHIP MAPPING, 2018
FIGURE 21 JUBILANT LIFE SCIENCES LIMITED: COMPANY SNAPSHOT (2019)
FIGURE 22 CHARLES RIVER: COMPANY SNAPSHOT (2018)
FIGURE 23 IBM: COMPANY SNAPSHOT (2018)
FIGURE 24 CLARIVATE ANALYTICS: COMPANY SNAPSHOT (2019)
FIGURE 25 ACCENTURE PLC: COMPANY SNAPSHOT : 2019
FIGURE 26 PERKINELMER: COMPANY SNAPSHOT (2018)
FIGURE 27 DASSAULT SYSTÈMES: COMPANY SNAPSHOT (2018)
FIGURE 28 EUROFINS SCIENTIFIC: COMPANY SNAPSHOT (2019)
FIGURE 29 EVOTEC: COMPANY SNAPSHOT (2018)
FIGURE 30 COGNIZANT: COMPANY SNAPSHOT (2019)
FIGURE 31 INFOSYS LIMITED: COMPANY SNAPSHOT (2019)
FIGURE 32 THERMO FISHER SCIENTIFIC: COMPANY SNAPSHOT: 2018
The study involved two major activities in estimating the current size of the drug discovery informatics market. Exhaustive research was conducted to collect information on the market as well as its peer and parent markets. The next step was to validate these findings, assumptions, and sizing estimates with industry experts across the value chain through primary research. Both revenue-based and service-based estimation approaches were employed to estimate the complete market size. After that, market breakdown and data triangulation procedures were used to estimate the size of the segments and subsegments.
Secondary Research
In the secondary research process, various sources such as Hoovers, Bloomberg BusinessWeek, Forbes, and Dun & Bradstreet were referred to identify and collect information useful for this technical, market-oriented, and commercial study of the drug discovery informatics. These secondary sources include government sources, such as Pharmaceutical Research and Manufacturers of America (PhRMA), American Association of Pharmaceutical Scientists (AAPS), National Centre for Biotechnology Information (NCBI), European Federation of Pharmaceutical Industries and Associations (EFPIA), National Institutes of Health (NIH), International Federation of Pharmaceutical and Manufacturers Associations (IFPMA), Clinical Research Society (CRS), US Food and Drug Administration (FDA), Annual Reports, SEC Filings, Investor Presentations, Expert Interviews, and MarketsandMarkets Analysis. Secondary sources also include corporate & regulatory filings (such as annual reports, SEC filings, investor presentations, and financial statements); business magazines & research journals; press releases; and trade, business, and professional associations, among others.
Primary Research
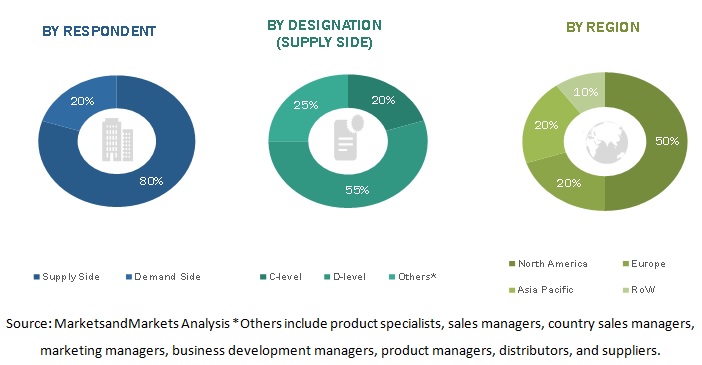
The drug discovery informatics market comprises several stakeholders such as Research institutes, Drug discovery informatics solution providers, Pharmaceutical and biotechnology companies, contract research organizations, Government associations and Healthcare associations/institutes, drug discovery informatics service and software providing companies, market research and consulting firms, healthcare service providers and ambulatory surgery centers, CROs, and government bodies and municipal corporations. Several primary interviews were conducted with market experts from both the demand side (such as personnel from managers in healthcare provider organizations) and the supply side (such as C-level and D-level executives, product managers, marketing & sales managers of key manufacturers, distributors, and channel partners, among others) across four major regions—North America, Europe, Asia Pacific, and the Rest of the World. Approximately 80% and 20% of primary interviews were conducted with supply-side and demand-side participants, respectively. This primary data was collected through questionnaires, e-mails, online surveys, personal interviews, and telephonic interviews.
To know about the assumptions considered for the study, download the pdf brochure
Market Size Estimation
For calculating the global market value, segmental revenues were arrived at based on the revenue mapping of major players active in the drug discovery informatics market. This process involved the following steps:
- Generating a list of the major global players operating in the drug discovery informatics market.
- Mapping the annual revenues generated by major global players from the drug discovery informatics market (or the nearest reported business unit/product, service category)
- Estimating the revenue from the related market and extrapolating to the global number as of 2018.
- Calculating 100% of the global market value of drug discovery informatics market based on bottom-up approach and CAGR projections.
Data Triangulation
After arriving at the overall market size-using the market size estimation processes explained above-the market was split into several segments and subsegments. To complete the overall market engineering process and arrive at the exact statistics of each market segment and subsegments, data triangulation and market breakdown procedures were employed, wherever applicable. The data was triangulated by studying various factors and trends from both the demand and supply sides of the drug discovery informatics market.
Report Objectives
- To define, describe, and forecast the global drug discovery informatics market, by application, function, solution, end user and region.
- To provide detailed information regarding the major factors influencing the growth of the global drug discovery informatics market (drivers, restraints, opportunities, and challenges)
- To analyze micromarkets with respect to individual growth trends, prospects, and contributions to the overall global drug discovery informatics market
- To analyze opportunities in the market for stakeholders and provide details of the competitive landscape for market leaders
- To forecast the size (by value) of market segments with respect to four main regions (along with countries)—North America, Europe, Asia Pacific, and the Rest of the World
- To profile key players and comprehensively analyze their core competencies in terms of key market developments and growth strategies
- To track and analyze competitive developments such as product and service launches, acquisitions, agreements, partnerships, collaborations, and expansions in the global drug discovery informatics market
Available Customizations
With the given market data, MarketsandMarkets offers customizations as per the company’s specific needs. The following customization options are available for the report:
Product Analysis
- Product matrix, which gives a detailed comparison of the product portfolios of the top five companies
Geographic Analysis
- Further breakdown of the Asia Pacific drug discovery informatics market into India, China, Japan, and the RoAPAC
- Further breakdown of the RoW drug discovery informatics market into Latin America and the Middle East & Africa
- Further breakdown of the European drug discovery informatics market into Spain and Italy
Company Information
- Detailed analysis and profiling of additional market players (Up to 5)

 Generating Response ...


Growth opportunities and latent adjacency in Drug Discovery Informatics Market