
Malt Extracts and Ingredients Market by Product (Extracts and Ingredients), Source (Soy, Wheat, and Rye), Grade (Standard malt and Specialty malt), Application (Beverages, Food, and Pharmaceuticals), Form (Dry and Liquid), Region � Global Forecast to 2025
Market Segmentation
| Report Metrics | Details |
|
Market size available for years |
2020 - 2025 |
|
CAGR % |
3 |
Top 10 companies in Malt Extracts and Ingredients Market


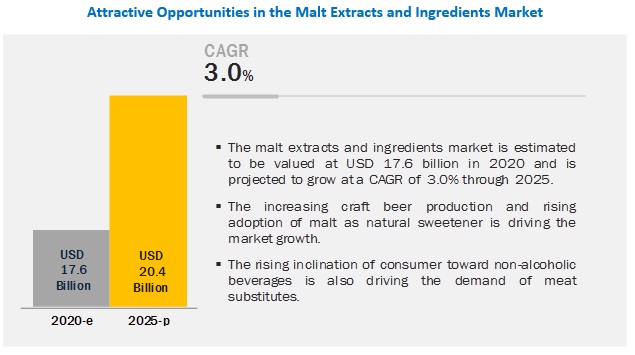
[173 Pages Report] The global malt extracts and ingredients market is estimated to account for USD 17.6 billion in 2020 and is projected to reach USD 20.4 billion by 2025, recording a CAGR of 3.0% during the forecast period. The market is primarily driven by the increasing demand for craft beers and natural sweeteners.
Higher demand for beer contributes to the growth of the malt extracts and ingredients market, by source
Malt is mainly produced from barley. However, wheat, rye, sorghum, and oats are also some of the sources of malt. Barley malt is mainly used to produce beer, whiskey, malt vinegar, and malted milk. Barley is one of the most popular and traditional sources for malt ingredients due to its high-protein content and ease of malting. This is due to the extensive use of barley in the beer industry and the rising awareness of the health benefits of barley-based beverages. These factors are expected to prove positive for the barley segment during the forecast period.
Based on the product, the extracts segment is projected to witness higher growth in the malt extracts and ingredients market during the forecast period
Malt extract is a processed sweetening agent, which is obtained from further processing of malt ingredients. There are several classes of malt extracts, such as standard malt extracts, specialty malt extracts, dark malt extract, and light malt extracts.
The Asia Pacific is projected to account for the largest share in the malt extracts and ingredients market for the extracts segment during the forecast period. This is due to their increasing adoption in bakery products as natural sweeteners.
Based on grade, the specialty malt segment is projected to witness the highest growth in the malt extracts and ingredients market
Specialty malt is characterized by low enzymatic activities and is used to enhance flavor. It can be used to impart color, enhance flavor, and grant functionalities to various baked goods, bars, cereals, cookies, bars, and many other bakery products. The rising adoption of malt as a natural sweetener and additive and its increasing usage in the pharmaceutical industry has increased the demand for specialty malt. As a result, the specialty malt segment is projected to account for a higher market share during the forecast period.
By form, the dry segment is projected to witness higher growth in the malt extracts and ingredients market
Dry malt is used for maximum applications. It is available in flour, flakes, and in the powder form. Malt flour is specially conditioned with a high concentration of natural enzymes majorly applied in the bakery and confectionery products. It improves fermentation, increases air retention, and enhances yeast performance. Malt flakes are a natural source of fibers and flavors. Malted flakes add texture to products such as bread and rolls. The downside of the dry malt is its hygroscopic property. Therefore, it should be stored in a dark and dry environment and should be protected from humidity. As a result of these factors, the dry segment is projected to account for a larger market share during the forecast period.
Based on application, the beverages segment is projected to dominate the malt extracts and ingredients market
Malt is an essential component in the beer industry. It provides carbohydrates and sugar, which are necessary to give beer its distinctive flavor and alcohol content. Different types of malt are used to impart different flavors, textures, and colors to the beer. They are responsible for imparting the aroma and mouthfeel to alcoholic beverages. Many other alcoholic beverages, such as whiskey and other spirits, have malt as their base ingredient. Due to this factor, the beverages segment is projected to account for the largest market share during the forecast period.
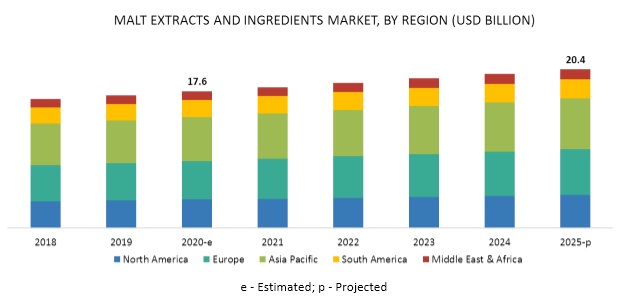
Europe is projected to witness the highest growth in the malt extracts and ingredients market during the forecast period
Europe�s growth is attributed to the increasing awareness of people about healthy dietary habits. The key factors driving growth in the European region are the increase in the consumption of beer and the rise in craft breweries. These factors have led to a surge in demand for malt ingredients in the region. In addition, the different uses of malts in the food and non-alcoholic beverage industries is a key factor that is projected to drive the growth of the malt extracts and ingredients market. Established and local players have the opportunity to capitalize on the growth potential in the malt extracts and ingredients market. Malt is a primary ingredient used in breweries. However, since the past few years, an increase in the awareness pertaining to the health benefits of malts and their use in various food and beverage applications has increased. These factors have opened various opportunities for this region in the malt extracts and ingredients market.
Key Market Players
Many domestic and global players provide malt extracts and ingredients of various types across the world. Major manufacturers have their presence in the North American and European countries. The key companies in the malt extracts and ingredients market are Groupe Soufflet (France), Muntons PLC (US), Viking Malt (Finland), Diastatische Producten (Netherlands), Laihian Mallas (Finland), Rahr corporations (US), Graincorp Limited (Australia), Malteurop Group (France), Maltexco (Chile), Malt products (US), Holland Malt (Netherlands), and Boortmalt (Belgium).
Get online access to the report on the World's First Market Intelligence Cloud
- Easy to Download Historical Data & Forecast Numbers
- Company Analysis Dashboard for high growth potential opportunities
- Research Analyst Access for customization & queries
- Competitor Analysis with Interactive dashboard
- Latest News, Updates & Trend analysis
Request Sample Scope of the Report
Get online access to the report on the World's First Market Intelligence Cloud
- Easy to Download Historical Data & Forecast Numbers
- Company Analysis Dashboard for high growth potential opportunities
- Research Analyst Access for customization & queries
- Competitor Analysis with Interactive dashboard
- Latest News, Updates & Trend analysis

|
Report Metric |
Details |
|
Market size available for years |
2018-2025 |
|
Base year considered |
2019 |
|
Forecast period |
2020-2025 |
|
Forecast units |
Value (USD Billion) and Volume (tons) |
|
Segments covered |
Product, Source, Grade, Application, and Form |
|
Geographies covered |
North America, Europe, Asia Pacific, South America, Middle East & Africa |
|
Companies covered |
GrainCorp (Australia), Malteurop (France), Rahr Corporation (US), Boortmalt (Belgium), Groupe Soufflet (France), Maltproducts (US), Holland Malt (Netherlands), Maltexco (Chile), Barmalt (India), IREKS (Germany), Muntons PLC (US), Simpsons (UK), Viking Malt (Finland), Agraria (Argentina), Puremalt (Scotland), Cerex (Netherlands), EDME Ltd. (England) Imperial Malt (India), Diastatische Producten (Netherlands), and Laihian Mallas (Finland) |
This research report categorizes the malt extracts and ingredients market based on product, source, grade, application, form, and region.
Based on the product, the malt extracts and ingredients market has been segmented as follows:
- Extracts
- Ingredients
Based on the source, the malt extracts and ingredients market has been segmented as follows:
- Barley
- Wheat
- Rye
- Others (rice, oats, sorghum, millets, and corn)
Based on grade, the malt extracts and ingredients market has been segmented as follows:
- Standard Malt
- Specialty Malt:
- Crystal
- Roasted
- Dark
- Others (specially kilned malts)
Based on application, the malt extracts and ingredients market has been segmented as follows:
- Beverages:
- Alcoholic
- Non-alcoholic
- Food
- Pharmaceuticals
- Others (pet food and personal care products)
Based on form, the malt extracts and ingredients market has been segmented as follows:
- Dry
- Liquid
Based on the region, the malt extracts and ingredients market has been segmented as follows:
- North America
- Europe
- Asia Pacific
- South America
- Middle East & Africa
Recent Developments
- In February 2020, BSG entered into a partnership with Leopold Bros. (US) to distribute a new line of small-batch, handmade malts. Through this, it can enter into the emerging craft brewing and handmade beer markets.
- In November 2019, Axereal acquired the malt business of Cargill on behalf of its subsidiary, Boortmalt.
- In September 2019, Malteurop constructed a new malthouse facility in Meoqui, Chihuahua, North of Mexico, which will be functional by 2021.
- In March 2019, Groupe Soufflet established a malt house in Addis Ababa, Ethiopia. It is aimed at developing a local industry, which can increase the production capacity to 110,000 tons.
- In December 2019, BSG launched NZH-107, which is a proprietary experimental release. It is developed jointly between New Zealand Hops (New Zealand), Ltd., and Brewers Supply Group.
Key questions addressed by the report:
- Which region will account for the largest share in the malt extracts and ingredients market?
- How would the less availability of infrastructure impact the growth of the malt extracts and ingredients market globally?
- What are the trends and factors responsible for influencing the adoption rate of malt extracts and ingredients in key emerging countries?
- What is the level of support offered by governments across these countries to manufacturers?
- Which are the key players in the market, and how intense is the competition?
Frequently Asked Questions (FAQ):
What is the report�s coverage in terms of graded malt extracts? Do you provide an in-depth analysis in terms of specialty ingredients?
The report includes an overall study of malt extracts and ingredients on the basis of grades which have been segmented as follows,
- Standard Malt
- Specialty Malt
- Crystal
- Roasted
- Dark
- Others (Kilned Malts)
Do you provide a competitive analysis into the activities of current market players in the malt extracts and ingredients market?
The report includes a full competitive analysis into the activities of current market players including the developments. The classifications include the following,
- Competitive Leadership Mapping (Top 25 and SMEs)
- Strength of product portfolio
- Business Strategy Excellence
- Ranking of key players
- Competitive scenario
Does the report consist of B2C estimation?
We need further bifurcation of the market by key countries in the South East Asian region.
What is the leading application in the malt extracts and ingredients market?
The beverages segment was the highest revenue contributor to the market, with USD 16,220.9 million in 2020, and is estimated to reach USD 18,812.7 million by 2025, with a CAGR of 3.0%. Food segment is estimated to reach USD 1,224.1 million by 2025, at a significant CAGR of 3.2% during the forecast period.
What is the estimated industry size of malt extracts and ingredients?
What is the leading grade of malt extracts and ingredients market?
To speak to our analyst for a discussion on the above findings, click Speak to Analyst
TABLE OF CONTENTS
1 INTRODUCTION (Page No. - 18)
1.1 OBJECTIVES OF THE STUDY
1.2 MARKET DEFINITION
1.3 STUDY SCOPE
1.3.1 MARKET SEGMENTATION
1.3.2 REGIONS COVERED
1.4 PERIODIZATION CONSIDERED
1.5 CURRENCY CONSIDERED
1.6 UNITS CONSIDERED
1.7 STAKEHOLDERS
2 RESEARCH METHODOLOGY (Page No. - 22)
2.1 RESEARCH DATA
2.1.1 SECONDARY DATA
2.1.1.1 Key data from secondary sources
2.1.2 PRIMARY DATA
2.1.2.1 Breakdown of primaries
2.1.2.2 Key industry insights
2.2 MARKET SIZE ESTIMATION
2.3 DATA TRIANGULATION
2.4 ASSUMPTIONS/HYPOTHESIS FOR THE STUDY
2.5 LIMITATIONS OF THE STUDY
3 EXECUTIVE SUMMARY (Page No. - 30)
4 PREMIUM INSIGHTS (Page No. - 35)
4.1 ATTRACTIVE OPPORTUNITIES IN THE MALT EXTRACTS AND INGREDIENTS MARKET
4.2 MALT EXTRACTS AND INGREDIENTS MARKET, BY REGION
4.3 MALT EXTRACTS AND INGREDIENTS MARKET, BY SOURCE
4.4 MALT EXTRACTS AND INGREDIENTS MARKET, BY APPLICATION
4.5 ASIA PACIFIC: MALT EXTRACTS AND INGREDIENTS MARKET, BY APPLICATION & COUNTRY
5 MARKET OVERVIEW (Page No. - 39)
5.1 INTRODUCTION
5.2 MARKET DYNAMICS
5.2.1 DRIVERS
5.2.1.1 Rising adoption of malt extracts and ingredients in the food & beverage industry
5.2.1.1.1 Food industry
5.2.1.1.2 Non-alcoholic beverage industry
5.2.1.2 Increasing demand for natural sweeteners
5.2.1.3 Increasing expansion strategy by malt extract and ingredient manufacturers
5.2.2 RESTRAINTS
5.2.2.1 Fluctuating beer market
5.2.2.2 Quality of barley and seasonal variations
5.2.3 OPPORTUNITIES
5.2.3.1 Emerging markets illustrate the great potential for malt extracts and ingredients
5.2.3.2 Increasing popularity of craft beer
5.2.3.3 Rising demand for organic malt extracts and ingredients
5.2.4 CHALLENGES
5.2.4.1 Supply of counterfeit malt as well as equipment
5.2.4.2 Price pressure on malt, owing to concerns in the distribution network
5.3 YC & YCC SHIFT
5.4 SUPPLY CHAIN
6 MALT EXTRACTS AND INGREDIENTS MARKET, BY PRODUCT (Page No. - 49)
6.1 INTRODUCTION
6.2 INGREDIENTS
6.2.1 INGREDIENTS ARE MAJORLY USED FOR ALCOHOLIC BEVERAGES
6.3 EXTRACTS
6.3.1 EXTRACTS ARE USED AS FLAVORING AND BROWNING AGENTS
7 MALT EXTRACTS AND INGREDIENTS MARKET, BY SOURCE (Page No. - 54)
7.1 INTRODUCTION
7.2 BARLEY
7.2.1 OVER 20% OF THE GLOBAL BARLEY PRODUCTION IS DIRECTED TOWARD MALT PRODUCTION
7.2.2 GLOBAL PRODUCTION OF BARLEY PER 1000 TONNES
7.3 WHEAT
7.3.1 WHEAT MALT IS POPULAR IN THE EUROPEAN REGION DUE TO ITS HIGH PRODUCTION
7.4 RYE
7.4.1 RYE IS ONE OF THE MOST PREFERRED CHOICES FOR CRAFT BEER
7.5 OTHERS
8 MALT EXTRACTS AND INGREDIENTS MARKET, BY GRADE (Page No. - 63)
8.1 INTRODUCTION
8.2 STANDARD
8.2.1 STANDARD MALT FIND SIGNIFICANT APPLICATION IN THE BREWING INDUSTRY
8.3 SPECIALTY
8.3.1 SPECIALTY MALT TO HAVE THE HIGHEST APPLICATION IN THE BAKERY AND CONFECTIONERY INDUSTRIES
8.3.2 CRYSTAL
8.3.2.1 Crystal malt imparts caramel-like flavor to classic beers
8.3.3 ROASTED
8.3.3.1 Roasted malt is versatile in nature and finds use in a variety of applications
8.3.4 DARK
8.3.4.1 Dark malts are used to give a sharp taste to recipes
8.3.5 OTHER SPECIALTY MALTS
9 MALT EXTRACTS AND INGREDIENTS MARKET, BY FORM (Page No. - 70)
9.1 INTRODUCTION
9.2 DRY
9.2.1 THE DRY FORM IS POPULAR DUE TO ITS HIGHER SHELF LIFE AND EASIER TRANSPORTATION
9.3 LIQUID MALT
9.3.1 LIQUID MALT IS IN DEMAND DUE TO RISE IN HOME BREWERY
10 MALT EXTRACTS AND INGREDIENTS MARKET, BY APPLICATION (Page No. - 73)
10.1 INTRODUCTION
10.2 BEVERAGES
10.3 ALCOHOLIC BEVERAGES
10.3.1 ALCOHOLIC BEVERAGES DOMINATE THE APPLICATION FOR MALT INGREDIENTS
10.4 NON-ALCOHOLIC BEVERAGES
10.4.1 NON-BEER DRINKING NATIONS ARE DRIVING THE MARKET FOR NON-ALCOHOLIC MALT-BASED DRINKS
10.5 FOOD
10.5.1 MALT INGREDIENTS ARE HIGH IN DEMAND IN THE BAKERY & CONFECTIONERY INDUSTRY
10.6 PHARMACEUTICALS
10.6.1 LEADING A HEALTHY LIFESTYLE POPULARIZES THE USAGE OF MALT-BASED SUPPLEMENTS AND MEDICINES
10.7 OTHER APPLICATIONS
11 MALT EXTRACTS AND INGREDIENTS MARKET, BY REGION (Page No. - 83)
11.1 INTRODUCTION
11.2 NORTH AMERICA
11.2.1 US
11.2.1.1 Rising demand for craft beer to drive the growth of the market
11.2.2 CANADA
11.2.2.1 Increasing export demand for barley to drive market growth in Canada
11.2.3 MEXICO
11.2.3.1 Popularity of the alternatives of alcoholic beverages in the country to drive market growth
11.3 EUROPE
11.3.1 GERMANY
11.3.1.1 High-income levels of consumers to drive market growth
11.3.2 UK
11.3.2.1 Being the second-largest producer of beer in Europe, the growth potential for manufacturers remains high in the UK
11.3.3 FRANCE
11.3.3.1 Availability of a wide variety of beer and bakery applications to drive market growth
11.3.4 RUSSIA
11.3.4.1 Increase in demand for innovative food products to drive market growth
11.3.5 SPAIN
11.3.5.1 Non-alcoholic malt-based drinks to drive market growth
11.3.6 POLAND
11.3.6.1 Changing lifestyles of consumers to drive demand for malt-based ingredients and extract beverages
11.3.7 REST OF EUROPE
11.4 ASIA PACIFIC
11.4.1 CHINA
11.4.1.1 A shift from low-quality beer to premium beer
11.4.2 JAPAN
11.4.2.1 Increased focus of companies on capitalizing on new opportunities to capture the market
11.4.3 INDIA
11.4.3.1 Increase in the adoption of natural sweeteners to propel market growth
11.4.4 AUSTRALIA & NEW ZEALAND
11.4.4.1 Increase in the production of barley to boost market growth
11.4.5 REST OF ASIA PACIFIC
11.5 SOUTH AMERICA
11.5.1 BRAZIL
11.5.1.1 Sophistication and high demand for premium products
11.5.2 ARGENTINA
11.5.2.1 Rise in the number of launches for a wide range of products
11.5.3 REST OF SOUTH AMERICA
11.6 MIDDLE EAST & AFRICA
11.6.1 MIDDLE EAST
11.6.1.1 Increasing demand for non-alcoholic beverages and malt-based food accelerating the market
11.6.2 AFRICA
11.6.2.1 Increasing beer production propelling malt extracts and ingredients market growth
12 COMPETITIVE LANDSCAPE (Page No. - 126)
12.1 OVERVIEW
12.2 COMPETITIVE LEADERSHIP MAPPING
12.2.1 TERMINOLOGY/NOMENCLATURE
12.2.1.1 Visionary leaders
12.2.1.2 Innovators
12.2.1.3 Dynamic differentiators
12.2.1.4 Emerging companies
12.3 STRENGTH OF PRODUCT PORTFOLIO
12.4 BUSINESS STRATEGY EXCELLENCE
12.5 RANKING OF KEY PLAYERS 2018
12.6 COMPETITIVE SCENARIO
12.6.1 NEW PRODUCT LAUNCHES
12.6.2 EXPANSIONS & INVESTMENTS
12.6.3 MERGERS & ACQUISITIONS
12.6.4 AGREEMENTS, JOINT VENTURES, AND PARTNERSHIPS
12.7 SMALLER PLAYERS MICROQUADRANTS
12.7.1 PROGRESSIVE COMPANIES
12.7.2 EMERGING COMPANIES
12.7.3 RESPONSIVE COMPANIES
12.7.4 DYNAMIC COMPANIES
12.8 STRENGTH OF PRODUCT PORTFOLIO
12.9 BUSINESS STRATEGY EXCELLENCE
13 COMPANY PROFILES (Page No. - 138)
(Business overview, Products offered, Recent developments, SWOT analysis & Right to win)*
13.1 GRAINCORP LIMITED
13.2 MALTEUROP GROUP
13.3 RAHR CORPORATION
13.4 BOORTMALT
13.5 GROUPE SOUFFLET
13.6 MALTEXCO S.A.
13.7 MALT PRODUCTS
13.8 HOLLAND MALT
13.9 BARMALT
13.1 IREKS GMBH
13.11 MUNTONS PLC.
13.12 SIMPSONS MALT
13.13 VIKING MALT
13.14 AGRARIA
13.15 PUREMALT
13.16 CEREX
13.17 DIASTATISCHE PRODUCTEN
13.18 EDME LIMITED
13.19 IMPERIAL MALTS LIMITED
13.20 LAIHIAN MALLAS
*Details on Business overview, Products offered, Recent developments, SWOT analysis & Right to win might not be captured in case of unlisted companies.
14 APPENDIX (Page No. - 166)
14.1 DISCUSSION GUIDE
14.2 KNOWLEDGE STORE: MARKETSANDMARKETS� SUBSCRIPTION PORTAL
14.3 AVAILABLE CUSTOMIZATIONS
14.4 RELATED REPORTS
14.5 AUTHOR DETAILS
LIST OF TABLES (118 Tables)
TABLE 1 USD EXCHANGE RATES, 2014�2019
TABLE 2 LIST OF RECENT EXPANSION STRATEGIES ADOPTED BY COMPANIES
TABLE 3 MALT EXTRACTS AND INGREDIENTS MARKET SIZE, BY PRODUCT, 2018�2025 (USD MILLION)
TABLE 4 MALT INGREDIENTS MARKET SIZE, BY REGION, 2018�2025 (USD MILLION)
TABLE 5 MALT EXTRACTS MARKET SIZE, BY REGION, 2020�2025 (USD MILLION)
TABLE 6 MALT EXTRACTS AND INGREDIENTS MARKET SIZE, BY SOURCE, 2018�2025 (USD MILLION)
TABLE 7 MALT EXTRACTS AND INGREDIENTS MARKET SIZE, BY SOURCE, 2018�2025 (KT)
TABLE 8 BARLEY: MALT EXTRACTS AND INGREDIENTS MARKET SIZE, BY REGION, 2018�2025 (USD MILLION)
TABLE 9 BARLEY: MALT EXTRACTS AND INGREDIENTS MARKET SIZE, BY REGION, 2018�2025 (KT)
TABLE 10 WHEAT: MALT EXTRACTS AND INGREDIENTS MARKET SIZE, BY REGION, 2018�2025 (USD MILLION)
TABLE 11 WHEAT: MALT EXTRACTS AND INGREDIENTS MARKET SIZE, BY REGION, 2018�2025 (KT)
TABLE 12 RYE: MALT EXTRACTS AND INGREDIENTS MARKET SIZE, BY REGION, 2018�2025 (USD MILLION)
TABLE 13 RYE: MALT EXTRACTS AND INGREDIENTS MARKET SIZE, BY REGION, 2018�2025 (KT)
TABLE 14 OTHER APPLICATIONS: MALT EXTRACTS AND INGREDIENTS MARKET SIZE, BY REGION, 2018�2025 (USD MILLION)
TABLE 15 OTHER APPLICATIONS: MALT EXTRACTS AND INGREDIENTS MARKET SIZE, BY REGION, 2018�2025 (KT)
TABLE 16 MALT EXTRACTS AND INGREDIENTS MARKET SIZE, BY GRADE, 2018�2025 (USD MILLION)
TABLE 17 MALT EXTRACTS AND INGREDIENTS MARKET SIZE, BY GRADE, 2019�2025 (KT)
TABLE 18 SPECIALTY MALT MARKET SIZE, 2018�2025 (USD MILLION)
TABLE 19 STANDARD MALT MARKET SIZE, BY REGION, 2018�2025 (USD MILLION)
TABLE 20 STANDARD MALT MARKET SIZE, BY REGION, 2018�2025 (KT)
TABLE 21 SPECIALTY MALT MARKET SIZE, BY REGION, 2018�2025 (USD MILLION)
TABLE 22 SPECIALTY MALT MARKET SIZE, BY REGION, 2018�2025 (KT)
TABLE 23 MALT EXTRACTS AND INGREDIENTS MARKET SIZE, BY FORM, 2018�2025 (USD MILLION)
TABLE 24 MALT EXTRACTS AND INGREDIENTS MARKET SIZE, BY APPLICATION, 2018�2025 (USD MILLION)
TABLE 25 MALT EXTRACTS AND INGREDIENTS MARKET SIZE, BY APPLICATION, 2018�2025 (KT)
TABLE 26 BEVERAGES: MALT EXTRACTS AND INGREDIENTS MARKET SIZE, BY REGION, 2018�2025 (USD MILLION)
TABLE 27 BEVERAGES: MALT EXTRACTS AND INGREDIENTS MARKET SIZE, BY REGION, 2018�2025 (KT)
TABLE 28 ALCOHOLIC BEVERAGES: MALT EXTRACTS AND INGREDIENTS MARKET SIZE, BY REGION, 2018�2025 (USD MILLION)
TABLE 29 ALCOHOLIC BEVERAGES: MALT EXTRACTS AND INGREDIENTS MARKET SIZE, BY REGION, 2018�2025 (KT)
TABLE 30 NON-ALCOHOLIC BEVERAGES: MALT EXTRACTS AND INGREDIENTS MARKET SIZE, BY REGION, 2018�2025 (USD MILLION)
TABLE 31 NON-ALCOHOLIC BEVERAGES: MALT EXTRACTS AND INGREDIENTS MARKET SIZE, BY REGION, 2018�2025 (KT)
TABLE 32 FOOD: MALT EXTRACTS AND INGREDIENTS MARKET SIZE, BY REGION, 2018�2025 (USD MILLION)
TABLE 33 FOOD: MALT EXTRACTS AND INGREDIENTS MARKET SIZE, BY REGION, 2018�2025 (KT)
TABLE 34 PHARMACEUTICALS: MALT EXTRACTS AND INGREDIENTS MARKET SIZE, BY REGION, 2018�2025 (USD MILLION)
TABLE 35 PHARMACEUTICALS: MALT EXTRACTS AND INGREDIENTS MARKET SIZE, BY REGION, 2018�2025 (KT)
TABLE 36 OTHER APPLICATIONS: MALT EXTRACTS AND INGREDIENTS MARKET SIZE, BY REGION, 2018�2025 (USD MILLION)
TABLE 37 OTHER APPLICATIONS: MALT EXTRACTS AND INGREDIENTS MARKET SIZE, BY REGION, 2018�2025 (KT)
TABLE 38 MALT EXTRACTS AND INGREDIENTS MARKET SIZE, BY REGION, 2018�2025 (USD MILLION)
TABLE 39 MALT EXTRACTS AND INGREDIENTS MARKET SIZE, BY REGION, 2018�2025 (KT)
TABLE 40 NORTH AMERICA: MALT EXTRACTS AND INGREDIENTS MARKET SIZE, BY COUNTRY, 2018�2025 (USD MILLION)
TABLE 41 NORTH AMERICA: MALT EXTRACTS AND INGREDIENTS MARKET SIZE, BY COUNTRY, 2018�2025 (KT)
TABLE 42 NORTH AMERICA: MALT EXTRACTS AND INGREDIENTS MARKET SIZE, BY PRODUCT, 2018�2025 (USD MILLION)
TABLE 43 NORTH AMERICA: MALT EXTRACTS AND INGREDIENTS MARKET SIZE, BY SOURCE, 2018�2025 (USD MILLION)
TABLE 44 NORTH AMERICA: MALT EXTRACTS AND INGREDIENTS MARKET SIZE, BY SOURCE, 2018�2025 (KT)
TABLE 45 NORTH AMERICA: MALT EXTRACTS AND INGREDIENTS MARKET SIZE, BY APPLICATION, 2018�2025 (USD MILLION)
TABLE 46 NORTH AMERICA: MALT EXTRACTS AND INGREDIENTS MARKET SIZE, BY APPLICATION, 2018�2025 (KT)
TABLE 47 NORTH AMERICA: MALT EXTRACTS AND INGREDIENTS MARKET SIZE FOR BEVERAGES, BY SUBTYPE, 2018�2025 (USD MILLION)
TABLE 48 NORTH AMERICA: MALT EXTRACTS AND INGREDIENTS MARKET SIZE FOR BEVERAGES, BY SUBTYPE, 2018�2025 (KT)
TABLE 49 NORTH AMERICA: MALT EXTRACTS AND INGREDIENTS MARKET SIZE, BY GRADE, 2018�2025 (USD MILLION)
TABLE 50 NORTH AMERICA: MALT EXTRACTS AND INGREDIENTS MARKET SIZE, BY GRADE, 2018�2025 (KT)
TABLE 51 US: MALT EXTRACTS AND INGREDIENTS MARKET SIZE, BY SOURCE, 2018�2025 (USD MILLION)
TABLE 52 CANADA: MALT EXTRACTS AND INGREDIENTS MARKET SIZE, BY SOURCE, 2018�2025 (USD MILLION)
TABLE 53 MEXICO: MALT EXTRACTS AND INGREDIENTS MARKET SIZE, BY SOURCE, 2018�2025 (USD MILLION)
TABLE 54 EUROPE: MALT EXTRACTS AND INGREDIENTS MARKET SIZE, BY COUNTRY, 2018�2025 (USD MILLION)
TABLE 55 EUROPE: MALT EXTRACTS AND INGREDIENTS MARKET SIZE, BY COUNTRY, 2018�2025 (KT)
TABLE 56 EUROPE: MALT EXTRACTS AND INGREDIENTS MARKET SIZE, BY PRODUCT, 2018�2025 (USD MILLION)
TABLE 57 EUROPE: MALT EXTRACTS AND INGREDIENTS MARKET SIZE, BY SOURCE, 2018�2025 (USD MILLION)
TABLE 58 EUROPE: MALT EXTRACTS AND INGREDIENTS MARKET SIZE, BY SOURCE, 2018�2025 (KT)
TABLE 59 EUROPE: MALT EXTRACTS AND INGREDIENTS MARKET SIZE, BY APPLICATION, 2018�2025 (USD MILLION)
TABLE 60 EUROPE: MALT EXTRACTS AND INGREDIENTS MARKET SIZE, BY APPLICATION, 2018�2025 (KT)
TABLE 61 EUROPE: MALT EXTRACTS AND INGREDIENTS MARKET SIZE FOR BEVERAGES, BY SUBTYPE, 2018�2025 (USD MILLION)
TABLE 62 EUROPE: MALT EXTRACTS AND INGREDIENTS MARKET SIZE, BY BEVERAGES, 2018�2025 (USD MILLION)
TABLE 63 EUROPE: MALT EXTRACTS AND INGREDIENTS MARKET SIZE, BY GRADE, 2018�2025 (USD MILLION)
TABLE 64 EUROPE: MALT EXTRACTS AND INGREDIENTS MARKET SIZE, BY GRADE, 2018�2025 (KT)
TABLE 65 GERMANY: MALT EXTRACTS AND INGREDIENTS MARKET SIZE, BY SOURCE, 2018�2025 (USD MILLION)
TABLE 66 UK: MALT EXTRACTS AND INGREDIENTS MARKET SIZE, BY SOURCE, 2018�2025 (USD MILLION)
TABLE 67 FRANCE: MALT EXTRACTS AND INGREDIENTS MARKET SIZE, BY SOURCE, 2018�2025 (USD MILLION)
TABLE 68 RUSSIA: MALT EXTRACTS AND INGREDIENTS MARKET SIZE, BY SOURCE, 2018�2025 (USD MILLION)
TABLE 69 SPAIN: MALT EXTRACTS AND INGREDIENTS MARKET SIZE, BY SOURCE, 2018�2025 (USD MILLION)
TABLE 70 POLAND: MALT EXTRACTS AND INGREDIENT MARKET SIZE, BY SOURCE, 2018�2025 (USD MILLION)
TABLE 71 REST OF EUROPE: MALT EXTRACTS AND INGREDIENTS MARKET SIZE, BY SOURCE, 2018�2025 (USD MILLION)
TABLE 72 ASIA PACIFIC: MALT EXTRACTS AND INGREDIENTS MARKET SIZE, BY COUNTRY/REGION, 2018�2025 (USD MILLION)
TABLE 73 ASIA PACIFIC: MALT EXTRACTS AND INGREDIENTS MARKET SIZE, BY COUNTRY/REGION, 2018�2025 (KT)
TABLE 74 ASIA PACIFIC: MALT EXTRACTS AND INGREDIENTS MARKET SIZE, BY PRODUCT, 2018�2025 (USD MILLION)
TABLE 75 ASIA PACIFIC: MALT EXTRACTS AND INGREDIENTS MARKET SIZE, BY SOURCE, 2018�2025 (USD MILLION)
TABLE 76 ASIA PACIFIC: MALT EXTRACTS AND INGREDIENTS MARKET SIZE, BY SOURCE, 2018�2025 (KT)
TABLE 77 ASIA PACIFIC: MALT EXTRACTS AND INGREDIENTS MARKET SIZE, BY APPLICATION, 2018�2025 (USD MILLION)
TABLE 78 ASIA PACIFIC: MALT EXTRACTS AND INGREDIENTS MARKET SIZE, BY APPLICATION, 2018�2025 (KT)
TABLE 79 ASIA PACIFIC: MALT EXTRACTS AND INGREDIENTS MARKET SIZE FOR BEVERAGES, BY SUBTYPE, 2018�2025 (USD MILLION)
TABLE 80 ASIA PACIFIC: MALT EXTRACTS AND INGREDIENTS MARKET SIZE FOR BEVERAGES, BY SUBTYPE, 2018�2025 (KT)
TABLE 81 ASIA PACIFIC: MALT EXTRACTS AND INGREDIENTS MARKET SIZE, BY GRADE, 2018�2025 (USD MILLION)
TABLE 82 ASIA PACIFIC: MALT EXTRACTS AND INGREDIENTS MARKET SIZE, BY GRADE, 2018�2025 (KT)
TABLE 83 CHINA: MALT EXTRACTS AND INGREDIENTS MARKET SIZE, BY SOURCE, 2018�2025 (USD MILLION)
TABLE 84 JAPAN: MALT EXTRACTS AND INGREDIENTS MARKET SIZE, BY SOURCE, 2018�2025 (USD MILLION)
TABLE 85 INDIA: MALT EXTRACTS AND INGREDIENTS MARKET SIZE, BY SOURCE, 2018�2025 (USD MILLION)
TABLE 86 AUSTRALIA & NEW ZEALAND: MALT EXTRACTS AND INGREDIENTS MARKET SIZE, BY SOURCE, 2018�2025 (USD MILLION)
TABLE 87 REST OF ASIA PACIFIC: MALT EXTRACTS AND INGREDIENTS MARKET SIZE, BY SOURCE, 2018�2025 (USD MILLION)
TABLE 88 SOUTH AMERICA: MALT EXTRACTS AND INGREDIENTS MARKET SIZE, BY COUNTRY/REGION, 2018�2025 (USD MILLION)
TABLE 89 SOUTH AMERICA: MALT EXTRACTS AND INGREDIENTS MARKET SIZE, BY COUNTRY/REGION, 2018�2025 (KT)
TABLE 90 SOUTH AMERICA: MALT EXTRACTS AND INGREDIENTS MARKET SIZE, BY PRODUCT, 2018�2025 (USD MILLION)
TABLE 91 SOUTH AMERICA: MALT EXTRACTS AND INGREDIENTS MARKET SIZE, BY SOURCE, 2018�2025 (USD MILLION)
TABLE 92 SOUTH AMERICA: MALT EXTRACTS AND INGREDIENTS MARKET SIZE, BY SOURCE, 2018�2025 (KT)
TABLE 93 SOUTH AMERICA: MALT EXTRACTS AND INGREDIENTS MARKET SIZE, BY APPLICATION, 2018�2025 (USD MILLION)
TABLE 94 SOUTH AMERICA: MALT EXTRACTS AND INGREDIENTS MARKET SIZE, BY APPLICATION, 2018�2025 (KT)
TABLE 95 SOUTH AMERICA: MALT EXTRACTS AND INGREDIENTS MARKET SIZE FOR BEVERAGES, BY SUBTYPE, 2018�2025 (USD MILLION)
TABLE 96 SOUTH AMERICA: MALT EXTRACTS AND INGREDIENTS MARKET SIZE FOR BEVERAGES, BY SUBTYPE, 2018�2025 (KT)
TABLE 97 SOUTH AMERICA: MALT EXTRACTS AND INGREDIENTS MARKET SIZE, BY GRADE, 2018�2025 (USD MILLION)
TABLE 98 SOUTH AMERICA: MALT EXTRACTS AND INGREDIENTS MARKET SIZE, BY GRADE, 2018�2025 (KT)
TABLE 99 BRAZIL: MALT EXTRACTS AND INGREDIENTS MARKET SIZE, BY SOURCE, 2018�2025 (USD MILLION)
TABLE 100 ARGENTINA: MALT EXTRACTS AND INGREDIENTS MARKET SIZE, BY SOURCE, 2018�2025 (USD MILLION)
TABLE 101 REST OF SOUTH AMERICA: MALT EXTRACTS AND INGREDIENTS MARKET SIZE, BY SOURCE, 2018�2025 (USD MILLION)
TABLE 102 MEA: MALT EXTRACTS AND INGREDIENTS MARKET SIZE, BY REGION, 2018�2025 (USD MILLION)
TABLE 103 MEA: MALT EXTRACTS AND INGREDIENTS MARKET SIZE, BY REGION, 2018�2025 (KT)
TABLE 104 MEA: MALT EXTRACTS AND INGREDIENTS MARKET SIZE, BY PRODUCT, 2018�2025 (USD MILLION)
TABLE 105 MEA: MALT EXTRACTS AND INGREDIENTS MARKET SIZE, BY SOURCE, 2018�2025 (USD MILLION)
TABLE 106 MEA: MALT EXTRACTS AND INGREDIENTS MARKET SIZE, BY SOURCE, 2018�2025 (KT)
TABLE 107 MEA: MALT EXTRACTS AND INGREDIENTS MARKET SIZE, BY APPLICATION, 2018�2025 (USD MILLION)
TABLE 108 MEA: MALT EXTRACTS AND INGREDIENTS MARKET SIZE, BY APPLICATION, 2018�2025 (KT)
TABLE 109 MEA: MALT EXTRACTS AND INGREDIENTS MARKET SIZE FOR BEVERAGES, BY SUBTYPE, 2018�2025 (USD MILLION)
TABLE 110 MEA: MALT EXTRACTS AND INGREDIENTS MARKET SIZE FOR BEVERAGES, BY SUBTYPE, 2018�2025 (KT)
TABLE 111 MEA: MALT EXTRACTS AND INGREDIENTS MARKET SIZE, BY GRADE, 2018�2025 (USD MILLION)
TABLE 112 MEA: MALT EXTRACTS AND INGREDIENTS MARKET SIZE, BY GRADE, 2018�2025 (KT)
TABLE 113 MIDDLE EAST: MALT EXTRACTS AND INGREDIENTS MARKET SIZE, BY SOURCE, 2018�2025 (USD MILLION)
TABLE 114 AFRICA: MALT EXTRACTS AND INGREDIENTS MARKET SIZE, BY SOURCE, 2018�2025 (USD MILLION)
TABLE 115 NEW PRODUCT LAUNCHES, 2019
TABLE 116 EXPANSIONS & INVESTMENTS, 2018�2019
TABLE 117 MERGERS & ACQUISITIONS, 2017�2019
TABLE 118 AGREEMENTS, JOINT VENTURES, AND PARTNERSHIPS, 2020
LIST OF FIGURES (47 Figures)
FIGURE 1 MALT EXTRACTS AND INGREDIENTS MARKET: RESEARCH DESIGN
FIGURE 2 GRAPHICAL REPRESENTATION OF SUPPLY-SIDE ANALYSIS
FIGURE 3 GRAPHICAL REPRESENTATION OF DEMAND-SIDE ANALYSIS
FIGURE 4 DATA TRIANGULATION METHODOLOGY
FIGURE 5 EXTRACTS SEGMENT, BY PRODUCT, PROJECTED TO GROW AT THE HIGHEST RATE DURING THE FORECAST PERIOD, 2020�2025 (USD MILLION)
FIGURE 6 BARLEY SEGMENT, BY SOURCE, PROJECTED TO ACCOUNT FOR THE LARGEST SHARE BY 2025, 2020�2025 (USD MILLION)
FIGURE 7 SPECIALTY MALT, BY GRADE, PROJECTED TO GROW AT THE HIGHEST RATE, BY VALUE, DURING THE FORECAST PERIOD, 2020�2025 (USD MILLION)
FIGURE 8 DRY SEGMENT, BY FORM, PROJECTED TO GROW AT A HIGHER RATE, 2020�2025 (USD MILLION)
FIGURE 9 BEVERAGES SEGMENT, BY APPLICATION, PROJECTED TO GROW AT THE HIGHEST RATE, 2020�2025 (USD MILLION)
FIGURE 10 EUROPE PROJECTED TO BE THE FASTEST-GROWING REGION DURING THE FORECAST PERIOD
FIGURE 11 MALT EXTRACTS AND INGREDIENTS: AN EMERGING MARKET WITH STEADY-GROWTH POTENTIAL
FIGURE 12 EUROPE TO GROW AT THE HIGHEST RATE IN THE MALT EXTRACTS AND INGREDIENTS MARKET, FROM 2020 TO 2025
FIGURE 13 BARLEY SEGMENT, BY SOURCE, ESTIMATED TO DOMINATE THE MARKET IN 2020
FIGURE 14 BEVERAGES SEGMENT PROJECTED TO DOMINATE THE MARKET FROM 2020 TO 2025, BY VALUE
FIGURE 15 BEVERAGES SEGMENT, BY APPLICATION, ACCOUNTED FOR THE LARGEST SHARE IN THE ASIA PACIFIC MALT EXTRACTS AND INGREDIENTS MARKET, IN 2019
FIGURE 16 CHINA AND THE US OCCUPIED THE MAJOR SHARES IN THE GLOBAL MARKET IN 2019
FIGURE 17 MALT EXTRACTS AND INGREDIENTS MARKET: DRIVERS, RESTRAINTS, OPPORTUNITIES, AND CHALLENGES
FIGURE 18 OBESITY AMONG ADULTS, BY COUNTRY (2015)
FIGURE 19 CONSUMER PERCEPTION & EXPECTATION OF �NATURAL LABEL� ON PROCESSED AND PACKAGED FOOD, 2015
FIGURE 20 GLOBAL BEER PRODUCTION, 2014�2018 (MILLION KILOLITER)
FIGURE 21 ORGANIC RETAIL SALES, BY KEY COUNTRY, 2015�2017 (USD MILLION)
FIGURE 22 ORGANIC FARM AREA GROWTH TREND, BY COUNTRY, 2015�2017 (HECTARES)
FIGURE 23 YC & YCC SHIFT FOR THE MALT EXTRACTS AND INGREDIENTS MARKET
FIGURE 24 MALT EXTRACTS AND INGREDIENTS: SUPPLY CHAIN
FIGURE 25 WORLDWIDE BARLEY PRODUCTION, BY COUNTRY, 2017 (TONS)
FIGURE 26 MALT EXTRACTS AND INGREDIENTS MARKET SIZE, BY PRODUCT, 2018�2025 (USD MILLION)
FIGURE 27 PRODUCTION CAPACITY OF THE EUROPEAN MALTING INDUSTRY
FIGURE 28 MALT EXTRACTS AND INGREDIENTS MARKET SIZE, BY SOURCE, 2020 VS. 2025 (USD MILLION)
FIGURE 29 MALT EXTRACTS AND INGREDIENTS MARKET SIZE, BY GRADE, 2019�2025 (USD MILLION)
FIGURE 30 MALT EXTRACTS AND INGREDIENTS MARKET SIZE, BY FORM, 2020 VS. 2025 (USD MILLION)
FIGURE 31 MALT EXTRACTS AND INGREDIENTS MARKET SIZE, BY APPLICATION, 2020 VS. 2025 (USD MILLION)
FIGURE 32 TOP 10 BEER CONSUMING COUNTRIES RANKED ON THE BASIS OF ANNUAL PER CAPITA CONSUMPTION
FIGURE 33 MALT EXTRACTS AND INGREDIENTS MARKET: BY KEY COUNTRY, CAGR (2018�2025)
FIGURE 34 MALT EXTRACTS AND INGREDIENTS MARKET SIZE, BY REGION, 2020 VS. 2025 (USD MILLION)
FIGURE 35 EUROPE: MARKET SNAPSHOT
FIGURE 36 ASIA PACIFIC: REGIONAL SNAPSHOT
FIGURE 37 KEY DEVELOPMENTS OF THE LEADING PLAYERS IN THE MALT EXTRACTS AND INGREDIENTS MARKET, 2017�2020
FIGURE 38 GLOBAL MALT EXTRACTS AND INGREDIENTS MARKET: COMPETITIVE LEADERSHIP MAPPING, 2018
FIGURE 39 MALT EXTRACTS AND INGREDIENTS MARKET PLAYERS, IN TERMS OF RANK, IN 2018
FIGURE 40 MARKET EVALUATION FRAMEWORK, 2017�2020
FIGURE 41 MALT EXTRACTS AND INGREDIENTS MARKET (SMALL PLAYERS): COMPETITIVE LEADERSHIP MAPPING, 2018
FIGURE 42 GRAINCORP: COMPANY SNAPSHOT
FIGURE 43 GRAINCORP: SWOT ANALYSIS
FIGURE 44 MALTEUROP: SWOT ANALYSIS
FIGURE 45 RAHR CORPORATIONS: SWOT ANALYSIS
FIGURE 46 BOORTMALT: SWOT ANALYSIS
FIGURE 47 GROUPE SOUFFLET: SWOT ANALYSIS
The study involves four major activities to estimate the current market size of the malt extracts and ingredients market. Exhaustive secondary research was done to collect information on the market, peer market, and parent market. These findings, assumptions, and market sizes were validated with industry experts across the value chain through primary research. Both the top-down and bottom-up approaches were employed to estimate the complete market size. After that, the market breakdown and data triangulation approaches were used to estimate the market size of segments and sub-segments.
Secondary Research
In the secondary research process, various secondary sources such as NCBI, Government websites, Hoovers, Bloomberg BusinessWeek, and Dun & Bradstreet were referred to, to identify and collect information for this study. These secondary sources included annual reports, press releases & investor presentations of companies, white papers, certified publications, articles by recognized authors, gold standard & silver standard websites, food safety organizations, regulatory bodies, trade directories, and databases.
Primary Research
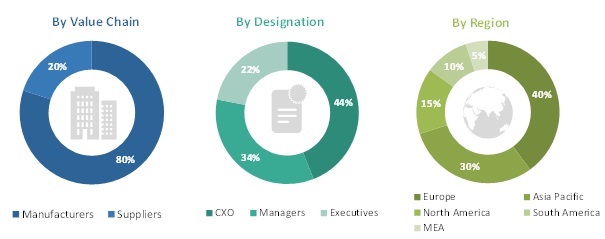
The malt extracts and ingredients market comprises several stakeholders such as manufacturers, importers and exporters, traders, distributors and suppliers of malt extracts and ingredients, and government & research organizations. The demand-side of this market is characterized by the rising demand for malt extracts and ingredients from the food & beverage, pharmaceutical, and personal care industries; researchers; importers/exporters; and distributors. The supply-side is characterized by the supply of malt extracts and ingredients from various suppliers in the market and by the presence of key providers of malt. Various primary sources from both the supply and demand sides of the market were interviewed to obtain qualitative and quantitative information. Following is the breakdown of primary respondents:
To know about the assumptions considered for the study, download the pdf brochure
Market Size Estimation
Both the top-down and bottom-up approaches were used to estimate and validate the total size of the malt extracts and ingredients market. These methods were also used extensively to estimate the size of various subsegments in the market. The research methodology used to estimate the market size includes the following:
- The key players in the industry and markets were identified through extensive secondary research
- The industry�s supply chain and market size, in terms of value, were determined through primary and secondary research processes
- All percentage shares, splits, and breakdowns were determined using secondary sources and verified through primary respondents
Data Triangulation
After arriving at the overall market size-using the market size estimation processes as explained above-the market was split into several segments and sub-segments. To complete the overall market engineering process and arrive at the exact statistics of each market segment and subsegment, the data triangulation and market breakdown procedures were employed. The data was triangulated by studying various factors and trends from both the demand and supply sides in the malt extracts and ingredients market.
Report Objectives
- To define, segment, and project the global market size of the malt extracts and ingredients market
- To understand the malt extracts and ingredients market by identifying its various subsegments
- To provide detailed information about the key factors influencing the growth of the market (drivers, restraints, opportunities, and industry-specific challenges)
- To analyze the micromarkets, with respect to individual growth trends, prospects, and their contribution to the total market
- To project the size of the market and its submarkets, in terms of value, with respect to the regions (along with their respective key countries)
- To profile the key players and comprehensively analyze their core competencies
- To understand the competitive landscape and identify the major growth strategies adopted by the players across the key regions
- To analyze the competitive developments such as expansions & investments, mergers & acquisitions, new product launches, partnerships, collaborations, and agreements
Available Customizations
With the given market data, MarketsandMarkets offers customizations according to company-specific scientific needs.
The following customization options are available for the report:
Product Analysis
- Product matrix, which gives a detailed comparison of the product portfolio of each company
Geographic Analysis
- Further breakdown of the Rest of Europe malt extracts and ingredients market into the Netherlands, Czech Republic, Ukraine, Italy, and Belgium
- Further breakdown of the Rest of Asia Pacific malt extracts and ingredients market into Indonesia, Singapore, South Korea, Malaysia, and Vietnam
- Further breakdown of the South America malt extracts and ingredients market into Chile and Colombia
Company Information
- Detailed analysis and profiling of additional market players (Up to 5)


Growth opportunities and latent adjacency in Malt Extracts and Ingredients Market