Construction Glass Market by Type (Low-E, Special), Application (Residential, Commercial, Others), Manufacturing Process (Float, Rolled/Sheet), Chemical Composition (Soda-Lime, Potash-Lime, Potash-Lead), & by Geography - Global Forecast to 2020


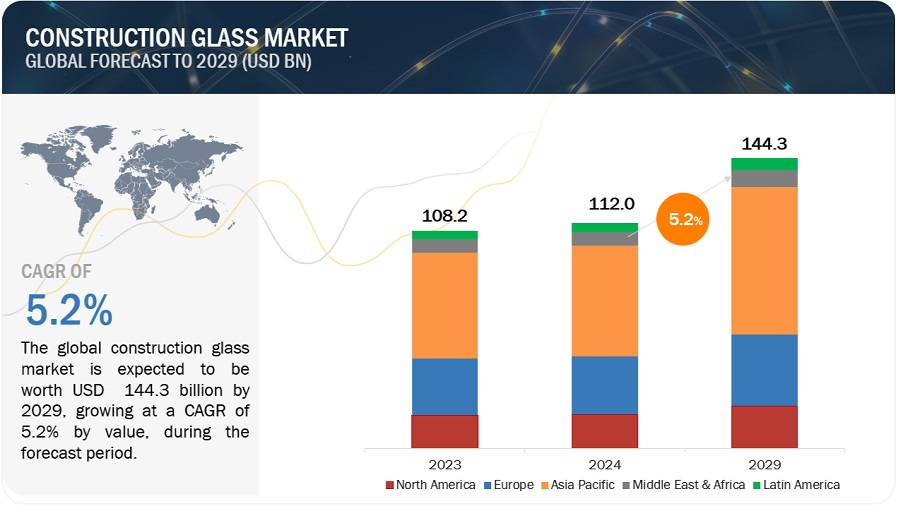
[176 Pages Report] The global market for construction glass witnessed rapid growth from 2012, and is projected to grow at a CAGR of 7.08% during the review period, to reach $115.08 Billion by 2020. Asia-Pacific region dominated the construction glass market, with a share of 62% in 2013 and is projected to grow at the highest CAGR from 2015 to 2020, in terms of volume. The rising middle-class population of this region, with high disposable income, and demand for sustainable construction, are driving the growth of the market. Another factor is the densely populated areas of the region that require better infrastructure facilities.
Construction Glass Market Share (Value), by Region, 2014
Source: Expert Interviews and MarketsandMarkets Analysis
This report estimates the market size of the global construction glass market in terms of value ($million). In this report, the market is broadly segmented based on type, chemical composition, manufacturing process, application, and region. Market drivers, restraints, challenges, raw material, and product price trends are discussed in detail. Market shares of the participant companies of construction glass, is discussed in detail. The global market has grown exponentially in the last few years and this trend is expected to continue. Increasing disposable incomes of people in developing countries, government regulations, and changing preferences of people towards sustainable building techniques drive the growth of the market.
Get online access to the report on the World's First Market Intelligence Cloud
Request Sample Scope of the Report

This research study categorizes the global construction glass market based on type, chemical composition, manufacturing process, application, and region:
Based on Type:
- Low-e glass
- Special glass
Based on chemical composition:
- Soda-Lime
- Potash-Lime
- Potash-Lead
Based on manufacturing process:
- Float process
- Rolled/Sheet process
Based on Application:
- Residential
- Commercial
- Others
Based on Region:
- North America
- Europe
- Asia-Pacific
- Rest of the World (RoW)
Construction glass includes flat glass. Flat glass is widely used for glass doors, glass windows, and transparent walls. Construction glass has high strength, excellent insulation, is chemical-resistant, soundproof, has a cost advantage, saves energy, and is fire-resistant. These properties make construction glass the most viable option for the construction industry.
The global market has expanded owing to the developments in the building construction industry. The demand for construction glass products is growing at a significant pace and is projected to grow at an even higher rate in the near future. With the rising population and increased incomes of people, the building construction industry is booming, and consequently, so is the construction glass market. The market can be classified into three main categories based on application: residential, commercial, and others.
Construction Glass Market Size, by Type, 2014 - 2020 ($Million)
Source: Expert Interviews and MarketsandMarkets Analysis
The global market is observed to be mature in developing economies, such as Europe and North America. The reason behind this is the rapid growth in the construction sector. The Asia-Pacific region formed the largest market, in terms of volume, having accounted for 43.5 Million tons in 2014. Europe formed the second-largest market, with a share of 20%. The Asia-Pacific region is projected to be the fastest-growing market from 2015 to 2020. The global market for construction glass is projected to grow at a CAGR of 7.08% from 2015, to reach $1,15,083.65 Million by 2020.
The global market is driven by the demand from the construction industry. The rising population has encouraged construction of new buildings. High disposable income has enabled end users to spend more on new constructions. Most importantly, the changing mindset of residential consumers has given a boost to the construction glass industry.
The global market is marked with intense competition due to the presence of a large number of both, big and small firms. New product launches, mergers & acquisitions, and partnerships and expansions are the key strategies adopted by market players to ensure their growth in the market. Companies such as Asahi Glass (Japan), Guardian Industries (U.S.), PPG Industries (U.S.), and Saint-Gobain S.A. (France), are some of the prominent companies in the construction glass market, comprising 70% of the total market share.
Table of Contents
1 Introduction (Page No. - 15)
1.1 Objectives of the Study
1.2 Market Definition
1.3 Study Scope
1.3.1 Periodization Considered for this Market
1.4 Currency
1.5 Package Size
1.6 Limitations
1.7 Stakeholders
2 Research Methodology (Page No. - 19)
2.1 Introduction
2.1.1 Secondary Data
2.1.1.1 Key Data From Secondary Sources
2.1.2 Primary Data
2.1.2.1 Key Data From Primary Sources
2.1.2.2 Key Industry Insights
2.2 Factor Analysis
2.2.1 Introduction
2.2.2 Overview of the Parent Industry
2.2.3 Key Segments in the Construction Industry
2.2.4 Demand-Side Analysis
2.2.4.1 Rising Population
2.2.4.1.1 Increase in Middle-Class Population, 2009-2030
2.2.4.2 Developing Economies, GDP (Purchasing Power Parity), 2013
2.2.5 Supply-Side Analysis
2.2.5.1 Rating Systems for Buildings
2.2.5.2 Research & Development
2.2.5.3 Demand for Value-Added Products
2.3 Market Size Estimation
2.4 Market Crackdown and Data Triangulation
2.5 Market Share Estimation
2.6 Research Assumptions and Limitations
2.6.1 Limitations of the Research Study
3 Executive Summary (Page No. - 32)
3.1 Global Construction Market Was $76.32 Billion in 2014
3.2 Evolution
3.3 The Market for Low-E Glass To Grow at Highest CAGR
4 Premium Insights (Page No. - 36)
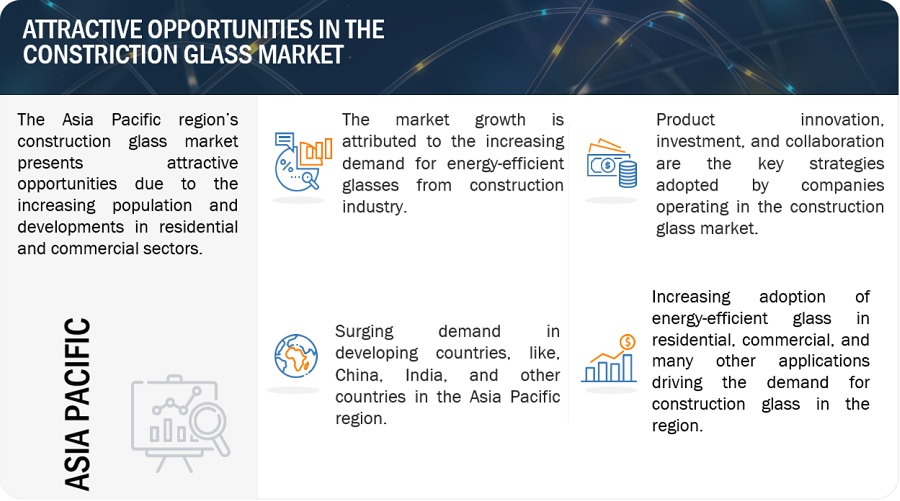
4.1 Attractive Opportunities in this Market
4.2 Construction Glass Market, By Company
4.3 Construction Glass Market in Asia-Pacific Region
4.4 Asia-Pacific Dominated Global Market in 2014
4.4.1 China Dominated this Market in 2014
4.5 Construction Glass Market, By Type 2014
4.6 Construction Glass Market: Developed vs. Emerging Markets
4.7 Special Glass Segment Accounted for Major Share in the Construction Glass Market in 2014
4.8 Construction Glass Market Life Cycle Analysis, By Region
4.9 Technology Adoption Life Cycle of Construction Glass, By Type
5 Market Overview (Page No. - 45)
5.1 Introduction
5.5 Construction Glass Market Segmentation
5.5.1 By Type
5.5.1.1 Low-E Glass
5.5.1.1.1 Hard Coat Low-E
5.5.1.1.2 Soft Coat Low-E
5.5.1.2 Special Glass
5.5.2 By Application
5.5.2.1 Residential
5.5.2.2 Commercial
5.5.3 By Manufacturing Process
5.5.3.1 Float Glass Process
5.5.3.2 Rolled/Sheet Process
5.5.4 By Chemical Composition
5.5.4.1 Soda-Lime
5.5.4.2 Potash-Lime
5.5.4.3 Potash-Lead
5.6 Market Dynamics
5.6.1 Drivers
5.6.1.1 Growth in Construction Industry
5.6.1.2 Need for Energy Savings
5.6.1.3 Demand for Value-Added Glass Products
5.6.1.4 Technological Advancements in Glass Industry
5.6.2 Restraints
5.6.2.1 Regulations for Carbon Dioxide Emissions
5.6.2.2 Economic Downturn Faced By Major Regions
5.6.3 Opportunities
5.6.3.1 Demand for Green Buildings
5.6.3.2 Investment on Infrastructure Projects in Developing Economies
5.6.4 Challenges
5.6.4.1 Energy-Efficient Manufacturing Process
5.6.4.2 Access To Raw Materials
5.6.4.3 Volatility in the Price of Raw Materials
5.6.4.4 Environmental and Government Regulations
6 Industry Trends (Page No. - 58)
6.1 Introduction
6.2 Value Chain Analysis
6.3 Supply Chain Analysis
6.3.1 Prominent Companies
6.3.2 Small & Medium Enterprises
6.4 Industry Trends
6.5 Porter�s Five Forces Analysis
6.5.1 Threat of New Entrants
6.5.2 Threat of Substitutes
6.5.3 Bargaining Power of Suppliers
6.5.4 Bargaining Power of Buyers
6.5.5 Intensity of Competitive Rivalry
7 Construction Glass Market, By Type (Page No. - 65)
7.1 Introduction
7.1.1 Global Construction Glass Market is Expected To Grow at a CAGR of 7.08% in Terms of Value, 2015-2020
7.1.2 Low-E Glass Segment is Estimated To Grow at a CAGR of Around 6.93% in Terms of Volume, 2015-2020
7.2 Special Glass
7.3 Asia Pacific is the Lucrative Market for Special Glass, in Terms of Growth
7.3.1 Double Glazing Glass
7.3.2 Laminated Glass
7.3.3 Other Special Glasses
7.4 Low-Emissivity Glass
7.4.1 Need for Energy-Efficient Buildings Make the Segment One of the Major Ones in Construction Glass
8 Construction Glass Market, By Manufacturing Process (Page No. - 77)
8.1 Introduction
8.1.1 Float Glass Process is Projected To Grow at a CAGR of Around 7.12% in Terms of Value, 2015-2020
8.2 Float Glass Process
8.2.1 Float Glass Process Accounted for 90% of Construction Glass Production in 2014
8.3 Rolled/Sheet Glass
8.3.1 Rolled/Sheet Glass Process is Estimated To Grow at a CAGR of 6.72% in Terms of Value, 2015-2020
9 Construction Glass Market, By Application (Page No. - 83)
9.1 Introduction
9.1.1 Commercial Segment Will Grow at a Higher CAGR Due To Demand for Energy-Efficent Buildings and Need for Energy Saving
9.2 Residential
9.2.1 Residential Segment is Prominent User of Construction Glass Globally
9.3 Commercial
9.3.1 Commercial Sector is Projected To Grow at a CAGR of 7.68% in Terms of Value, 2015-2020
9.4 Others
10 Construction Glass Market, By Chemical Composition (Page No. - 90)
10.1 Introduction
10.2 Soda-Lime Glass
10.2.1 Soda-Lime Glass Accounted for Around 90% of the Construction Glass in 2014
10.3 Potash-Lime Glass
10.3.1 Potash-Lime is Projected To Grow at a CAGR of Around 5.65% in Terms of Value, 2015-2020
10.4 Potash-Lead Glass
10.4.1 Potash-Lead Glass is Estimated To Grow at a CAGR of Around 6.10% in Terms of Value, 2015-2020
11 Construction Glass Market, By Region (Page No. - 97)
11.1 Introduction
11.1.1 Regionwise (Global Construction Glass Market is Projected To Grow at a CAGR of 7.08% in Terms of Value, From 2015-2020
11.2 North America
11.2.1 U.S.
11.2.2 Canada
11.2.3 Mexico
11.3 Europe
11.3.1 Germany
11.3.2 France
11.3.3 Spain
11.3.4 U.K.
11.3.5 Belgium
11.3.6 Russia
11.3.7 Rest of Europe
11.4 Asia-Pacific
11.4.1 China
11.4.2 Japan
11.4.3 Australia
11.4.4 New Zealand
11.4.5 India
11.4.6 Rest of Asia-Pacific
11.5 Rest of the World (RoW)
11.5.1 Brazil
11.5.2 Saudi Arabia
11.5.3 UAE
11.5.4 Others
12 Competitive Landscape (Page No. - 131)
12.1 Overview
12.2 Market Share Analysis
12.2.1 Global Construction Glass Demand Met By Key Players
12.3 Competitive Situations & Trends
12.4 Battle for Market Share: New Product Launches Was the Key Strategy
12.4.1 New Product Launches
12.4.1.1 New Product Launch the Key Strategy for Companies Across the World
12.4.2 Partnerships, Agreements, and Joint Ventures
12.4.3 Investment & Expansion
12.4.3.1 Expansions Helped the Companies Increase Their Presence in the Market
12.4.4 Mergers & Acquisitions
12.4.5 Technological Advancements
13 Company Profiles (Page No. - 140)
(Company at a Glance, Recent Financials, Products & Services, Strategies & Insights, & Recent Developments)*
13.1 Introduction
13.2 Asahi Glass
13.3 Central Glass Co. Ltd.
13.4 China Glass Holdings Limited
13.5 Guardian Industries
13.6 Nippon Sheet Glass (NSG)
13.7 PPG Industries
13.8 Saint-Gobain
13.9 Schott AG
13.10 Sisecam Group
13.11 Xinyi Glass Holdings Limited
*Details on Company at a Glance, Recent Financials, Products & Services, Strategies & Insights, & Recent Developments Might Not Be Captured in Case of
Unlisted Companies.
14 Appendix (Page No. - 170)
14.1 Insights of Industry Experts
14.2 Discussion Guide
14.3 Introducing RT: Real Time Market Intelligence
14.4 Available Customizations
List of Tables (83 Tables)
Table 1 Rising Demand of Construction of Residential and Commercial Buildings
Table 2 Environmental Regulations and Economic Downturn
Table 3 Demand for Green Building Material and Sustainable Construction is a Key Opportunity for the Market
Table 4 High Cost of Raw Materials and Fuels Used in Glass Manufacturing
Table 5 Construction Glass Market Size, By Type, 2013�2020 ($Million)
Table 6 Market Size, By Type, 2013-2020 (MT)
Table 7 Special Glass Market Size, By Region, 2013�2020 ($Million)
Table 8 Special Glass Market Size, By Region, 2013�2020 (MT)
Table 9 Special Glass Market Size, By Type, 2013�2020 ($Million)
Table 10 Special Glass Market Size, By Type, 2013�2020 (MT)
Table 11 Double Glazing Glass Market Size, By Region, 2013�2020 ($Million)
Table 12 Double Glazing Glass Market Size, By Region, 2013�2020 (MT)
Table 13 Laminated Glass Market Size, By Region, 2013�2020 ($Million)
Table 14 Laminated Glass Market Size, By Region, 2013�2020 (MT)
Table 15 Other Special Glasses Market Size, By Region, 2013�2020 ($Million)
Table 16 Other Special Glasses Market Size, By Region, 2013�2020 (MT)
Table 17 Low-E Glass Market Size, By Region, 2013-2020 ($Million)
Table 18 Low-E Glass Market Size, By Region, 2013-2020 (MT)
Table 19 Construction Glass Market Size, By Manufacturing Process, 2013�2020 ($Million)
Table 20 Construction Glass Market Size, By Manufacturing Process, 2013�2020 (Million Tons)
Table 21 Construction Glass in Float Process Market Size, By Region, 2013�2020 ($Million)
Table 22 Construction Glass in Float Process Market Size, By Region, 2013�2020 (MT)
Table 23 Construction Glass in Rolled/Sheet Process Market Size, By Region, 2013�2020 ($Million)
Table 24 Construction Glass in Rolled/Sheet Process Market Size, By Region, 2013�2020 (MT)
Table 25 Construction Glass Market Size, By Application, 2013�2020 ($Million)
Table 26 Construction Glass Market Size, By Application, 2013-2020 (MT)
Table 27 Construction Glass in Residential Market Size, By Region, 2013�2020 ($Million)
Table 28 Construction Glass in Residential Market Size, By Region, 2013�2020 (MT)
Table 29 Construction Glass in Commercial Market Size, By Region, 2013�2020 ($Million)
Table 30 Construction Glass in Commercial Market Size, By Region, 2013�2020 (MT)
Table 31 Others: Construction Glass Market Size, By Region, 2013�2020 ($Million)
Table 32 Others: Market Size, By Region, 2013�2020 (MT)
Table 33 Construction Glass Market Size, By Chemical Composition, 2013�2020 ($Million)
Table 34 Construction Glass Market Size, By Chemical Composition, 2013�2020 (MT)
Table 35 Soda-Lime: Construction Glass Market Size, By Region, 2013�2020 ($Million)
Table 36 Soda-Lime: Market Size, By Region, 2013�2020 (MT)
Table 37 Potash-Lime: Construction Glass Market Size, By Region, 2013�2020 ($Million)
Table 38 Potash-Lime: Market Size, By Region, 2013�2020 (MT)
Table 39 Potash-Lead: Market Size, By Region, 2013�2020 ($Million)
Table 40 Potash-Lead: Market Size, By Region, 2013�2020 (MT)
Table 41 Construction Glass Market Size, By Region, 2013-2020 ($Million)
Table 42 Construction Glass Market Size, By Region, 2013-2020 (MT)
Table 43 North America: Construction Glass Market Size, By Country, 2013-2020 ($Million)
Table 44 North America: Market Size, By Country, 2013-2020 (MT)
Table 45 North America: Low-E Glass Market Size, By Country, 2013-2020 ($Million)
Table 46 North America: Low-E Glass Market Size, By Country, 2013-2020 (MT)
Table 47 North America: Double Glazing Market Size, By Country, 2013-2020 ($Million)
Table 48 North America: Double Glazing Market Size, By Country, 2013-2020 (MT)
Table 49 North America: Laminated Glass Market Size, By Country, 2013-2020 ($Million )
Table 50 North America: Laminated Glass Market Size, By Country, 2013-2020 (MT)
Table 51 North America: Other Special Glass Market Size, By Country, 2013-2020 ($Million)
Table 52 North America: Other Special Glass Market Size, By Country, 2013-2020 (MT)
Table 53 Europe: Construction Glass Market Size, By Country, 2013-2020 ($Million)
Table 54 Europe: Market Size, By Country, 2013-2020 (MT)
Table 55 Europe: Low-E Glass Market Size, By Country, 2013-2020 ($Million)
Table 56 Europe: Low-E Glass Market Size, By Country, 2013-2020 (MT)
Table 57 Europe: Double Glazing Market Size, By Country, 2013-2020 ($Million)
Table 58 Europe: Double Glazing Market Size, By Country, 2013-2020 (MT)
Table 59 Europe: Laminated Glass Market Size, By Country, 2013-2020 ($Million)
Table 60 Europe: Laminated Glass Market Size, By Country, 2013-2020 (MT)
Table 61 Europe: Other Special Glass Market Size, By Country, 2013-2020 ($Million)
Table 62 Europe: Other Special Glass Market Size, By Country, 2013-2020 (MT)
Table 63 Asia-Pacific: Construction Glass Market Size, By Country, 2013-202 ($Million)
Table 64 Asia-Pacific: Market Size, By Country, 2013-2020 (MT)
Table 65 Asia-Pacific: Low-E Glass Market Size, By Country, 2013-2020 ($Million)
Table 66 Asia-Pacific: Low-E Glass Market Size, By Country, 2013-2020 (MT)
Table 67 Asia-Pacific: Double Glazing Glass Market Size, By Country, 2013-2020 ($Million)
Table 68 Asia-Pacific: Double Glazing Glass Market Size, By Country, 2013-2020 (MT)
Table 69 Asia-Pacific: Laminated Glass Market Size, By Country, 2013-2020 ($Million)
Table 70 Asia-Pacific: Laminated Glass Market Size, By Country, 2013-2020 (MT)
Table 71 Asia-Pacific: Other Special Glass Market Size, By Country, 2013-2020 ($Million)
Table 72 Asia-Pacific: Other Special Glass Market Size, By Country, 2013-2020 (MT)
Table 73 RoW: Construction Glass Market Size, By Country, 2013-2020 ($Million)
Table 74 RoW: Market Size, By Country, 2013-2020 (MT)
Table 75 RoW: Low-E Glass Market Size, By Country, 2013-2020 ($Million)
Table 76 RoW: Low-E Glass Market Size, By Country, 2013-2020 (MT)
Table 77 RoW: Double Glazing Glass Market Size, By Country, 2013-2020 ($Million)
Table 78 RoW: Double Glazing Market Size, By Country, 2013-2020 (MT)
Table 79 RoW: Laminated Glass Market Size, By Country, 2013-2020 ($Million)
Table 80 RoW: Laminated Glass Market Size, By Country, 2013-2020 (MT)
Table 81 RoW: Other Special Glass Market Size, By Country, 2013-2020 ($Million)
Table 82 RoW: Other Special Glass Market Size, By Country, 2013-2020 (MT)
Table 83 New Product Launches, 2011�2015
List of Figures (62 Figures)
Figure 1 Construction Glass Market, By Type
Figure 2 Research Design
Figure 3 Breakdown of Primaries - By Company Type, Designation & Region
Figure 4 Global Population is Expected To Reach ~9.5 Billion By 2050
Figure 5 Projected GDP Per Capita, By Region
Figure 6 Market Size Estimation Methodology: Bottom-Up Approach
Figure 7 Market Size Estimation Methodology: Top-Down Approach
Figure 8 Data Triangulation Methodology
Figure 9 Evolution of Construction Glass, Flat Glass Dominates the Market
Figure 10 Constructions Glass Market Snapshot (2014 vs. 2020): Asia-Pacific Market for Low-E Glass Projected To Grow at the Highest CAGR
Figure 11 China Was the Fastest-Growing Market for Construction Glass in 2014
Figure 12 New Product Launches Was the Key Strategy During 2010-2014
Figure 13 Emerging Economies Offer Attractive Opportunities in this Market
Figure 14 NSG Pilkington Displayed Highest Growth at 8.3% Between 2010-2013
Figure 15 China Captured Largest Market in Asia-Pacific Construction Glass Market in 2014
Figure 16 China is Projected To Be the Fastest-Growing Country-Level Market for Construction Glass
Figure 17 Low-E Glass Market is Expected To Grow From 2014-2020
Figure 18 Emerging Markets To Grow Faster Than Developed Markets Between 2014 and 2020
Figure 19 Figure 6: Asia-Pacific Construction Glass Market To Grow at the Highest Rate in 2014
Figure 20 The Construction Glass Market in Asia-Pacific Region is Experiencing High Growth During the Forecast Period
Figure 21 Low-E Glass Segment To Grow Rapidly From 2015 To 2020
Figure 22 Evolution of Construction Glass
Figure 23 Asia-Pacific Dominates the Construction Glass Industry
Figure 24 Figure 10: Construction Glass Segmentation
Figure 25 Growth in Construction Industry is the Key Driver of this Market
Figure 26 Downstream Processing Adds Maximum Value To Glass Products
Figure 27 Aligning Raw Material Suppliers Enhances Supply Chain
Figure 28 Porter�s Five Forces Analysis
Figure 29 Sources of Growth for Construction Glass Market Between 2014 & 2020
Figure 30 Construction Glass Market, By Region, Between 2015 vs. 2020 ($Million)
Figure 31 Construction Glass Market, By Type, 2015 & 2020 ($Million)
Figure 32 Growth of Construction Flat Glass, By Type, 2014 & 2020 ($Million)
Figure 33 Construction Glass Market Size, By Application, 2015 vs. 2020
Figure 34 Geographic Snapshot (2013): The Markets in Asia-Pacific Are Emerging as New Hotspots
Figure 35 Asia-Pacific Construction Glass Market Snapshot: China Was the Most Lucrative Market in 2014
Figure 36 Asia-Pacific Construction Glass Market Snapshot: China is Projected To Be the Global Leader Between 2015 & 2020
Figure 37 Rising Demand for Energy-Efficient Buildings Supporting Growth of this Market in Asia-Pacific
Figure 38 Companies Adopted New Product Launches as the Key Growth Strategy From 2010 To 2013
Figure 39 Asahi Glass Grew at the Highest Rate Between 2010 & 2013
Figure 40 Construction Glass Market Share, By Key Player, 2013
Figure 41 New Product Launches Has Fueled Growth of this Market
Figure 42 Battle for Market Share: New Product Launches Was the Key Strategy, 2011-2015
Figure 43 Geographic Revenue Mix of Top Five Market Players
Figure 44 Asahi Glass: Company Snapshot
Figure 45 Asahi Glass Co. Ltd. : SWOT Analysis
Figure 46 Central Glass Co., Ltd.: Company Snapshot
Figure 47 Central Glass Co. Ltd. : SWOT Analysis
Figure 48 China Glass Holdings Limited:Company Snapshot
Figure 49 China Glass Holdings Limited: SWOT Analysis
Figure 50 Guardian Industries: SWOT Analysis
Figure 51 Nippon Sheet Glass: Company Snapshot
Figure 52 Nippon Sheet Glass: SWOT Analysis
Figure 53 PPG Industries: Company Snapshot
Figure 54 PPG Industries: SWOT Analysis
Figure 55 Saint-Gobain: Company Snapshot
Figure 56 Saint-Gobain: SWOT Analysis
Figure 57 Schott AG: Company Snapshot
Figure 58 Schott AG: SWOT Analysis
Figure 59 Sisecam Group: Company Snapshot
Figure 60 Sisecam: SWOT Analysis
Figure 61 Xinyi Glass Holdings Ltd.: Company Snapshot
Figure 62 Xinyi Glass Holdings Limited: SWOT Analysis


Growth opportunities and latent adjacency in Construction Glass Market