Network Optimization Services Market by Services, Application Type (Local Network Optimization, WAN Optimization, RAN Optimization, and Data Center Optimization), Deployment Type, Organization Size, Industry Vertical, and Region - Global Forecast to 2022


[132 Pages Report] The network optimization services market is projected to grow from USD 4.40 Billion in 2016 to USD 9.08 Billion by 2022. The global market is expected to grow at a Compound Annual Growth Rate (CAGR) of 13.7% during the forecast period. The forecast period has been considered from 2017 to 2022, while 2016 is considered as the base year for estimating the market study. Several factors such as the increasing number of branch offices and data centers, growth in usage of Internet Protocol (IP) video and virtualization, and network optimization as a cloud service are driving the growth of the market. Moreover, an increased adoption of network optimization services by several industry verticals, such as telecom, manufacturing, consumer goods and retail, and information technology, is expected to boost the market growth.
Objectives of the Study:
The main objective of the network optimization services market research report is to define, describe, and forecast the market on the basis of segments which include component, deployment type, organization size, vertical, and region. The report provides a detailed information regarding the major factors influencing the growth of the market (drivers, restraints, opportunities, and industry-specific challenges). The report forecasts the market size with respect to 5 main geographic regions, namely, North America, Europe, Asia Pacific (APAC), Middle East and Africa (MEA), and Latin America. The report profiles key players and comprehensively analyzes their core competencies. This report also tracks and analyzes competitive developments, such as mergers and acquisitions, new product developments, and Research and Development (R&D) activities in the network optimization services market.
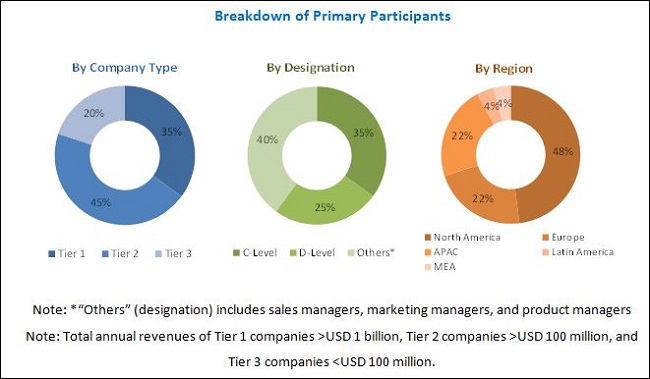
The research methodology used to estimate and forecast the market begins with the collection and analysis of data on key vendor product offerings and business strategies from secondary sources, such as OneSource Business Browser, D&B Hoovers, 10K Wizard, Bloomberg, Thomson Street Events, Factiva, IT service providers, technology providers, press releases and investor presentations of companies, white papers, technology journals, certified publications, articles from recognized authors, directories, and databases. The vendor offerings have also been taken into consideration to determine the market segmentation. The bottom-up procedure was employed to arrive at the total market size of the network optimization services market from the revenue of the key market software tool providers and service providers. After arriving at the overall market size, the total market was split into several segments and sub segments, which were then verified through primary research by conducting extensive interviews with key people, such as Chief Executive Officers (CEOs), Vice Presidents (VPs), directors, and executives.
To know about the assumptions considered for the study, download the pdf brochure
Industry Ecosystem
The network optimization services market ecosystem comprises vendors, such as Riverbed Technology (US), NetScout Systems (US), SolarWinds (US), Cisco (US), Huawei (China), Nokia Corporation (Finland), ZTE (China), InfoVista (Europe), Citrix (US), Circadence (US), FatPipe Networks (US), and Silver Peak (US). These vendors have adopted various organic and inorganic growth strategies, such as new product launches, partnerships and collaborations, and mergers and acquisitions, to enhance their position in the market.
Key Target Audience of Network Optimization Services Market
- Network optimization services providers
- Network management solution providers
- WAN optimization services providers
- Analytics vendors
- Project accounting solution providers
- Value-added resellers
Get online access to the report on the World's First Market Intelligence Cloud
Request Sample Scope of the Report

The research report categorizes the market to forecast the revenues and analyze the trends in each of the following submarkets:
By Service
- Implementation
- Consulting
- Support and maintenance
Network Optimization Services Market By Application
- Local networks optimization
- WAN optimization
- RAN optimization
- Data center optimization
By Deployment Type
- On-premises
- Cloud
By Organization Size
- Small and Medium-sized Enterprises (SMEs)
- Large enterprises
By Vertical
- Banking, Financial Services, and Insurance
- Telecom
- Government and defense
- Transportation and logistics
- Travel and tourism
- Manufacturing
- Consumer goods and retail
- Media and entertainment
- Energy and utility
- Healthcare and life sciences
- Education
- Information Technology (IT)
- Others (NGO and legal services)
By Region
- North America
- Europe
- MEA
- APAC
- Latin America
The changing user requirements, rapid growth in IP and Ethernet services, increasing number of branch offices and data centers, and increase in the demand of network optimization-as-a-service over cloud are driving the evolution of the network optimization services market. In the last 5 years, the enterprises have become much more sensitive about the smooth delivery and visibility of applications over the network. The numerous software applications used by the companies are now being converted to web-based versions, which enable easy accessibility to the remote employees of the businesses. The cloud-based solutions for network optimization appeals both to the enterprises and small companies. This is one of the significant factors that has fueled the market growth. The cloud-based network optimization solutions is gaining the market share, due to the advent of advanced technologies and is boosting network optimization market growth.
Moreover, the fact that network optimization enables seamless data transmission and removes latency issues is another major driving factor for this market. One of the biggest drivers for this market is the easy transmission of high-memory content over the networks, handling high data traffic. The rapid adoption of network optimization solutions continue to gain momentum in the North America and APAC market. This is attributable to the significant leap forward in WAN and RAN optimization technology.
The network optimization services market research report outlines the key trends, and market sizing and forecasting for various emerging sub segments of the market. The report also emphasizes on key global adoption trends, future growth potential submarkets, key drivers, competitive outlook, restraints, and opportunities of optical network market ecosystem. It also provides insights into the current and future revenues of market from 2017 to 2022 and is aimed to provide the reader with an understanding of market drivers, current and upcoming players, and competitive landscape.
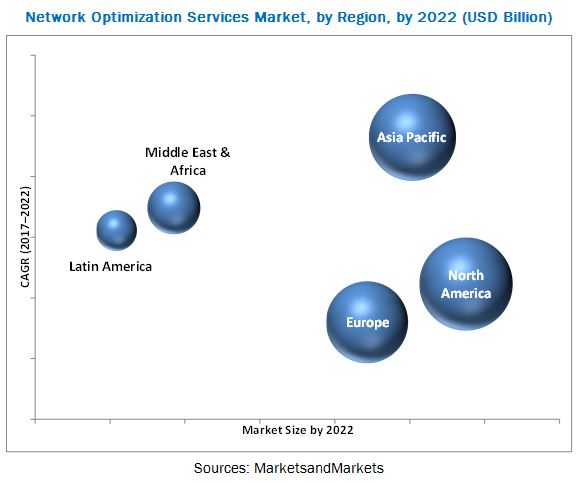
The global network optimization services market has been segmented by 5 major geographic regions: North America, Europe, Asia Pacific (APAC), Middle East and Africa (MEA), and Latin America to provide a region-specific analysis in the report. North America is expected to have the largest market share and is projected to continue to dominate the market during the forecast period. North America is rapidly adopting emerging technologies, such as smartphones and cloud platforms. Major growth drivers of the market include increased cloud deployments and growing adoption of online service delivery. Furthermore, organizations in this region have adopted inorganic growth strategies to strengthen their presence across the world. However, variation in performance over cloud and lack of enterprise expertise are hindering the growth of the market.
Available Customizations
With the given market data, MarketsandMarkets offers customizations as per the company�s specific needs. The following customization options are available for the report:
Product Analysis
- Product matrix that gives a detailed comparison of the product portfolio of each company
Geographic Analysis
- Further breakdown of the North American Network Optimization Services market into countries
- Further breakdown of the European market into countries
- Further breakdown of the APAC market into countries
- Further breakdown of the MEA market into countries
- Further breakdown of the Latin American market into countries
Company Information
- Detailed analysis and profiling of additional market players
To speak to our analyst for a discussion on the above findings, click Speak to Analyst
Table of Contents
1 Introduction (Page No. - 14)
1.1 Objectives of the Study
1.2 Market Definition
1.3 Market Scope
1.4 Years Considered for the Study
1.5 Currency
1.6 Stakeholders
2 Research Methodology (Page No. - 18)
2.1 Research Data
2.1.1 Secondary Data
2.1.2 Primary Data
2.1.2.1 Breakdown of Primaries
2.1.2.2 Key Industry Insights
2.2 Market Size Estimation
2.3 Research Assumptions and Limitations
2.3.1 Assumptions
2.3.2 Limitations
3 Executive Summary (Page No. - 24)
4 Premium Insights (Page No. - 26)
4.1 Attractive Market Opportunities in the Network Optimization Services Market
4.2 Market By Industry Vertical and Region
4.3 Market By Deployment Type
4.4 Market By Service
4.5 Market By Organization Size
4.6 Market Potential
4.7 Life Cycle Analysis, By Region, 2017
5 Market Overview and Industry Trends (Page No. - 30)
5.1 Introduction
5.2 Innovation Spotlight
5.3 Market Dynamics
5.3.1 Drivers
5.3.1.1 Increasing Number of Branch Offices and Data Centers
5.3.1.2 Growth in the Usage of IP Video and Virtualization
5.3.1.3 Network Optimization as A Cloud Service and Advent of IoT
5.3.2 Restraints
5.3.2.1 High Capex Investment and Budgetary Constraints on IT Investments
5.3.2.2 Difficulty in Delivery of Latency-Sensitive Applications Such as VoIP and Video Content
5.3.3 Opportunities
5.3.3.1 Spur in Demand for Network Optimization Systems for Business Operations
5.3.3.2 Technological Advancements in Network Infrastructure
5.3.4 Challenges
5.3.4.1 Variation in Performance Over Cloud
5.3.4.2 Lack of Enterprise Expertise
6 Network Optimization Services Market, By Service (Page No. - 35)
6.1 Introduction
6.2 Implementation Services
6.3 Consulting Services
6.4 Support and Maintenance Services
6.5 Managed Services
7 Market, By Application Type (Page No. - 40)
7.1 Introduction
7.2 Local Network Optimization
7.3 WAN Optimization
7.4 RAN Optimization
7.5 Data Center Optimization
8 Network Optimization Services Market, By Deployment Type (Page No. - 45)
8.1 Introduction
8.2 Cloud
8.3 On-Premises
9 Market, By Organization Size (Page No. - 49)
9.1 Introduction
9.2 Small and Medium-Sized Enterprises
9.3 Large Enterprises
10 Network Optimization Services Market, By Industry Vertical (Page No. - 53)
10.1 Introduction
10.2 Banking, Financial Services, and Insurance
10.3 Telecom
10.4 Government and Defense
10.5 Transportation and Logistics
10.6 Travel and Tourism
10.7 Manufacturing
10.8 Consumer Goods and Retail
10.9 Media and Entertainment
10.10 Energy and Utilities
10.11 Healthcare and Life Sciences
10.12 Education
10.13 Information Technology
10.14 Others
11 Network Optimization Services Market, By Region (Page No. - 64)
11.1 Introduction
11.2 North America
11.3 Europe
11.4 Asia Pacific
11.5 Middle East and Africa
11.6 Latin America
12 Competitive Landscape (Page No. - 85)
12.1 Overview
12.2 Market Ranking
12.3 Competitive Scenario
12.3.1 New Product/Solution Launches
12.3.2 Expansions
12.3.3 Acquisitions
12.3.4 Agreements
13 Company Profiles (Page No. - 89)
13.1 Riverbed Technology
(Business Overview, Products Offered, Recent Developments, SWOT Analysis and MnM View)
13.2 Solarwinds
13.3 Cisco Systems
13.4 Huawei
13.5 Nokia Corporation
13.6 ZTE
13.7 Infovista
13.8 Citrix
13.9 Circadence
13.10 Fatpipe Networks
13.11 Netscout Systems
13.12 Silver Peak
13.13 Array Networks
*Details on Business Overview, Products Offered, Recent Developments, SWOT Analysis and MnM View Might Not Be Captured in Case of Unlisted Companies.
13.14 Key Innovators
13.14.1 Sangfor Technologies
13.14.1.1 Overview
13.14.1.2 Key Strategies
14 Appendix (Page No. - 123)
14.1 Key Industry Insights
14.2 Discussion Guide
14.3 Knowledge Store: Marketsandmarkets� Subscription Portal
14.4 Introducing RT: Real-Time Market Intelligence
14.5 Related Reports
14.6 Author Details
List of Tables (63 Tables)
Table 1 United States Dollar Exchange Rate, 2014�2016
Table 2 Network Optimization Services Market Size, By Service, 2015�2022 (USD Million)
Table 3 Implementation Services: Market Size, By Region, 2015�2022 (USD Million)
Table 4 Consulting Services: Market Size, By Region, 2015�2022 (USD Million)
Table 5 Support and Maintenance Services: Market Size, By Region, 2015�2022 (USD Million)
Table 6 Managed Services: Market Size, By Region, 2015�2022 (USD Million)
Table 7 Market Size, By Application Type, 2015�2022 (USD Million)
Table 8 Local Network Optimization: Market Size, By Region, 2015�2022 (USD Million)
Table 9 WAN Optimization: Market Size, By Region, 2015�2022 (USD Million)
Table 10 RAN Optimization: Market Size, By Region, 2015�2022 (USD Million)
Table 11 Data Center Optimization: Market Size, By Region, 2015�2022 (USD Million)
Table 12 Network Optimization Services Market Size, By Deployment Type, 2015�2022 (USD Million)
Table 13 Cloud: Market Size, By Region, 2015�2022 (USD Million)
Table 14 On-Premises: Market Size, By Region, 2015�2022 (USD Million)
Table 15 Market Size, By Organization Size, 2015�2022 (USD Million)
Table 16 Small and Medium-Sized Enterprises: Market Size, By Region, 2015�2022 (USD Million)
Table 17 Large Enterprises: Market Size, By Region, 2015�2022 (USD Million)
Table 18 Network Optimization Services Market Size, By Industry Vertical, 2015�2022 (USD Million)
Table 19 Banking, Financial Services, and Insurance: Market Size, By Region, 2015�2022 (USD Million)
Table 20 Telecom: Market Size, By Region, 2015�2022 (USD Million)
Table 21 Government and Defense: Market Size, By Region, 2015�2022 (USD Million)
Table 22 Transportation and Logistics: Market Size, By Region, 2015�2022 (USD Million)
Table 23 Travel and Tourism: Market Size, By Region, 2015�2022 (USD Million)
Table 24 Manufacturing: Market Size, By Region, 2015�2022 (USD Million)
Table 25 Consumer Goods and Retail: Network Optimization Services MarketSize, By Region, 2015�2022 (USD Million)
Table 26 Media and Entertainment: Market Size, By Region, 2015�2022 (USD Million)
Table 27 Energy and Utilities: Market Size, By Region, 2015�2022 (USD Million)
Table 28 Healthcare and Life Sciences: Market Size, By Region, 2015�2022 (USD Million)
Table 29 Education: Market Size, By Region, 2015�2022 (USD Million)
Table 30 Information Technology: Market Size, By Region, 2015�2022 (USD Million)
Table 31 Others: Market Size, By Region, 2015�2022 (USD Million)
Table 32 Network Optimization Services Market Size, By Region, 2015�2022 (USD Million)
Table 33 North America: Market Size, By Country, 2015�2022 (USD Million)
Table 34 North America: Market Size, By Service, 2015�2022 (USD Million)
Table 35 North America: Market Size, By Application Type, 2015�2022 (USD Million)
Table 36 North America: Market Size, By Deployment Type, 2015�2022 (USD Million)
Table 37 North America: Market Size, By Organization Size, 2015�2022 (USD Million)
Table 38 North America:Network Optimization Services Market Size, By Industry Vertical, 2015�2022 (USD Million)
Table 39 Europe: Market Size, By Country, 2015�2022 (USD Million)
Table 40 Europe: Market Size, By Service, 2015�2022 (USD Million)
Table 41 Europe: Market Size, By Application Type, 2015�2022 (USD Million)
Table 42 Europe: Market Size, By Deployment Type, 2015�2022 (USD Million)
Table 43 Europe: Market Size, By Organization Size, 2015�2022 (USD Million)
Table 44 Europe: Market Size, By Industry Vertical, 2015�2022 (USD Million)
Table 45 Asia Pacific: Network Optimization Services Market Size, By Country, 2015�2022 (USD Million)
Table 46 Asia Pacific: Market Size, By Service, 2015�2022 (USD Million)
Table 47 Asia Pacific: Market Size, By Application Type, 2015�2022 (USD Million)
Table 48 Asia Pacific: Market Size, By Deployment Type, 2015�2022 (USD Million)
Table 49 Asia Pacific: Market Size, By Organization Size, 2015�2022 (USD Million)
Table 50 Asia Pacific: Market Size, By Industry Vertical, 2015�2022 (USD Million)
Table 51 Middle East and Africa: Network Optimization Services Market Size, By Country, 2015�2022 (USD Million)
Table 52 Middle East and Africa: Market Size, By Service, 2015�2022 (USD Million)
Table 53 Middle East and Africa: Market Size, By Application Type, 2015�2022 (USD Million)
Table 54 Middle East and Africa: Market Size, By Deployment Type, 2015�2022 (USD Million)
Table 55 Middle East and Africa: Market Size, By Organization Size, 2015�2022 (USD Million)
Table 56 Middle East and Africa: Market Size, By Industry Vertical, 2015�2022 (USD Million)
Table 57 Latin America: Network Optimization Services Market Size, By Country, 2015�2022 (USD Million)
Table 58 Latin America: Market Size, By Service, 2015�2022 (USD Million)
Table 59 Latin America: Market Size, By Application Type, 2015�2022 (USD Million)
Table 60 Latin America: Market Size, By Deployment Type, 2015�2022 (USD Million)
Table 61 Latin America: Market Size, By Organization Size, 2015�2022 (USD Million)
Table 62 Latin America: Market Size, By Industry Vertical, 2015�2022 (USD Million)
Table 63 Market Ranking for the Market 2017
List of Figures (38 Figures)
Figure 1 Network Optimization Services Market Segmentation
Figure 2 Regional Scope
Figure 3 Market Research Design
Figure 4 Data Triangulation
Figure 5 Market Size Estimation Methodology: Bottom-Up Approach
Figure 6 Market Size Estimation Methodology: Top-Down Approach
Figure 7 Network Optimization Services Market: Assumptions
Figure 8 Top 3 Segments for the Market in 2017
Figure 9 North America is Estimated to Hold the Largest Market Share in 2017
Figure 10 WAN and RAN Optimizations are Expected to Be Attractive Opportunities in the Market During the Forecast Period
Figure 11 Manufacturing Industry Vertical and North America are Estimated to Hold the Largest Market Shares in 2017
Figure 12 Cloud Deployment Type is Expected to Grow at A Higher CAGR During the Forecast Period
Figure 13 Support and Maintenance Services Segment is Expected to Grow at the Highest CAGR During the Forecast Period
Figure 14 Small and Medium-Sized Enterprises Segment is Expected to Grow at A Higher CAGR During the Forecast Period
Figure 15 Asia Pacific is Expected to Grow at the Highest CAGR During the Forecast Period
Figure 16 Asia Pacific is the Fastest Growing Region in the Network Optimization Services Market
Figure 17 Market: Drivers, Restraints, Opportunities, and Challenges
Figure 18 Support and Maintenance Services Segment is Expected to Grow at the Highest CAGR During the Forecast Period
Figure 19 WAN Optimization Segment is Expected to Grow at the Highest CAGR During the Forecast Period
Figure 20 Cloud Deployment Type is Expected to Grow at A Higher CAGR During the Forecast Period
Figure 21 Small and Medium-Sized Enterprises Segment is Expected to Grow at A Higher CAGR During the Forecast Period
Figure 22 Telecom Industry Vertical is Expected to Grow at the Highest CAGR During the Forecast Period
Figure 23 Asia Pacific is Expected to Grow at the Highest CAGR During the Forecast Period
Figure 24 Asia Pacific is Expected to Witness the Highest Growth Rate During the Forecast Period in the Network Optimization Services Market
Figure 25 North America: Market Snapshot
Figure 26 Support and Maintenance Services Segment is Expected to Grow at the Highest CAGR During the Forecast Period in North America
Figure 27 Support and Maintenance Services Segment is Expected to Grow at the Highest CAGR During the Forecast Period in Europe
Figure 28 Asia Pacific: Market Snapshot
Figure 29 Managed Services Segment is Expected to Grow at the Highest CAGR During the Forecast Period in Asia Pacific
Figure 30 Consulting Services Segment is Expected to Grow at the Highest CAGR During the Forecast Period in Middle East and Africa
Figure 31 Consulting Services Segment is Expected to Grow at the Highest CAGR During the Forecast Period in Latin America
Figure 32 Key Developments By Leading Players in the Network Optimization Services Market for 2014�2017
Figure 33 Cisco Systems: Company Snapshot
Figure 34 Huawei: Company Snapshot
Figure 35 Nokia Corporation: Company Snapshot
Figure 36 ZTE: Company Snapshot
Figure 37 Citrix: Company Snapshot
Figure 38 Netscout Systems: Company Snapshot


Growth opportunities and latent adjacency in Network Optimization Services Market