Broadcast Equipment Market

Broadcast Equipment Market by Type (Dish Antennas, Amplifiers, Encoders, Video Servers, Transmitters, Modulators, Power Control Systems), Technology (Analog & Digital), Radio Modulation (Amplitude & Frequency) & Region - Global Forecast to 2028

Report Code: SE 5483 Sep, 2023, by marketsandmarkets.com

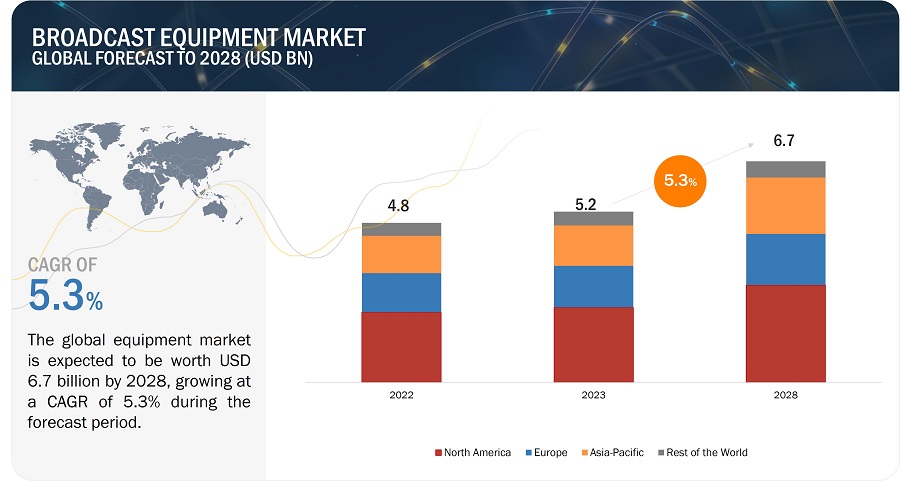
[252 Pages Report] The global broadcast equipment market size was valued at USD 5.2 billion in 2023 and is estimated to reach USD 6.7 billion by 2028, registering a CAGR of 5.3% during the forecast period. Growing digitalization and technological advancements has driven the need for advanced equipment to support higher-quality audio and video transmission. Also, the rise of D2C streaming platforms has created a need for equipment that can support seamless streaming, on-demand content delivery, and personalized viewer experiences. These factors are fueling the market growth.
Broadcast Equipment Market

Broadcast Equipment Market

Broadcast Equipment Market Forecast to 2028

To know about the assumptions considered for the study, Request for Free Sample Report

Market Dynamics:

Driver: Growing Investments in Content Production is driving the market

In today's media landscape, people want to watch top-notch content whenever they want and in the best quality. This has put pressure on broadcasters to come up with exciting shows, movies, documentaries, live events, and more. To make this kind of captivating content, broadcasters and creators need really good broadcasting equipment. This includes things like cameras, video production gear, audio recording tools, editing software, and more. With these tools, professionals can create content that looks and sounds amazing, making it stand out in the crowded media world. Hence, when broadcasters invest in making great content, they also need to invest in top-notch equipment to do it right. This equipment helps them produce high-quality and interesting content that grabs the audience's attention. Since content is at the core of the broadcasting industry, these investments will keep driving the demand for broadcasting equipment.

Restraint: Complexities due to rapid change in broadcasting technologies

In recent times, broadcasting technologies have been advancing at an unprecedented pace. This includes the move towards high-definition (HD) and ultra-high-definition (UHD) content, the adoption of IP-based workflows, virtual reality (VR), augmented reality (AR), and the use of cloud-based services. This swift transformation is primarily driven by the expectations of a more digitally connected audience and the necessity for media companies to maintain their competitiveness and provide exceptional viewer experiences.However, this rapid evolution presents challenges for broadcasters and content creators when it comes to investing in broadcasting equipment. What is considered cutting-edge today could quickly become outdated due to the rapid emergence of newer technologies..

Opportunity: Rapid Urbanizatin and Digital Transformation creates opportunity for broadcast equipment manufacturers

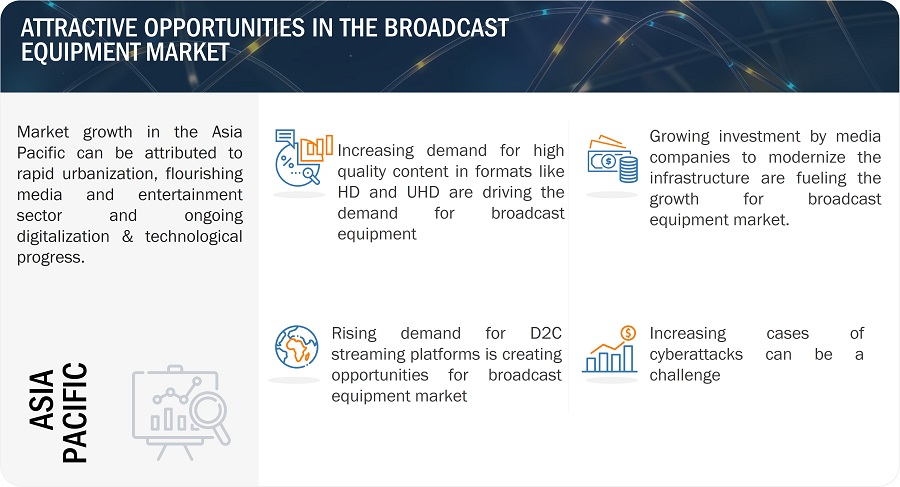
The rapid growth of cities is closely linked to economic progress and technological advancements. This presents an exciting opportunity for the broadcasting equipment market because cities have a diverse and concentrated population. Urban areas often have excellent infrastructure, including high-speed internet and advanced communication networks. This creates a favorable environment for broadcasters to reach a large and engaged audience. As emerging markets go through digital transformations, there's a big change in how people consume media and content. This shift has created new possibilities for equipment manufacturers. The introduction of high-speed internet access in these markets has led to a surge in online streaming, video-on-demand, and over-the-top (OTT) services. This is creating an opportunity for the broadcasting equipment manufacturers

Challenge: Increasing cases of cyberattacks

Cyberattacks can inflict significant harm on a company, both in terms of financial losses and damage to its reputation. These attacks can potentially compromise users' data, including valuable content and sensitive information on a broadcasting operator's channel. Regardless of how robust a system's security measures may be, there are always vulnerabilities, which can make the system susceptible to cyber threats. The broadcasting equipment market heavily relies on various technologies, such as IT systems, the internet, internal networks, and web-connected networks, for tasks like content production, storage, and delivery. Given its importance within the broadcast equipment market, safeguarding data becomes a top priority. The challenge with cybersecurity is that cyberattacks are challenging to prevent and detect in real-time, which poses obstacles to the growth of the broadcasting equipment market.

Broadcast Equipment Market Ecosystem

The broadcast equipment market is consolidated, with major companies such as Cisco Systems Inc., Telefonaktiebolaget LM Ericsson, CommScope, Evertz Microsystems, Ltd, Harmonic Inc., and numerous small- and medium-sized enterprises. Almost all players offer various products, including amplifiers, modulators, encoders, and transmitters. These components are used for applications including radio as well as television.
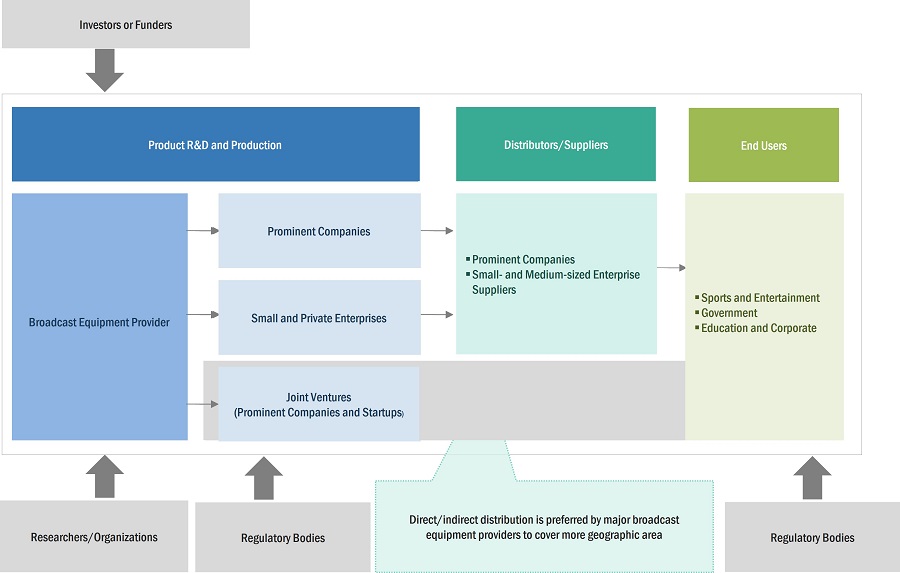
Broadcast Equipment Markett by Ecosystem

Based on technology, Digital broadcasting segment is expected to dominate during the forecast period.

The digital broadcasting is expected to dominate the broadcast equipment market during the forecast period. The proliferation of digital television sets, set-top boxes, and smart TVs is driving the demand for digital broadcasting. Viewers with these devices expect digital content, compelling broadcasters to invest in digital equipment. Also, The growth of online streaming services, video-on-demand (VOD) platforms, and over-the-top (OTT) content delivery has expanded the digital broadcasting ecosystem.  These factors are having the positive impact on the market growth.

Based on application, the television segment is projected to have largest market share during the forecast period

Television has an extensive and enduring consumer base worldwide. It remains a primary source of news, entertainment, and information for billions of households. This consistent viewership drives the demand for broadcast equipment dedicated to television broadcasting. The television content is delivered through various platforms, including terrestrial, cable, satellite, and digital streaming. Each platform requires specialized equipment to ensure seamless transmission. Moreover, Governments in many countries invest in broadcasting infrastructure and technology. These factors are contributing towards the higher demand for broadcasting equipment for television applications.

Based on region, Asia Pacific is projected to grow fastest for the broadcast equipment market

Many countries in the Asia-Pacific region are experiencing robust economic growth, resulting in increased consumer spending and a growing middle class. This economic prosperity is driving demand for high-quality content and entertainment, leading to investments in broadcast equipment. Also, The media and entertainment industry in Asia-Pacific is expanding rapidly. The region is home to a large and diverse audience, leading to investments in content production and broadcasting infrastructure to cater to these markets thereby driving the market growth.
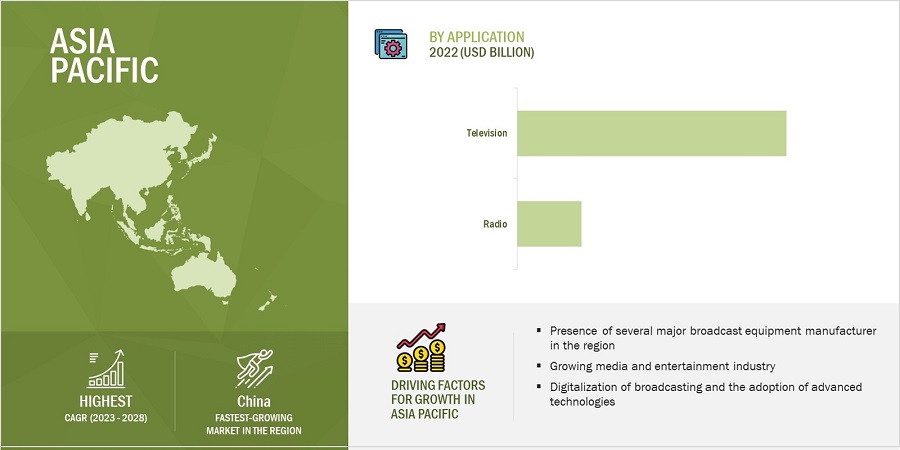
Broadcast Equipment Market by Region

Broadcast Equipment Market by Region

To know about the assumptions considered for the study, download the pdf brochure

Key Market Players

The broadcast equipment comoanies is dominated by a few globally established players such as Cisco Systems Inc., (US), Telefonaktiebolaget LM Ericsson (Sweden), CommScope (US), Evertz Microsystems, Ltd (Canada), Harmonic Inc. (US), EVS Broadcast Equipment (Belgium), Grass Valley (Canada), Wellav Technologies Ltd. (China), Eletec Broadcast Telecom S.A.R.L (France), and Clyde Broadcast (UK).

Get online access to the report on the World's First Market Intelligence Cloud

  • Easy to Download Historical Data & Forecast Numbers
  • Company Analysis Dashboard for high growth potential opportunities
  • Research Analyst Access for customization & queries
  • Competitor Analysis with Interactive dashboard
  • Latest News, Updates & Trend analysis
Request Sample

Scope of the Report

Report Metric

Details

Estimated Value

USD 5.2 billion

Expected Value 

USD 6.7 billion

Growth Rate

CAGR of 5.3%

Market Size Availability for Years

2019–2028

Base Year

2022

Forecast Period

2023–2028

Forecast Units

Value (USD)

Segments Covered

By type, technology, application, and region

Geographies Covered

North America, Europe, Asia Pacific, and Rest of the world

Companies Covered

Cisco Systems Inc., (US), Telefonaktiebolaget LM Ericsson (Sweden), CommScope (US), Evertz Microsystems, Ltd (Canada), Harmonic Inc. (US), EVS Broadcast Equipment (Belgium), Grass Valley (Canada), Wellav Technologies Ltd. (China), Eletec Broadcast Telecom S.A.R.L (France), and Clyde Broadcast (UK)

Broadcast Equipment Market Highlights

This research report categorizes the broadcast equipment market based on type, technology, application, and region

Segment

Subsegment

Based on type:

  • Dish Antennas
  • Amplifiers
  • Switches
  • Encoders
  • Video Servers
  • Transmitters/Repeaters
  • Modulators
  • Others

Based on technology:

  • Analog Broadcasting
  • Digital Broadcasting

Based on application:

  • Radio
    • Amplitude Modulation
    • Frequency Modulation
  • Television

Based on region:

  • North America
    • US
    • Canada
    • Mexico
  • Europe
    • Germany
    • UK
    • France
    • Italy
    • Rest of Europe
  • Asia Pacific (APAC)
    • China
    • Japan
    • South Korea
    • India
    • Taiwan
    • Rest of APAC
  • Rest of the world (RoW)
    • South America
    • Middle East and Africa

Recent Developments

  • In July 2023, Telefonaktiebolaget LM Ericsson has collaborated with Vodafone and have initiated the rollout of a compact active-passive antenna. This endeavor aims to enhance 5G capacity, coverage, and performance without increasing the physical space taken up by antennas.
  • In June 2023, Cisco and the Tribeca Festival have partnered having a mutual goal of promoting inclusivity. Cisco's Webex will take on the role of the official technology partner for the 2023 closing gala of the Tribeca Festival, which is titled "A Bronx Tale." Notably, this marks the first occasion where the festival's closing event will be made available for on-demand streaming through Webex Events, alongside the traditional live presentation at New York City's Beacon Theatre.
  • In January 2023, CommScope, a renowned provider of network connectivity solutions on a global scale, has made an announcement regarding RUCKUS Networks. RUCKUS Networks is introducing a fresh line of edge switches that are both scalable and designed for entry-level usage. Notably, these switches come equipped with 25 Gbps uplink ports. This collection also encompasses the maiden entry-level enterprise switch capable of providing fiber-to-the-room connectivity.
  • In April 2022, CommScope, a prominent figure in the domain of home network solutions worldwide, has joined forces with Orange Belgium. This partnership aims to equip Orange Belgium's subscribers with cutting-edge set-top boxes driven by the Android TV operating system. These set-top boxes are designed to offer a seamless blend of live television and high-quality streaming services.
  • In January 2022, CommScope, in collaboration with ViacomCBS, has unveiled the launch of FAVE. Additionally, ViacomCBS has successfully transitioned its DABL and certain SHOWTIME linear channels from satellite-based distribution to the advanced Content Delivery Network (CDN) IP distribution. This transformation has been accomplished using CommScope's innovative DigiCipher Streaming system

Frequently Asked Questions (FAQs):

To speak to our analyst for a discussion on the above findings, click Speak to Analyst

TABLE OF CONTENTS
 
1 INTRODUCTION (Page No. - 32)
    1.1 STUDY OBJECTIVES 
    1.2 MARKET DEFINITION 
    1.3 STUDY SCOPE 
           1.3.1 MARKETS COVERED
                    FIGURE 1 BROADCAST EQUIPMENT MARKET: SEGMENTATION
           1.3.2 REGIONAL SCOPE
           1.3.3 YEARS CONSIDERED
    1.4 CURRENCY CONSIDERED 
    1.5 STAKEHOLDERS 
    1.6 SUMMARY OF CHANGES 
    1.7 RECESSION ANALYSIS 
 
2 RESEARCH METHODOLOGY (Page No. - 36)
    2.1 RESEARCH DATA 
           FIGURE 2 BROADCAST EQUIPMENT MARKET: RESEARCH DESIGN
           2.1.1 SECONDARY DATA
                    2.1.1.1 List of key secondary sources
                    2.1.1.2 Secondary sources
           2.1.2 PRIMARY DATA
                    2.1.2.1 Key data from primary sources
                    2.1.2.2 Key industry insights
                    2.1.2.3 Breakdown of primaries
    2.2 FACTOR ANALYSIS 
           FIGURE 3 MARKET SIZE ESTIMATION METHODOLOGY: BOTTOM-UP APPROACH (SUPPLY SIDE)—REVENUE GENERATED BY COMPANIES FROM SALES OF BROADCAST EQUIPMENT
    2.3 MARKET SIZE ESTIMATION 
           2.3.1 BOTTOM-UP APPROACH
                    2.3.1.1 Approach to estimate market share using bottom-up analysis
                               FIGURE 4 MARKET SIZE ESTIMATION METHODOLOGY: BOTTOM-UP APPROACH
           2.3.2 TOP-DOWN APPROACH
                    2.3.2.1 Approach to estimate market share using top-down analysis (supply side)
                               FIGURE 5 TOP-DOWN APPROACH
    2.4 DATA TRIANGULATION 
           FIGURE 6 DATA TRIANGULATION
    2.5 RESEARCH ASSUMPTIONS 
    2.6 RESEARCH ASSUMPTIONS PERTAINING TO RECESSION 
           TABLE 1 PARAMETERS CONSIDERED TO ANALYZE IMPACT OF RECESSION
 
3 EXECUTIVE SUMMARY (Page No. - 47)
    FIGURE 7 DIGITAL BROADCASTING SEGMENT TO EXHIBIT HIGHER CAGR IN MARKET DURING FORECAST PERIOD
    FIGURE 8 TELEVISIONS SEGMENT TO CAPTURE LARGER SIZE OF MARKET IN 2028
    FIGURE 9 ENCODERS SEGMENT TO DOMINATE MARKET IN 2028
    FIGURE 10 NORTH AMERICA HELD LARGEST SHARE OF MARKET IN 2022
 
4 PREMIUM INSIGHTS (Page No. - 51)
    4.1 ATTRACTIVE OPPORTUNITIES FOR PLAYERS IN BROADCAST EQUIPMENT MARKET 
           FIGURE 11 GROWING SUBSCRIPTIONS OF OVER-THE-TOP (OTT) STREAMING PLATFORMS TO FUEL GROWTH OF MARKET DURING FORECAST PERIOD
    4.2 MARKET, BY TYPE 
           FIGURE 12 VIDEO SERVERS SEGMENT TO HOLD LARGEST SHARE OF MARKET IN 2028
    4.3 MARKET, BY TECHNOLOGY AND APPLICATION 
           FIGURE 13 DIGITAL BROADCASTING AND TELEVISIONS SEGMENTS TO ACCOUNT FOR LARGER SHARES OF MARKET IN 2028
    4.4 MARKET, BY REGION 
           FIGURE 14 CHINA TO RECORD HIGHEST CAGR IN OVERALL BROADCAST EQUIPMENT MARKET DURING FORECAST PERIOD
 
5 MARKET OVERVIEW (Page No. - 54)
    5.1 INTRODUCTION 
    5.2 MARKET DYNAMICS 
           FIGURE 15 BROADCAST EQUIPMENT MARKET: DRIVERS, RESTRAINTS, OPPORTUNITIES, AND CHALLENGES
           5.2.1 DRIVERS
                    5.2.1.1 Rapid growth in over-the-top (OTT) subscriptions
                               FIGURE 16 RISE IN NUMBER OF OTT PLATFORMS FROM 2018 TO 2021
                    5.2.1.2 Increased demand for encoders to support multiple formats
                    5.2.1.3 Transition from analog to digital broadcasting
                    5.2.1.4 Growing investments in content production
                               FIGURE 17 MARKET DRIVERS AND THEIR IMPACT
           5.2.2 RESTRAINTS
                    5.2.2.1 Rise in instances of cyberattacks
                    5.2.2.2 Advancements in broadcasting technologies
                               FIGURE 18 BROADCAST EQUIPMENT MARKET RESTRAINTS AND THEIR IMPACT
           5.2.3 OPPORTUNITIES
                    5.2.3.1 Implementation of AI-based technologies for broadcasting
                    5.2.3.2 Rapid urbanization and digital transformation
                               FIGURE 19 MARKET OPPORTUNITIES AND THEIR IMPACT
           5.2.4 CHALLENGES
                    5.2.4.1 Limited ultra-high-definition (UHD) content or 4K streaming
                               FIGURE 20 MARKET CHALLENGES AND THEIR IMPACT
    5.3 SUPPLY CHAIN ANALYSIS 
           FIGURE 21 BROADCAST EQUIPMENT MARKET: SUPPLY CHAIN ANALYSIS
    5.4 ECOSYSTEM MAPPING 
           FIGURE 22 ECOSYSTEM ANALYSIS
           TABLE 2 ROLE OF PARTICIPANTS IN ECOSYSTEM
    5.5 PRICING ANALYSIS 
           5.5.1 PRICING ANALYSIS OF MARKET BASED ON TYPE, BY KEY PLAYERS
                    FIGURE 23 AVERAGE SELLING PRICE OF BROADCAST EQUIPMENT, BY KEY PLAYER
                    TABLE 3 AVERAGE SELLING PRICE OF BROADCAST EQUIPMENT, BY KEY PLAYER (USD)
           5.5.2 INDICATIVE SELLING PRICE TREND
                    TABLE 4 INDICATIVE SELLING PRICE OF BROADCAST EQUIPMENT, BY REGION (USD)
    5.6 TRENDS/DISRUPTIONS IMPACTING CUSTOMER BUSINESS 
           FIGURE 24 REVENUE SHIFTS AND NEW REVENUE POCKETS FOR MARKET PLAYERS
    5.7 TECHNOLOGY ANALYSIS 
           5.7.1 5G CONNECTIVITY
           5.7.2 ARTIFICIAL INTELLIGENCE (AI)
           5.7.3 VIDEO COMPRESSION AND STREAMING PROTOCOLS
           5.7.4 REMOTE PRODUCTION SOLUTIONS
    5.8 PORTER’S FIVE FORCES ANALYSIS 
           FIGURE 25 BROADCAST EQUIPMENT MARKET: PORTER’S FIVE FORCES MODEL
           TABLE 5 MARKET: PORTER’S FIVE FORCES ANALYSIS
    5.9 KEY STAKEHOLDERS AND BUYING CRITERIA 
           5.9.1 KEY STAKEHOLDERS IN BUYING PROCESS
                    FIGURE 26 INFLUENCE OF STAKEHOLDERS ON BUYING PROCESS, BY APPLICATION
                    TABLE 6 INFLUENCE OF STAKEHOLDERS ON BUYING PROCESS, BY APPLICATION (%)
           5.9.2 BUYING CRITERIA
                    FIGURE 27 KEY BUYING CRITERIA, BY APPLICATION
                    TABLE 7 KEY BUYING CRITERIA, BY APPLICATION
    5.10 CASE STUDY ANALYSIS 
           TABLE 8 WELLAV SMP100 HELPED PROVIDE BROADCASTING SERVICES ON SOUTH PACIFIC ISLANDS
           TABLE 9 NEC CORPORATION HELPED FUJI TELEVISION NETWORK CREATE STRUCTURE AND TRANSMISSION EQUIPMENT TO CONTINUE BROADCASTING IN EMERGENCIES
           TABLE 10 EVERTZ MICROSYSTEMS HELPED SPORTSNET BUILD SCALABLE REPLAY PLATFORM
           TABLE 11 GRASS VALLEY HELPED NEWS 12 MEET CONSUMER DEMAND FOR SEAMLESS CONTENT DISTRIBUTION
           TABLE 12 SCIENTOLOGY NETWORK USED GRASS VALLEY SOLUTIONS FOR GLOBAL REACH
    5.11 TRADE ANALYSIS 
           5.11.1 IMPORT SCENARIO
                    FIGURE 28 IMPORT DATA, BY KEY COUNTRY, 2018–2022 (USD MILLION)
           5.11.2 EXPORT SCENARIO
                    FIGURE 29 EXPORT DATA, BY KEY COUNTRY, 2018–2022 (USD MILLION)
    5.12 PATENT ANALYSIS 
           FIGURE 30 TOP 10 COMPANIES WITH HIGHEST NUMBER OF PATENT APPLICATIONS FROM 2013 TO 2023
           TABLE 13 TOP 20 PATENT OWNERS IN US FROM 2013 TO 2023
           FIGURE 31 NUMBER OF PATENTS GRANTED PER YEAR FROM 2013 TO 2023
           TABLE 14 LIST OF PATENTS IN BROADCAST EQUIPMENT MARKET
    5.13 KEY CONFERENCES AND EVENTS, 2023–2024 
           TABLE 15 BROADCAST EQUIPMENT MARKET: LIST OF CONFERENCES AND EVENTS
    5.14 STANDARDS AND REGULATORY LANDSCAPE 
           5.14.1 REGULATORY BODIES, GOVERNMENT AGENCIES, AND OTHER ORGANIZATIONS
                    TABLE 16 NORTH AMERICA: LIST OF REGULATORY BODIES, GOVERNMENT AGENCIES, AND OTHER ORGANIZATIONS
                    TABLE 17 EUROPE: LIST OF REGULATORY BODIES, GOVERNMENT AGENCIES AND OTHER ORGANIZATIONS
                    TABLE 18 ASIA PACIFIC: LIST OF REGULATORY BODIES, GOVERNMENT AGENCIES AND OTHER ORGANIZATIONS
                    TABLE 19 REST OF THE WORLD: LIST OF REGULATORY BODIES, GOVERNMENT AGENCIES AND OTHER ORGANIZATIONS
           5.14.2 CODECS AND STANDARDS RELATED TO BROADCAST EQUIPMENT
                    TABLE 20 CODECS AND STANDARDS RELATED TO BROADCAST EQUIPMENT
 
6 BROADCAST EQUIPMENT MARKET, BY FREQUENCY (QUALITATIVE ANALYSIS) (Page No. - 83)
    6.1 INTRODUCTION 
    6.2 LOW FREQUENCY 
    6.3 MEDIUM FREQUENCY 
    6.4 HIGH FREQUENCY 
    6.5 VERY HIGH FREQUENCY 
    6.6 ULTRA-HIGH FREQUENCY 
    6.7 SUPER HIGH FREQUENCY 
 
7 BROADCAST EQUIPMENT MARKET, BY VERTICAL (QUALITATIVE ANALYSIS) (Page No. - 85)
    7.1 SPORTS AND ENTERTAINMENT 
    7.2 GOVERNMENT 
    7.3 EDUCATION AND CORPORATE 
 
8 BROADCAST EQUIPMENT MARKET, BY TYPE (Page No. - 87)
    8.1 INTRODUCTION 
           FIGURE 32 BROADCAST EQUIPMENT MARKET, BY TYPE
           FIGURE 33 VIDEO SERVERS TO RECORD HIGHEST CAGR DURING FORECAST PERIOD
           TABLE 21 MARKET, BY TYPE, 2019–2022 (USD MILLION)
           TABLE 22 MARKET, BY TYPE, 2023–2028 (USD MILLION)
    8.2 DISH ANTENNAS 
           8.2.1 DEPLOYMENT IN SATELLITE BROADCASTING FOR FLEXIBLE TRANSMISSIONS TO DRIVE MARKET
    8.3 AMPLIFIERS 
           8.3.1 RISING DEMAND FOR ENHANCED SIGNAL QUALITY TO FUEL SEGMENTAL GROWTH
    8.4 SWITCHES 
           8.4.1 NEED FOR SEAMLESS CONTENT DISTRIBUTION TO CONTRIBUTE TO DEMAND
    8.5 ENCODERS 
           8.5.1 DEPLOYMENT TO CONVERT ANALOG OR DIGITAL SIGNALS TO DIGITAL FORMAT AND ENHANCE PICTURE QUALITY TO BOOST MARKET
    8.6 VIDEO SERVERS 
           8.6.1 INCREASING INTEREST IN LIVE STREAMING TO PROPEL SEGMENTAL GROWTH
    8.7 TRANSMITTERS/REPEATERS 
           8.7.1 UTILIZATION IN CREATING RADIO WAVES TO BROADCAST DATA THROUGH ANTENNAS TO SUPPORT MARKET GROWTH
    8.8 MODULATORS 
           8.8.1 EMERGING BROADCASTING STANDARDS AND GROWING DEMAND FOR DIVERSE CONTENT DELIVERY TO DRIVE MARKET
    8.9 OTHERS 
 
9 BROADCAST EQUIPMENT MARKET, BY TECHNOLOGY (Page No. - 95)
    9.1 INTRODUCTION 
           FIGURE 34 MARKET, BY TECHNOLOGY
           FIGURE 35 DIGITAL BROADCASTING SEGMENT TO RECORD HIGHER CAGR IN MARKET DURING FORECAST PERIOD
           TABLE 23 MARKET, BY TECHNOLOGY, 2019–2022 (USD MILLION)
           TABLE 24 MARKET, BY TECHNOLOGY, 2023–2028 (USD MILLION)
    9.2 ANALOG BROADCASTING 
           9.2.1 COST-EFFICIENCY AND RELIABLE LONG-DISTANCE COMMUNICATION CAPABILITIES TO FUEL SEGMENTAL GROWTH
    9.3 DIGITAL BROADCASTING 
           9.3.1 HIGH-DEFINITION CONTENT TRANSMISSION CAPABILITIES FOR IMMERSIVE VIEWING EXPERIENCE TO PROPEL MARKET
 
10 BROADCAST EQUIPMENT MARKET, BY APPLICATION (Page No. - 100)
     10.1 INTRODUCTION 
             FIGURE 36 MARKET, BY APPLICATION
             FIGURE 37 TELEVISIONS SEGMENT TO EXHIBIT HIGHER CAGR IN MARKET DURING FORECAST PERIOD
             TABLE 25 MARKET, BY APPLICATION, 2019–2022 (USD MILLION)
             TABLE 26 MARKET, BY APPLICATION, 2023–2028 (USD MILLION)
     10.2 RADIOS 
             10.2.1 AMPLITUDE MODULATION (AM)
                        10.2.1.1 High demand for AM radio in aviation and two-way radio systems to drive market
             10.2.2 FREQUENCY MODULATION (FM)
                        10.2.2.1 Increased demand for clearer audio signals to boost market
                                     TABLE 27 RADIOS: MARKET, BY TYPE, 2019–2022 (USD MILLION)
                                     TABLE 28 RADIOS: MARKET, BY TYPE, 2023–2028 (USD MILLION)
     10.3 TELEVISIONS 
             FIGURE 38 ASIA PACIFIC TO RECORD HIGHEST CAGR FOR TELEVISIONS SEGMENT IN MARKET DURING FORECAST PERIOD
             10.3.1 DIRECT BROADCASTING SATELLITES (DBS)
                        10.3.1.1 Rising demand for global connectivity and direct-to-home entertainment to fuel market growth
             10.3.2 TERRESTRIAL TELEVISIONS
                        10.3.2.1 Analog terrestrial television
                               10.3.2.1.1 Significant presence of terrestrial broadcasting in North America and Europe to foster market growth
                        10.3.2.2 Digital terrestrial television
                               10.3.2.2.1 Interactive features of digital terrestrial television to propel market
             10.3.3 CABLE TELEVISIONS
                        10.3.3.1 High speed and efficiency to propel deployment of cable televisions
             10.3.4 IPTV
                        10.3.4.1 Requirement for personalized and on-demand video content to support market growth
 
11 BROADCAST EQUIPMENT MARKET, BY REGION (Page No. - 107)
     11.1 INTRODUCTION 
             FIGURE 39 REGIONAL SPLIT OF BROADCAST EQUIPMENT MARKET
             FIGURE 40 MARKET IN ASIA PACIFIC TO GROW AT HIGHEST CAGR DURING FORECAST PERIOD
             TABLE 29 MARKET, BY REGION, 2019–2022 (USD MILLION)
             TABLE 30 MARKET, BY REGION, 2023–2028 (USD MILLION)
     11.2 NORTH AMERICA 
             FIGURE 41 NORTH AMERICA: BROADCAST EQUIPMENT MARKET SNAPSHOT
     11.3 IMPACT OF RECESSION ON MARKET IN NORTH AMERICA 
             TABLE 31 NORTH AMERICA: MARKET, BY COUNTRY, 2019–2022 (USD MILLION)
             TABLE 32 NORTH AMERICA: MARKET, BY COUNTRY, 2023–2028 (USD MILLION)
             TABLE 33 NORTH AMERICA: MARKET, BY TECHNOLOGY, 2019–2022 (USD MILLION)
             TABLE 34 NORTH AMERICA: MARKET, BY TECHNOLOGY, 2023–2028 (USD MILLION)
             FIGURE 42 TELEVISIONS SEGMENT TO LEAD BROADCAST EQUIPMENT MARKET IN NORTH AMERICA DURING FORECAST PERIOD
             TABLE 35 NORTH AMERICA: MARKET, BY APPLICATION, 2019–2022 (USD MILLION)
             TABLE 36 NORTH AMERICA: MARKET, BY APPLICATION, 2023–2028 (USD MILLION)
             TABLE 37 NORTH AMERICA: MARKET, BY TYPE, 2019–2022 (USD MILLION)
             TABLE 38 NORTH AMERICA: MARKET, BY TYPE, 2023–2028 (USD MILLION)
             11.3.1 US
                        11.3.1.1 Presence of several broadcast equipment manufacturers to boost market
                                     TABLE 39 US: MARKET, BY TECHNOLOGY, 2019–2022 (USD MILLION)
                                     TABLE 40 US: MARKET, BY TECHNOLOGY, 2023–2028 (USD MILLION)
                                     TABLE 41 US: MARKET, BY APPLICATION, 2019–2022 (USD MILLION)
                                     TABLE 42 US: MARKET, BY APPLICATION, 2023–2028 (USD MILLION)
             11.3.2 CANADA
                        11.3.2.1 Establishment of Canadian Association of Broadcasters (CAB) to drive market
                                     TABLE 43 CANADA: MARKET, BY TECHNOLOGY, 2019–2022 (USD MILLION)
                                     TABLE 44 CANADA: MARKET, BY TECHNOLOGY, 2023–2028 (USD MILLION)
                                     TABLE 45 CANADA: MARKET, BY APPLICATION, 2019–2022 (USD MILLION)
                                     TABLE 46 CANADA: MARKET, BY APPLICATION, 2023–2028 (USD MILLION)
             11.3.3 MEXICO
                        11.3.3.1 Growing demand for live broadcasting of sports events to propel market
                                     TABLE 47 MEXICO: MARKET, BY TECHNOLOGY, 2019–2022 (USD MILLION)
                                     TABLE 48 MEXICO: MARKET, BY TECHNOLOGY, 2023–2028 (USD MILLION)
                                     TABLE 49 MEXICO: MARKET, BY APPLICATION, 2019–2022 (USD MILLION)
                                     TABLE 50 MEXICO: MARKET, BY APPLICATION, 2023–2028 (USD MILLION)
     11.4 EUROPE 
             FIGURE 43 EUROPE: BROADCAST EQUIPMENT MARKE SNAPSHOT
     11.5 IMPACT OF RECESSION ON BROADCAST EQUIPMENT MARKET IN EUROPE 
             TABLE 51 EUROPE: MARKET, BY COUNTRY, 2019–2022 (USD MILLION)
             TABLE 52 EUROPE: MARKET, BY COUNTRY, 2023–2028 (USD MILLION)
             TABLE 53 EUROPE: MARKET, BY TECHNOLOGY, 2019–2022 (USD MILLION)
             TABLE 54 EUROPE: MARKET, BY TECHNOLOGY, 2023–2028 (USD MILLION)
             TABLE 55 EUROPE: MARKET, BY APPLICATION, 2019–2022 (USD MILLION)
             TABLE 56 EUROPE: MARKET, BY APPLICATION, 2023–2028 (USD MILLION)
             TABLE 57 EUROPE: MARKET, BY TYPE, 2019–2022 (USD MILLION)
             TABLE 58 EUROPE: MARKET, BY TYPE, 2023–2028 (USD MILLION)
             11.5.1 UK
                        11.5.1.1 Collaborations between media companies to boost market
                                     TABLE 59 UK: MARKET, BY TECHNOLOGY, 2019–2022 (USD MILLION)
                                     TABLE 60 UK: MARKET, BY TECHNOLOGY, 2023–2028 (USD MILLION)
                                     TABLE 61 UK: MARKET, BY APPLICATION, 2019–2022 (USD MILLION)
                                     TABLE 62 UK: BROADCAST EQUIPMENT MARKET, BY APPLICATION, 2023–2028 (USD MILLION)
             11.5.2 GERMANY
                        11.5.2.1 Hosting major international trade fairs related to broadcasting to contribute to market growth
                                     TABLE 63 GERMANY: MARKET, BY TECHNOLOGY, 2019–2022 (USD MILLION)
                                     TABLE 64 GERMANY: MARKET, BY TECHNOLOGY, 2023–2028 (USD MILLION)
                                     TABLE 65 GERMANY: MARKET, BY APPLICATION, 2019–2022 (USD MILLION)
                                     TABLE 66 GERMANY: MARKET, BY APPLICATION, 2023–2028 (USD MILLION)
             11.5.3 FRANCE
                        11.5.3.1 High emphasis on broadcasting drama and literary programs to favor broadcast equipment market growth
                                     TABLE 67 FRANCE: MARKET, BY TECHNOLOGY, 2019–2022 (USD MILLION)
                                     TABLE 68 FRANCE: MARKET, BY TECHNOLOGY, 2023–2028 (USD MILLION)
                                     TABLE 69 FRANCE: MARKET, BY APPLICATION, 2019–2022 (USD MILLION)
                                     TABLE 70 FRANCE: BROADCAST EQUIPMENT MARKET, BY APPLICATION, 2023–2028 (USD MILLION)
             11.5.4 ITALY
                        11.5.4.1 Robust presence of broadcasting companies to promote broadcast equipment market growth
                                     TABLE 71 ITALY: MARKET, BY TECHNOLOGY, 2019–2022 (USD MILLION)
                                     TABLE 72 ITALY: MARKET, BY TECHNOLOGY, 2023–2028 (USD MILLION)
                                     TABLE 73 ITALY: MARKET, BY APPLICATION, 2019–2022 (USD MILLION)
                                     TABLE 74 ITALY: MARKET, BY APPLICATION, 2023–2028 (USD MILLION)
             11.5.5 REST OF EUROPE
                        TABLE 75 REST OF EUROPE: MARKET, BY TECHNOLOGY, 2019–2022 (USD MILLION)
                        TABLE 76 REST OF EUROPE: MARKET, BY TECHNOLOGY, 2023–2028 (USD MILLION)
                        TABLE 77 REST OF EUROPE: MARKET, BY APPLICATION, 2019–2022 (USD MILLION)
                        TABLE 78 REST OF EUROPE: MARKET, BY APPLICATION, 2023–2028 (USD MILLION)
     11.6 ASIA PACIFIC 
             FIGURE 44 ASIA PACIFIC: BROADCAST EQUIPMENT MARKET SNAPSHOT
     11.7 IMPACT OF RECESSION ON BROADCAST EQUIPMENT MARKET IN ASIA PACIFIC 
             TABLE 79 ASIA PACIFIC: MARKET, BY COUNTRY, 2019–2022 (USD MILLION)
             TABLE 80 ASIA PACIFIC: MARKET BY COUNTRY, 2023–2028 (USD MILLION)
             TABLE 81 ASIA PACIFIC: MARKET, BY TECHNOLOGY, 2019–2022 (USD MILLION)
             TABLE 82 ASIA PACIFIC: MARKET, BY TECHNOLOGY, 2023–2028 (USD MILLION)
             FIGURE 45 TELEVISIONS SEGMENT TO LEAD BROADCAST EQUIPMENT MARKET IN ASIA PACIFIC IN 2028
             TABLE 83 ASIA PACIFIC: MARKET, BY APPLICATION, 2019–2022 (USD MILLION)
             TABLE 84 ASIA PACIFIC: MARKET, BY APPLICATION, 2023–2028 (USD MILLION)
             TABLE 85 ASIA PACIFIC: MARKET, BY TYPE, 2019–2022 (USD MILLION)
             TABLE 86 ASIA PACIFIC: MARKET, BY TYPE, 2023–2028 (USD MILLION)
             11.7.1 JAPAN
                        11.7.1.1 Rising demand for ultra-high-definition content to spur market growth
                                     TABLE 87 JAPAN: MARKET, BY TECHNOLOGY, 2019–2022 (USD MILLION)
                                     TABLE 88 JAPAN: MARKET, BY TECHNOLOGY, 2023–2028 (USD MILLION)
                                     TABLE 89 JAPAN: MARKET, BY APPLICATION, 2019–2022 (USD MILLION)
                                     TABLE 90 JAPAN: MARKET, BY APPLICATION, 2023–2028 (USD MILLION)
             11.7.2 CHINA
                        11.7.2.1 Government initiatives to boost media and entertainment industry to fuel market growth
                                     TABLE 91 CHINA: MARKET, BY TECHNOLOGY, 2019–2022 (USD MILLION)
                                     TABLE 92 CHINA: MARKET, BY TECHNOLOGY, 2023–2028 (USD MILLION)
                                     TABLE 93 CHINA: MARKET, BY APPLICATION, 2019–2022 (USD MILLION)
                                     TABLE 94 CHINA: MARKET, BY APPLICATION, 2023–2028 (USD MILLION)
             11.7.3 INDIA
                        11.7.3.1 Initiatives toward digitization of broadcasting sector to boost market
                                     TABLE 95 INDIA: BROADCAST EQUIPMENT MARKET, BY TECHNOLOGY, 2019–2022 (USD MILLION)
                                     TABLE 96 INDIA: MARKET, BY TECHNOLOGY, 2023–2028 (USD MILLION)
                                     TABLE 97 INDIA: MARKET, BY APPLICATION, 2019–2022 (USD MILLION)
                                     TABLE 98 INDIA: MARKET, BY APPLICATION, 2023–2028 (USD MILLION)
             11.7.4 SOUTH KOREA
                        11.7.4.1 Collaborations by broadcast networks to strengthen broadcasting sector
                                     TABLE 99 SOUTH KOREA: MARKET, BY TECHNOLOGY, 2019–2022 (USD MILLION)
                                     TABLE 100 SOUTH KOREA: MARKET, BY TECHNOLOGY, 2023–2028 (USD MILLION)
                                     TABLE 101 SOUTH KOREA: MARKET, BY APPLICATION, 2019–2022 (USD MILLION)
                                     TABLE 102 SOUTH KOREA: MARKET, BY APPLICATION, 2023–2028 (USD MILLION)
             11.7.5 TAIWAN
                        11.7.5.1 Terrestrial television networks to underpin broadcast equipment market growth
                                     TABLE 103 TAIWAN: MARKET, BY TECHNOLOGY, 2019–2022 (USD MILLION)
                                     TABLE 104 TAIWAN: MARKET, BY TECHNOLOGY, 2023–2028 (USD MILLION)
                                     TABLE 105 TAIWAN: MARKET, BY APPLICATION, 2019–2022 (USD MILLION)
                                     TABLE 106 TAIWAN: MARKET, BY APPLICATION, 2023–2028 (USD MILLION)
             11.7.6 REST OF ASIA PACIFIC
                        TABLE 107 REST OF ASIA PACIFIC: MARKET, BY TECHNOLOGY, 2019–2022 (USD MILLION)
                        TABLE 108 REST OF ASIA PACIFIC: MARKET, BY TECHNOLOGY, 2023–2028 (USD MILLION)
                        TABLE 109 REST OF ASIA PACIFIC: MARKET, BY APPLICATION, 2019–2022 (USD MILLION)
                        TABLE 110 REST OF ASIA PACIFIC: BROADCAST EQUIPMENT MARKET, BY APPLICATION, 2023–2028 (USD MILLION)
     11.8 REST OF THE WORLD (ROW) 
     11.9 IMPACT OF RECESSION ON BROADCAST EQUIPMENT MARKET IN ROW 
             TABLE 111 ROW: MARKET, BY REGION, 2019–2022 (USD MILLION)
             TABLE 112 ROW: MARKET, BY REGION, 2023–2028 (USD MILLION)
             TABLE 113 ROW: MARKET, BY TECHNOLOGY, 2019–2022 (USD MILLION)
             TABLE 114 ROW: MARKET, BY TECHNOLOGY, 2023–2028 (USD MILLION)
             TABLE 115 ROW: MARKET, BY APPLICATION, 2019–2022 (USD MILLION)
             TABLE 116 ROW: MARKET, BY APPLICATION, 2023–2028 (USD MILLION)
             TABLE 117 ROW: MARKET, BY TYPE, 2019–2022 (USD MILLION)
             TABLE 118 ROW: MARKET, BY TYPE, 2023–2028 (USD MILLION)
             11.9.1 MIDDLE EAST & AFRICA
                        11.9.1.1 Growing media and entertainment sector to fuel demand for broadcast equipment
                                     TABLE 119 MIDDLE EAST & AFRICA: MARKET, BY TECHNOLOGY, 2019–2022 (USD MILLION)
                                     TABLE 120 MIDDLE EAST & AFRICA: MARKET, BY TECHNOLOGY, 2023–2028 (USD MILLION)
                                     TABLE 121 MIDDLE EAST & AFRICA: MARKET, BY APPLICATION, 2019–2022 (USD MILLION)
                                     TABLE 122 MIDDLE EAST & AFRICA: BROADCAST EQUIPMENT MARKET, BY APPLICATION, 2023–2028 (USD MILLION)
             11.9.2 SOUTH AMERICA
                        11.9.2.1 Growing broadband service adoption to drive market
                                     TABLE 123 SOUTH AMERICA: MARKET, BY REGION, 2019–2022 (USD MILLION)
                                     TABLE 124 SOUTH AMERICA: MARKET, BY REGION, 2023–2028 (USD MILLION)
                                     TABLE 125 SOUTH AMERICA: MARKET, BY TECHNOLOGY, 2019–2022 (USD MILLION)
                                     TABLE 126 SOUTH AMERICA: MARKET, BY TECHNOLOGY, 2023–2028 (USD MILLION)
                                     TABLE 127 SOUTH AMERICA: MARKET, BY APPLICATION, 2019–2022 (USD MILLION)
                                     TABLE 128 SOUTH AMERICA: MARKET, BY APPLICATION, 2023–2028 (USD MILLION)
             11.9.3 BRAZIL
                        11.9.3.1 Increasing adoption of digital broadcasting to propel market
                                     TABLE 129 BRAZIL: MARKET, BY TECHNOLOGY, 2019–2022 (USD MILLION)
                                     TABLE 130 BRAZIL: MARKET, BY TECHNOLOGY, 2023–2028 (USD MILLION)
                                     TABLE 131 BRAZIL: MARKET, BY APPLICATION, 2019–2022 (USD MILLION)
                                     TABLE 132 BRAZIL: MARKET, BY APPLICATION, 2023–2028 (USD MILLION)
             11.9.4 REST OF SOUTH AMERICA
                        TABLE 133 REST OF SOUTH AMERICA: MARKET, BY TECHNOLOGY, 2019–2022 (USD MILLION)
                        TABLE 134 REST OF SOUTH AMERICA: MARKET, BY TECHNOLOGY, 2023–2028 (USD MILLION)
                        TABLE 135 REST OF SOUTH AMERICA: MARKET, BY APPLICATION, 2019–2022 (USD MILLION)
                        TABLE 136 REST OF SOUTH AMERICA: BROADCAST EQUIPMENT MARKET, BY APPLICATION, 2023–2028 (USD MILLION)
 
12 COMPETITIVE LANDSCAPE (Page No. - 151)
     12.1 OVERVIEW 
     12.2 KEY PLAYER STRATEGIES/RIGHT TO WIN 
             TABLE 137 OVERVIEW OF STRATEGIES DEPLOYED BY KEY BROADCAST EQUIPMENT MANUFACTURERS
             12.2.1 PRODUCT PORTFOLIO
             12.2.2 REGIONAL FOCUS
             12.2.3 MANUFACTURING FOOTPRINT
             12.2.4 ORGANIC/INORGANIC STRATEGIES
     12.3 FIVE-YEAR COMPANY REVENUE ANALYSIS, 2018–2022 
             FIGURE 46 FIVE-YEAR REVENUE ANALYSIS OF TOP PLAYERS IN BROADCAST EQUIPMENT MARKET
     12.4 MARKET SHARE ANALYSIS, 2022 
             TABLE 138 BROADCAST EQUIPMENT MARKET: MARKET SHARE ANALYSIS, 2022
             FIGURE 47 MARKET SHARE OF PLAYERS IN BROADCAST EQUIPMENT MARKET, 2022
     12.5 KEY COMPANY EVALUATION MATRIX, 2022 
             12.5.1 STARS
             12.5.2 EMERGING LEADERS
             12.5.3 PERVASIVE PLAYERS
             12.5.4 PARTICIPANTS
                        FIGURE 48 BROADCAST EQUIPMENT MARKET (GLOBAL): KEY COMPANY EVALUATION MATRIX, 2022
             12.5.5 BROADCAST EQUIPMENT MARKET: COMPANY FOOTPRINT
                        TABLE 139 OVERALL COMPANY FOOTPRINT
                        TABLE 140 COMPANY APPLICATION FOOTPRINT
                        TABLE 141 COMPANY REGIONAL FOOTPRINT
     12.6 SMALL AND MEDIUM-SIZED ENTERPRISES (SMES)/STARTUPS EVALUATION MATRIX, 2022 
             12.6.1 PROGRESSIVE COMPANIES
             12.6.2 RESPONSIVE COMPANIES
             12.6.3 DYNAMIC COMPANIES
             12.6.4 STARTING BLOCKS
                        FIGURE 49 BROADCAST EQUIPMENT MARKET (GLOBAL): SME EVALUATION MATRIX, 2022
             12.6.5 BROADCAST EQUIPMENT MARKET: SMES/STARTUPS
                        TABLE 142 BROADCAST EQUIPMENT MARKET: LIST OF KEY SMES/STARTUPS
                        TABLE 143 MARKET: DETAILED DESCRIPTION OF SMES/STARTUPS
                        TABLE 144 MARKET: COMPETITIVE BENCHMARKING OF KEY SMES/STARTUPS (PRODUCT TYPE FOOTPRINT)
                        TABLE 145 MARKET: COMPETITIVE BENCHMARKING OF KEY SMES/STARTUPS (APPLICATION FOOTPRINT)
                        TABLE 146 MARKET: COMPETITIVE BENCHMARKING OF KEY SMES/STARTUPS (REGION FOOTPRINT)
     12.7 COMPETITIVE SCENARIOS AND TRENDS 
             12.7.1 PRODUCT LAUNCHES
                        TABLE 147 BROADCAST EQUIPMENT MARKET: PRODUCT LAUNCHES, 2020−2023
             12.7.2 DEALS
                        TABLE 148 BROADCAST EQUIPMENT MARKET: DEALS, 2020–2023
 
13 COMPANY PROFILES (Page No. - 180)
(Business overview, Products/Services/Solutions offered, Recent Developments, MNM view)*  
     13.1 KEY PLAYERS 
             13.1.1 CISCO SYSTEMS, INC.
                        TABLE 149 CISCO SYSTEMS, INC.: BUSINESS OVERVIEW
                        FIGURE 50 CISCO SYSTEMS, INC.: COMPANY SNAPSHOT
                        TABLE 150 CISCO SYSTEMS, INC.: PRODUCTS/SERVICES/SOLUTIONS OFFERED
                        TABLE 151 CISCO SYSTEMS, INC.: PRODUCT LAUNCHES
                        TABLE 152 CISCO SYSTEMS, INC.: DEALS
             13.1.2 TELEFONAKTIEBOLAGET LM ERICSSON
                        TABLE 153 TELEFONAKTIEBOLAGET LM ERICSSON: BUSINESS OVERVIEW
                        FIGURE 51 TELEFONAKTIEBOLAGET LM ERICSSON: COMPANY SNAPSHOT
                        TABLE 154 TELEFONAKTIEBOLAGET LM ERICSSON: PRODUCTS/SERVICES/SOLUTIONS OFFERED
                        TABLE 155 TELEFONAKTIEBOLAGET LM ERICSSON: PRODUCT LAUNCHES
                        TABLE 156 TELEFONAKTIEBOLAGET LM ERICSSON: DEALS
             13.1.3 COMMSCOPE
                        TABLE 157 COMMSCOPE: BUSINESS OVERVIEW
                        FIGURE 52 COMMSCOPE: COMPANY SNAPSHOT
                        TABLE 158 COMMSCOPE: PRODUCTS/SERVICES/SOLUTIONS OFFERED
                        TABLE 159 COMMSCOPE: PRODUCT LAUNCHES
                        TABLE 160 COMMSCOPE: DEALS
             13.1.4 EVERTZ
                        TABLE 161 EVERTZ: BUSINESS OVERVIEW
                        FIGURE 53 EVERTZ: COMPANY SNAPSHOT
                        TABLE 162 EVERTZ: PRODUCTS/SERVICES/SOLUTIONS OFFERED
                        TABLE 163 EVERTZ: PRODUCT LAUNCHES
                        TABLE 164 EVERTZ: DEALS
             13.1.5 HARMONIC INC.
                        TABLE 165 HARMONIC INC.: BUSINESS OVERVIEW
                        FIGURE 54 HARMONIC INC.: COMPANY SNAPSHOT
                        TABLE 166 HARMONIC INC.: PRODUCTS/SERVICES/SOLUTIONS OFFERED
                        TABLE 167 HARMONIC INC.: PRODUCT LAUNCHES
                        TABLE 168 HARMONIC INC.: DEALS
             13.1.6 EVS BROADCAST EQUIPMENT
                        TABLE 169 EVS BROADCAST EQUIPMENT: BUSINESS OVERVIEW
                        FIGURE 55 EVS BROADCAST EQUIPMENT: COMPANY SNAPSHOT
                        TABLE 170 EVS BROADCAST EQUIPMENT: PRODUCTS/SERVICES/SOLUTIONS OFFERED
                        TABLE 171 EVS BROADCAST EQUIPMENT: PRODUCT LAUNCHES
                        TABLE 172 EVS BROADCAST EQUIPMENT: DEALS
             13.1.7 GRASS VALLEY CANADA
                        TABLE 173 GRASS VALLEY CANADA: BUSINESS OVERVIEW
                        TABLE 174 GRASS VALLEY CANADA: PRODUCTS/SERVICES/SOLUTIONS OFFERED
                        TABLE 175 GRASS VALLEY CANADA: PRODUCT LAUNCHES
                        TABLE 176 GRASS VALLEY CANADA: DEALS
             13.1.8 WELLAV TECHNOLOGIES LTD.
                        TABLE 177 WELLAV TECHNOLOGIES LTD.: BUSINESS OVERVIEW
                        TABLE 178 WELLAV TECHNOLOGIES LTD.: PRODUCTS/SERVICES/SOLUTIONS OFFERED
                        TABLE 179 WELLAV TECHNOLOGIES LTD.: PRODUCT LAUNCHES
                        TABLE 180 WELLAV TECHNOLOGIES LTD.: DEALS
             13.1.9 ELETEC SARL RADIO BROADCASTING EQUIPMENT
                        TABLE 181 ELETEC SARL RADIO BROADCASTING EQUIPMENT: BUSINESS OVERVIEW
                        TABLE 182 ELETEC SARL RADIO BROADCASTING EQUIPMENT: PRODUCTS/SERVICES/ SOLUTIONS OFFERED
                        TABLE 183 ELETEC SARL RADIO BROADCASTING EQUIPMENT: PRODUCT LAUNCHES
             13.1.10 CLYDE BROADCAST
                        TABLE 184 CLYDE BROADCAST: BUSINESS OVERVIEW
                        TABLE 185 CLYDE BROADCAST: PRODUCTS/SERVICES/SOLUTIONS OFFERED
     13.2 OTHER PLAYERS 
             13.2.1 AVL TECHNOLOGIES, INC.
             13.2.2 NEC CORPORATION
             13.2.3 ETL SYSTEMS LTD
             13.2.4 GLOBAL INVACOM
             13.2.5 BROADCAST ELECTRONICS
             13.2.6 OMB
             13.2.7 BELDEN INC.
             13.2.8 TVC COMMUNICATIONS
             13.2.9 DATUM SYSTEMS
             13.2.10 HANGZHOU HAOXUN TECHNOLOGIES CO., LTD
             13.2.11 ROHDE & SCHWARZ
             13.2.12 ACORDE TECHNOLOGIES S.A.
             13.2.13 FMUSER INTERNATIONAL GROUP LIMITED
             13.2.14 TEKO BROADCAST
             13.2.15 GBSONLINE
*Details on Business overview, Products/Services/Solutions offered, Recent Developments, MNM view might not be captured in case of unlisted companies.  
 
14 ADJACENT MARKET (Page No. - 242)
     14.1 INTRODUCTION 
     14.2 ENCODER MARKET, BY SIGNAL TYPE 
             TABLE 186 ENCODER MARKET, BY SIGNAL TYPE, 2019–2022 (USD MILLION)
             TABLE 187 ENCODER MARKET, BY SIGNAL TYPE, 2023–2028 (USD MILLION)
     14.3 INCREMENTAL 
             14.3.1 SIMPLIFIED HARDWARE AND FLEXIBLE FUNCTIONALITY TO DRIVE MARKET
                        TABLE 188 INCREMENTAL: ENCODER MARKET, BY TYPE, 2019–2022 (USD MILLION)
                        TABLE 189 INCREMENTAL: ENCODER MARKET, BY TYPE, 2023–2028 (USD MILLION)
     14.4 ABSOLUTE 
             14.4.1 RELIABLE MEASUREMENT PERFORMANCE TO STRENGTHEN MARKET
                        TABLE 190 ABSOLUTE: ENCODER MARKET, BY TYPE, 2019–2022 (USD MILLION)
                        TABLE 191 ABSOLUTE: ENCODER MARKET, BY TYPE, 2023–2028 (USD MILLION)
 
15 APPENDIX (Page No. - 246)
     15.1 DISCUSSION GUIDE 
     15.2 KNOWLEDGESTORE: MARKETSANDMARKETS’ SUBSCRIPTION PORTAL 
     15.3 CUSTOMIZATION OPTIONS 
     15.4 RELATED REPORTS 
     15.5 AUTHOR DETAILS 


To estimate the size of the broadcast equipment market, the study utilized four major activities. Exhaustive secondary research was conducted to gather information on the market, as well as its peer and parent markets. The next step was to validate these findings, assumptions, and sizing with industry experts across the value chain through primary research. Both top-down and bottom-up approaches were employed to estimate the total market size. Finally, market breakdown and data triangulation methods were utilized to estimate the market size for different segments and subsegments.

Secondary Research

In the secondary research process, various sources have been referred to for identifying and collecting information for this study on the broadcast equipment market. Secondary sources for this research study include corporate filings (such as annual reports, investor presentations, and financial statements); trade, business, and professional associations; white papers; certified publications; articles by recognized authors; directories; and databases. The secondary data was collected and analyzed to determine the overall market size, further validated through primary research.

List of key secondary sources

Report Metric

Details

The International Trade Association for Broadcast & Media Technology (IABM)

https://theiabm.org/

Observatory of Economic Complexity (OEC)

https://oec.world/en/resources/about

European Telecommunications Standards Institute (ETSI)

https://www.etsi.org/technologies/radio/

Asia-Pacific Institute for Broadcasting Development (AIBD)

https://theiabm.org/

Primary Research

To gather insights on market statistics, revenue data, market breakdowns, size estimations, and forecasting, primary interviews were conducted. Additionally, primary research was used to comprehend the various technology, application, vertical, and regional trends. Interviews with stakeholders from the demand side, including CIOs, CTOs, CSOs, and customer/end-user installation teams using broadcast equipment, were also conducted to understand their perspective on suppliers, products, component providers, and their current and future use of broadcast equipment, which will impact the overall market. Several primary interviews were conducted across major countries of North America, Europe, Asia Pacific, the Middle East & Africa, and Latin America.
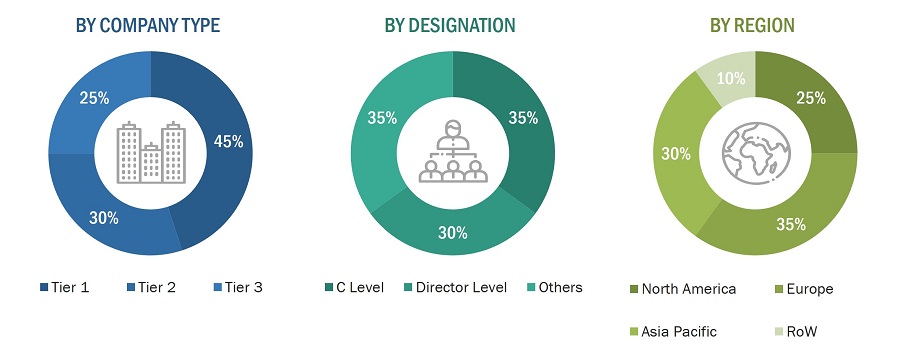
Broadcast Equipment Market Size, and Share

To know about the assumptions considered for the study, download the pdf brochure

Market Size Estimation

To estimate and validate the size of the broadcast equipment market and its submarkets, both top-down and bottom-up approaches were utilized. Secondary research was conducted to identify the key players in the market, and primary and secondary research was used to determine their market share in specific regions. The entire process involved studying the annual and financial reports of top players and conducting extensive interviews with industry leaders such as CEOs, VPs, directors, and marketing executives. Secondary sources were used to determine all percentage shares and breakdowns, which were then verified through primary sources. All parameters that could impact the markets covered in this research study were accounted for, analyzed in detail, verified through primary research, and consolidated to obtain the final quantitative and qualitative data.

Global Broadcast Equipment Market Size: Botton Up Approach

  • First, companies offering broadcast equipment have been identified, and their product mapping with respect to different parameters, such as type, technology, and applications, has been carried out.
  • The market size has been estimated based on the demand for different broadcast equipment types, for different applications. The anticipated change in demand for broadcast equipment offered by these companies in the recession and company revenues have been analyzed and estimated.
  • Primary research has been conducted with a few major players operating in the broadcast equipment market to validate the global market size. Discussions included the impact of recession on the broadcast equipment ecosystem.
  • Then, the size of the broadcast equipment market has been validated through secondary sources, which include the International Trade Centre (ITC), world trade organization, and world economic forum.
  • The CAGR of the broadcast equipment market has been calculated considering the historical and future market trends and the impact of recession by understanding the adoption rate of broadcast equipment for different applications.
  • The estimates at every level have been verified and cross-checked through discussions with key opinion leaders, such as corporate executives (CXOs), directors, and sales heads, as well as with the domain experts in MarketsandMarkets.
  • Various paid and unpaid information sources, such as company websites, annual reports, press releases, research journals, magazines, white papers, and databases, have also been studied

Broadcast Equipment Market Size, and Botton Up Approach

Global Broadcast Equipment Market Size: Top Down Approach

The top-down approach has been used to estimate and validate the total size of the broadcast equipment market.

  • Focusing initially on the R&D investments and expenditures being made in the ecosystem of the broadcast equipment market; further splitting the market on the basis of type, technology, application, and region and listing the key developments.
  • Identifying leading players in the broadcast equipment market through secondary research and verifying them through brief discussions with industry experts
  • Analyzing revenue, product mix, geographic presence, and key applications for which products are served by all identified players to estimate and arrive at percentage splits for all key segments.
  • Discussing splits with industry experts to validate the information and identify key growth pockets across all key segments.
  • Breaking down the total market based on verified splits and key growth pockets across all segments

Broadcast Equipment Market Size, and Top Down Approach

Data Triangulation

Once the overall size of the broadcast equipment market was determined using the methods described above, it was divided into multiple segments and subsegments. Market engineering was performed for each segment and subsegment using market breakdown and data triangulation methods, as applicable, to obtain accurate statistics. To triangulate the data, various factors and trends from the demand and supply sides were studied. The market was validated using both top-down and bottom-up approaches.

Market Definition

Broadcasting entails delivering audio-video content to end users via electronic mass communication platforms. The apparatus utilized for this purpose is referred to as broadcast equipment. These devices play a pivotal role in converting raw data into accessible and user-friendly information. According to the Observatory of Economic Complexity (OEC), an array of electrical equipment is employed to oversee and regulate multiple aspects of broadcasting, encompassing audio and video quality, noise reduction, slow-motion effects, replays, and real-time content dissemination. As broadcast technology evolves, an increasing number of manufacturers are incorporating cutting-edge broadcast equipment to enhance the quality of content they provide.

Key Stakeholders

  • Raw material suppliers
  • Original equipment manufacturers (OEMs)
  • Original device manufacturers (ODM) and technology solution providers
  • Research institutes
  • Market research and consulting firms
  • Broadcast equipment manufactures
  • Broadcast forums, alliances, and associations
  • Governments and financial institutions
  • Analysts and strategic business planners

Report Objectives

  • To define, describe, and forecast the broadcast equipment market based on type, technology, application, and region.
  • To forecast the shipment data of broadcast equipment market based on type.
  • To describe the operational frequencies of broadcast equipment
  • To describe and forecast the market size of various segments across 4 key regions, namely, North America, Europe, Asia Pacific (APAC), and the Rest of the World (RoW), in terms of value
  • To provide detailed information regarding the drivers, restraints, opportunities, and challenges influencing the growth of the broadcast equipment market
  • To provide an overview of the supply chain pertaining to the broadcast equipment ecosystem, along with the average selling prices of broadcast equipment
  • To strategically profile the key players and comprehensively analyze their market shares and core competencies.
  • To analyze the opportunities in the market for stakeholders and describe the competitive landscape of the market.
  • To analyze competitive developments such as joint ventures, collaborations, agreements, contracts, partnerships, mergers & acquisitions, product developments, and research & development (R&D) in the market
  • To analyze the impact of the recession on the broadcast equipment market

Available customizations:

With the given market data, MarketsandMarkets offers customizations according to the specific requirements of companies. The following customization options are available for the report:

  • Detailed analysis and profiling of additional market players (up to 5)
  • Additional country-level analysis of the broadcast equipment market

Product Analysis

  • Product matrix, which provides a detailed comparison of the product portfolio of each company in the broadcast equipment market.
Custom Market Research Services

We will customize the research for you, in case the report listed above does not meet with your exact requirements. Our custom research will comprehensively cover the business information you require to help you arrive at strategic and profitable business decisions.

Request Customization

Instant Answers with GPT - Ask Now!

Ask real questions. Get complete answers !
Report Code
SE 5483
Published ON
Sep, 2023
Choose License Type
BUY NOW
  • SHARE
X
Request Customization
Speak to Analyst
Speak to Analyst
OR FACE-TO-FACE MEETING
PERSONALIZE THIS RESEARCH
  • Triangulate with your Own Data
  • Get Data as per your Format and Definition
  • Gain a Deeper Dive on a Specific Application, Geography, Customer or Competitor
  • Any level of Personalization
REQUEST A FREE CUSTOMIZATION
LET US HELP YOU!
  • What are the Known and Unknown Adjacencies Impacting the Broadcast Equipment Market
  • What will your New Revenue Sources be?
  • Who will be your Top Customer; what will make them switch?
  • Defend your Market Share or Win Competitors
  • Get a Scorecard for Target Partners
CUSTOMIZED WORKSHOP REQUEST
+1-888-600-6441
  • Call Us
  • +1-888-600-6441 (Corporate office hours)
  • +1-888-600-6441 (US/Can toll free)
  • +44-800-368-9399 (UK office hours)
CONNECT WITH US
ABOUT TRUST ONLINE
©2024 MarketsandMarkets Research Private Ltd. All rights reserved
DMCA.com Protection Status Website Feedback