Vinyl Ester Market by Type (Bisphenol A, Novolac, Brominated Fire Retardant, Elastomer Modified), End Use (Pipes & Tanks, Marine, Wind Energy, FGD & Precipitators, Land Transportation), and Region - Global Forecast to 2022


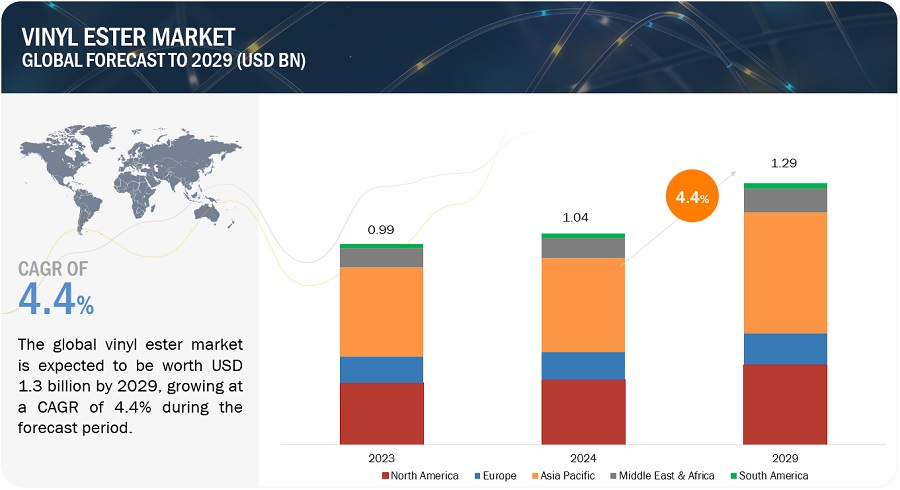
[192 Pages Report] Vinyl Ester Market size is projected to grow from USD 761.1 Million in 2016 to USD 1,080.0 Million by 2022, at a CAGR of 5.9% from 2017 to 2022.
The objectives of this study are:
- To estimate and forecast the vinyl ester market, in terms of value and volume
- To provide a detailed segmentation of the vinyl ester market on the basis of type, end use, and region
- To identify emerging trends and opportunities in the vinyl ester market
- To analyze the market with focus on high growth applications and fastest-growing segments
- To analyze the factors that drive and restrain the growth of the vinyl ester market
- To provide a comprehensive competitive landscape of the market and profile the key market players with respect to their market shares/ranking
- To analyze and forecast segments of the vinyl ester market and present an overall view of the market
The years considered for the study are:
- Base Year � 2016
- Estimated Year � 2017
- Projected Year � 2022
- Forecast Period � 2017 to 2022
For company profiles in the report, 2016 has been considered as the base year. In cases wherein information is unavailable for the base year, the years prior to it have been considered.
Research Methodology
The research methodology used to estimate and forecast the global vinyl ester market began with capturing data on key vendor revenues through secondary sources, such as Hoovers, Bloomberg, Chemical Weekly, Factiva, and various other government and private websites. Vendor offerings have also been taken into consideration to determine the market segmentation. After arriving at the overall market size, the total market was split into several segments and subsegments, which were later verified through primary research by conducting extensive interviews with key personnel, such as CEOs, VPs, directors, and executives. Data triangulation and market breakdown procedures were employed to complete the overall market engineering process and arrive at the exact statistics for all segments and subsegments of the market. The breakdown of profiles of primaries is depicted in the figure below.
To know about the assumptions considered for the study, download the pdf brochure
The vinyl ester market has a diversified ecosystem of upstream players, including raw material suppliers, along with downstream stakeholders, vendors, end users, and government organizations. Companies operating in the vinyl ester market include Ashland Global Holdings Inc. (US), Interplastic Corporation (US), Reinchhold LLC 2 (US), Sino Polymer Co., Ltd. (China), Swancor Holding Company Limited (Taiwan), AOC, LLC (US), Showa Denko K.K. (Germany), and Polynt (Germany), among others.
Target Audience
- Manufacturers, Dealers, and Suppliers of Vinyl Esters
- Government and Research Organizations
- End Users
- Companies Operational in Material R&D
- Associations and Industrial Bodies
- Investment Banks
- Consulting Companies/Consultants in Chemical and Material Sectors
�This study answers several questions for stakeholders, primarily the market segments which they need to focus upon during the next two to five years so that they may prioritize their efforts and investments accordingly.�
Scope of the report:
This research report categorizes the vinyl ester market based on type, end use, and region, and forecasts revenues as well as analyzes trends in each of the submarkets.
On the Basis of Type
- Bisphenol A
- Novolac
- Brominated Fire Retardant
- Elastomer Modified
- Others
On the basis of End Use:
- Pipes & Tanks
- Marine
- Wind Energy
- Water Pipes
- FGD & Precipitators
- Building & Construction
- Land Transportation
- Aerospace & Defense
- Others
On the basis of Region:
- Asia Pacific
- North America
- Europe
- Middle East & Africa
- South America
The following customization options are available for the report:
Along with the given market data, MarketsandMarkets offers customizations as per the company�s specific needs. The following customization options are available for the report:
Product Analysis
- Product matrix, which gives a detailed comparison of the product portfolio of each company
Geographic Analysis
- Further breakdown of the rest of Asia Pacific, rest of the Middle East & Africa, rest of Europe, and rest of South America vinyl ester markets
Company Information
Detailed analysis and profiles of additional market players (up to five companies)
The global vinyl ester market is projected to grow from USD 810.6 Million in 2017 to USD 1,080.0 Million by 2022, at a CAGR of 5.9% from 2017 to 2022. The extensive use of vinyl ester in pipes & tanks in various industries like chemicals and water & wastewater is the primary driver for the vinyl ester market. Growing environmental awareness has also increased the use of vinyl ester in FGD applications. The increasing use of vinyl ester in mass transit and railways is another driver for the market.
The bisphenol A segment is estimated to be the largest type segment of the vinyl ester market from 2017 to 2022. Bisphenol A vinyl ester resins are used in a host of chemical applications and FGD processes owing to their corrosion resistance property. The marine industry mostly uses vinyl ester resins as barrier coats, gel coats, and in the main composite body of ships.
The pipes & tanks segment is estimated to be the largest end-use segment of the vinyl ester market in 2017. Vinyl ester is used in high-temperature formulations, such as chemical storage vessels and chemical reactors. It is also used in electro-refining tanks and as topcoats for metal containers.
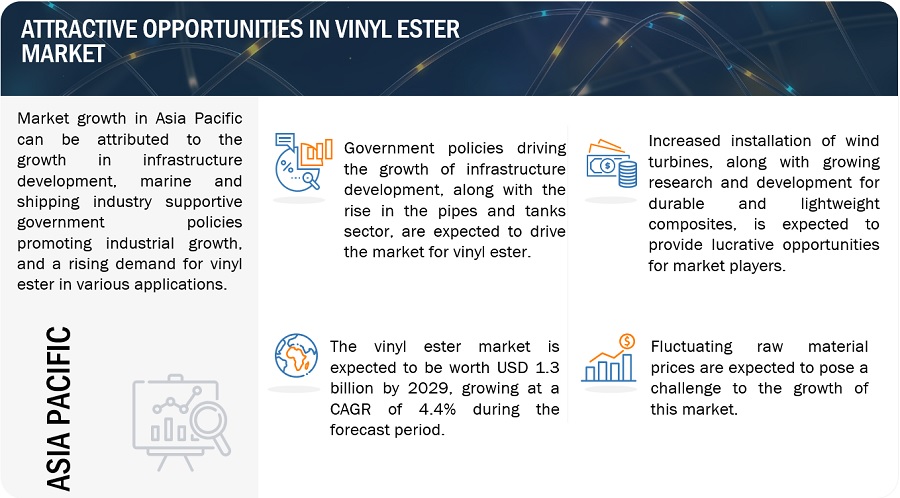
Asia Pacific is expected to be the fastest-growing market for vinyl ester during the forecast period, owing to the high demand from the various industries in China, such as water & wastewater treatment, chemical, pharmaceutical, food processing, and transportation. Environmental regulations on harmful emissions have also increased the demand for FGD systems, which use vinyl ester linings for protection from corrosion.
The low shelf life of vinyl ester resins acts as a restraining factor for the vinyl ester market. Government regulations regarding the VOC content of vinyl ester is another restraining factor for the market.
Key players operating in the vinyl ester market include Ashland Global Holdings Inc. (US), Interplastic Corporation (US), Reinchhold LLC 2 (US), Sino Polymer Co., Ltd. (China), Swancor Holding Company Limited (Taiwan), AOC, LLC (US), Showa Denko K.K. (Germany), and Polynt (Germany), among others. These companies focus on investing in the capacity expansion of plants to achieve growth in the vinyl ester market.
To speak to our analyst for a discussion on the above findings, click Speak to Analyst
Table of Contents
1 Introduction (Page No. - 16)
1.1 Objectives of the Study
1.2 Market Definition
1.3 Scope of the Study
1.3.1 Years Considered for the Study
1.4 Currency
1.5 Package Size
1.6 Stakeholders
2 Research Methodology (Page No. - 19)
2.1 Research Data
2.1.1 Secondary Data
2.1.1.1 Key Data From Secondary Sources
2.1.2 Primary Data
2.1.2.1 Key Data From Primary Sources
2.1.2.2 Key Industry Insights
2.1.2.3 Breakdown of Primary Interviews
2.2 Market Size Estimation
2.2.1 Bottom-Up Approach
2.2.2 Top-Down Approach
2.3 Data Triangulation
2.4 Assumptions
2.5 Limitations
3 Executive Summary (Page No. - 27)
4 Premium Insights (Page No. - 30)
4.1 Attractive Opportunities in the Vinyl Ester Market
4.2 Vinyl Ester Market, By Region
4.3 North America Vinyl Ester Market, By Country and Type
4.4 Vinyl Ester Market, By End Use
4.5 Vinyl Ester Market, By Country
5 Market Overview (Page No. - 33)
5.1 Introduction
5.2 Evolution
5.3 Market Dynamics
5.3.1 Drivers
5.3.1.1 Extensive Use of Vinyl Ester Resins in the Pipes & Tanks End-Use Industry
5.3.1.2 Growth in the US Marine Industry
5.3.2 Restraints
5.3.2.1 Low Shelf Life of Vinyl Ester
5.3.3 Opportunities
5.3.3.1 Growing Environmental Awareness and Stringent Regulations are Expected to Increase the Demand for FGD Systems
5.3.3.2 Increasing Use of Vinyl Ester in Railways and Mass Transit Buses
5.3.3.3 Increasing Installation of Wind Turbines
5.3.4 Challenges
5.3.4.1 Government Regulations to Reduce the VOC Content of Vinyl Ester Resins
5.3.4.2 Rising Prices of Key Raw Materials of Vinyl Ester Resins
5.4 Porter�s Five Forces Analysis
5.4.1 Bargaining Power of Suppliers
5.4.2 Threat of New Entrants
5.4.3 Threat of Substitutes
5.4.4 Bargaining Power of Buyers
5.4.5 Intensity of Rivalry
5.5 Market Trend - Consolidation Amid Declining Margins and Cost Pressure
5.5.1 Polynt and Reichhold Merged to Compete Better
5.5.2 Other Key Consolidations Since 2010
6 Vinyl Ester Market, By Type (Page No. - 42)
6.1 Introduction
6.2 Bisphenol A
6.3 Novolac
6.4 Brominated Fire Retardant
6.5 Elastomer Modified
6.6 Others
7 Vinyl Ester Market, By End Use (Page No. - 50)
7.1 Introduction
7.2 Pipes & Tanks
7.3 Marine
7.4 Wind Energy
7.5 FGD & Precipitators
7.6 Building & Construction
7.7 Land Transportation
7.8 Aerospace & Defense
7.9 Others
8 Vinyl Ester Market, By Region (Page No. - 61)
8.1 Introduction
8.2 North America
8.2.1 US
8.2.2 Canada
8.2.3 Mexico
8.3 Asia Pacific
8.3.1 China
8.3.2 Japan
8.3.3 India
8.3.4 Australia & New Zealand
8.3.5 South Korea
8.3.6 Indonesia
8.3.7 Malaysia
8.3.8 Rest of Asia Pacific
8.4 Europe
8.4.1 Germany
8.4.2 UK
8.4.3 France
8.4.4 Italy
8.4.5 Turkey
8.4.6 The Netherlands
8.4.7 Rest of Europe
8.5 Middle East & Africa
8.5.1 Saudi Arabia
8.5.2 UAE
8.5.3 South Africa
8.5.4 Rest of Middle East & Africa
8.6 South America
8.6.1 Brazil
8.6.2 Argentina
8.6.3 Chile
8.6.4 Peru
8.6.5 Rest of South America
9 Competitive Landscape (Page No. - 137)
9.1 Market Share Analysis
10 Company Profiles (Page No. - 138)
(Overview, Strength of Product Portfolio, Business Strategy Excellence, Recent Developments, MnM View)*
10.1 Ashland
10.2 Interplastic Corporation
10.3 Reichhold
10.4 Sino Polymer Co.,
10.5 Swancor Holding
10.6 AOC
10.7 Showa Denko
10.8 Polynt
10.9 Aliancys
10.10 Scott Bader Company
10.11 Allnex
10.12 Hexion
10.13 Poliya Composite Resins and Polymers
10.14 DIC Material
10.15 Nivitex Fibreglass and Resins
*Details on Overview, Strength of Product Portfolio, Business Strategy Excellence, Recent Developments, MnM View Might Not Be Captured in Case of Unlisted Companies.
10.16 Other Companies
10.16.1 Changzhou Tianma Group
10.16.2 Mechemco
10.16.3 Ece Boya Kimya
10.16.4 Andara
10.16.5 Orca Composites
10.16.6 Polymer Products (Phil.)
10.16.7 Refnol Oil Refineries
10.16.8 Satyen Polymers
10.16.9 ITW Spraycore
10.16.10 WEE Tee Tong Chemicals
10.16.11 Pliogrip Resins & Chemicals
10.16.12 Crest Composites and Plastics
10.16.13 Revex Plasticizers
10.16.14 Resoltech
10.16.15 Protective Industrial Polymers
10.16.16 Helios Group
10.16.17 Advance Coatings
10.16.18 Arjay Technologies
10.16.19 Boytek
10.17 List of Distributors/Suppliers
11 Appendix (Page No. - 184)
11.1 Discussion Guide
11.2 Knowledge Store: Marketsandmarkets� Subscription Portal
11.3 Introducing RT: Real-Time Market Intelligence
11.4 Available Customizations
11.5 Related Reports
11.6 Author Details
List of Tables (174 Tables)
Table 1 Vinyl Ester Market, By Type, 2015�2022 (USD Million)
Table 2 Market Size, By Type, 2015�2022 (Tons)
Table 3 Bisphenol A Segment, By Region, 2015�2022 (USD Million)
Table 4 Bisphenol A Segment, By Region, 2015�2022 (Tons)
Table 5 Novolac Segment, By Region, 2015�2022 (USD Million)
Table 6 Novolac Segment, By Region, 2015�2022 (Tons)
Table 7 Brominated Fire Retardant Segment, By Region, 2015�2022 (USD Million)
Table 8 Brominated Fire Retardant Segment, By Region, 2015�2022 (Tons)
Table 9 Elastomer Modified Segment, By Region, 2015�2022 (USD Million)
Table 10 Elastomer Modified Segment, By Region, 2015�2022 (Tons)
Table 11 Other Types Segment, By Region, 2015�2022 (USD Million)
Table 12 Other Types Segment, By Region, 2015�2022 (Tons)
Table 13 Vinyl Ester Market, By End Use, 2015�2022 (USD Million)
Table 14 Market Size, By End Use, 2015�2022 (Tons)
Table 15 Pipes & Tanks Segment, By Region, 2015�2022 (USD Million)
Table 16 Pipes & Tanks Segment, By Region, 2015�2022 (Tons)
Table 17 Marine Segment, By Region, 2015�2022 (USD Million)
Table 18 Marine Segment, By Region, 2015�2022 (Tons)
Table 19 Wind Energy Segment, By Region, 2015�2022 (USD Million)
Table 20 Wind Energy Segment, By Region, 2015�2022 (Tons)
Table 21 FGD & Precipitators Segment, By Region, 2015�2022 (USD Million)
Table 22 FGD & Precipitators Segment, By Region, 2015�2022 (Tons)
Table 23 Building & Construction Segment, By Region, 2015�2022 (USD Million)
Table 24 Building & Construction Segment, By Region, 2015�2022 (Tons)
Table 25 Land Transportation Segment, By Region, 2015�2022 (USD Million)
Table 26 Land Transportation Segment, By Region, 2015�2022 (Tons)
Table 27 Aerospace & Defense Segment, By Region, 2015�2022 (USD Million)
Table 28 Aerospace & Defense Segment, By Region, 2015�2022 (Tons)
Table 29 Others Segment, By Region, 2015�2022 (USD Million)
Table 30 Others Segment, By Region, 2015�2022 (Tons)
Table 31 Vinyl Ester Market, By Region, 2015�2022 (USD Million)
Table 32 Vinyl Ester Market, By Region, 2015�2022 (Tons)
Table 33 Vinyl Ester Market, By Type, 2015�2022 (USD Million)
Table 34 Vinyl Ester Market, By Type, 2015�2022 (Tons)
Table 35 Vinyl Ester Market, By End Use, 2015�2022 (USD Million)
Table 36 Vinyl Ester Market, By End Use, 2015�2022 (Tons)
Table 37 North America: Vinyl Ester Market, By Country, 2015�2022 (USD Million)
Table 38 North America: Vinyl Ester Market, By Country, 2015�2022 (Tons)
Table 39 North America: Vinyl Ester Market, By Type, 2015-2022 (USD Million)
Table 40 North America: Vinyl Ester Market, By Type, 2015-2022 (Tons)
Table 41 North America: Vinyl Ester Market, By End Use, 2015�2022 (USD Million)
Table 42 North America: Vinyl Ester Market, By End Use, 2015�2022 (Tons)
Table 43 US: Vinyl Ester Market, By Type, 2015-2022 (USD Million)
Table 44 US: Vinyl Ester Market, By Type, 2015-2022 (Tons)
Table 45 US: Vinyl Ester Market, By End Use, 2015�2022 (USD Million)
Table 46 US: Market, By End Use, 2015�2022 (Tons)
Table 47 Canada: Vinyl Ester Market, By Type, 2015-2022 (USD Million)
Table 48 Canada: Vinyl Ester Market, By Type, 2015-2022 (Tons)
Table 49 Canada: Vinyl Ester Market, By End Use, 2015�2022 (USD Million)
Table 50 Canada: Vinyl Ester Market, By End Use, 2015�2022 (Tons)
Table 51 Mexico: Vinyl Ester Market, By Type, 2015-2022 (USD Million)
Table 52 Mexico: Vinyl Ester Market, By Type, 2015-2022 (Tons)
Table 53 Mexico: Vinyl Ester Market, By End Use, 2015�2022 (USD Million)
Table 54 Mexico: Vinyl Ester Market, By End Use, 2015�2022 (Tons)
Table 55 Asia Pacific: Vinyl Ester Market, By Country, 2015�2022 (USD Million)
Table 56 Asia Pacific: Vinyl Ester Market, By Country, 2015�2022 (Tons)
Table 57 Asia Pacific: Vinyl Ester Market, By Type, 2015�2022 (USD Million)
Table 58 Asia Pacific: Vinyl Ester Market, By Type, 2015�2022 (Tons)
Table 59 Asia Pacific: Vinyl Ester Market, By End Use, 2015�2022 (USD Million)
Table 60 Asia Pacific: Vinyl Ester Market, By End Use, 2015�2022 (Tons)
Table 61 China: Vinyl Ester Market, By Type, 2015�2022 (USD Million)
Table 62 China: Market, By Type, 2015�2022 (Tons)
Table 63 China: Market, By End Use, 2015�2022 (USD Million)
Table 64 China: Market, By End Use, 2015�2022 (Tons)
Table 65 Japan: Vinyl Ester Market, By Type, 2015�2022 (USD Million)
Table 66 Japan: Market, By Type, 2015�2022 (Tons)
Table 67 Japan: Market, By End Use, 2015�2022 (USD Million)
Table 68 Japan: Market, By End Use, 2015�2022 (Tons)
Table 69 India: Vinyl Ester Market, By Type, 2015�2022 (USD Million)
Table 70 India: Market, By Type, 2015�2022 (Tons)
Table 71 India: Market, By End Use, 2015�2022 (USD Million)
Table 72 India: Market, By End Use, 2015�2022 (Tons)
Table 73 Australia & New Zealand: Vinyl Ester Market, By Type, 2015�2022 (USD Million)
Table 74 Australia & New Zealand: Market, By Type, 2015�2022 (Tons)
Table 75 Australia & New Zealand: Market, By End Use, 2015�2022 (USD Million)
Table 76 Australia & New Zealand: Market, By End Use, 2015�2022 (Tons)
Table 77 South Korea: Vinyl Ester Market, By Type, 2015�2022 (USD Million)
Table 78 South Korea: Market, By Type, 2015�2022 (Tons)
Table 79 South Korea: Market, By End Use, 2015�2022 (USD Million)
Table 80 South Korea: Market, By End Use, 2015�2022 (Tons)
Table 81 Indonesia: Vinyl Ester Market, By Type, 2015�2022 (USD Million)
Table 82 Indonesia: Market, By Type, 2015�2022 (Tons)
Table 83 Indonesia: Market, By End Use, 2015�2022 (USD Million)
Table 84 Indonesia: Market, By End Use, 2015�2022 (Tons)
Table 85 Malaysia: Vinyl Ester Market, By Type, 2015�2022 (USD Million)
Table 86 Malaysia: Market, By Type, 2015�2022 (Tons)
Table 87 Malaysia: Market, By End Use, 2015�2022 (USD Million)
Table 88 Malaysia: Market, By End Use, 2015�2022 (Tons)
Table 89 Rest of Asia Pacific: Vinyl Ester Market, By Type, 2015�2022 (USD Million)
Table 90 Rest of Asia Pacific: Market, By Type, 2015�2022 (Tons)
Table 91 Rest of Asia Pacific: Market, By End Use, 2015�2022 (USD Million)
Table 92 Rest of Asia Pacific: Market, By End Use, 2015�2022 (Tons)
Table 93 Europe: Vinyl Ester Market, By Country, 2015-2022 (USD Million)
Table 94 Europe: Market, By Country, 2015-2022 (Tons)
Table 95 Europe: Market, By Type, 2015-2022 (USD Million)
Table 96 Europe: Market, By Type, 2015-2022 (Tons)
Table 97 Europe: Market, By End Use, 2015�2022 (USD Million)
Table 98 Europe: Market, By End Use, 2015�2022 (Tons)
Table 99 Germany: Vinyl Ester Market, By Type, 2015�2022 (USD Million)
Table 100 Germany: Market, By Type, 2015�2022 (Tons)
Table 101 Germany: Market, By End Use, 2015�2022 (USD Million)
Table 102 Germany: Market, By End Use, 2015�2022 (Tons)
Table 103 UK: Vinyl Ester Market, By Type, 2015�2022 (USD Million)
Table 104 UK: Market, By Type, 2015�2022 (Tons)
Table 105 UK: Market, By End Use, 2015�2022 (USD Million)
Table 106 UK: Market, By End Use, 2015�2022 (Tons)
Table 107 France: Vinyl Ester Market, By Type, 2015�2022 (USD Million)
Table 108 France: Market, By Type, 2015�2022 (Tons)
Table 109 France: Market, By End Use, 2015�2022 (USD Million)
Table 110 France: Market, By End Use, 2015�2022 (Tons)
Table 111 Italy: Vinyl Ester Market, By Type, 2015�2022 (USD Million)
Table 112 Italy: Market, By Type, 2015�2022 (Tons)
Table 113 Italy: Market, By End Use, 2015�2022 (USD Million)
Table 114 Italy: Market, By End Use, 2015�2022 (Tons)
Table 115 Turkey: Vinyl Ester Market, By Type, 2015�2022 (USD Million)
Table 116 Turkey: Market, By Type, 2015�2022 (Tons)
Table 117 Turkey: Market, By End Use, 2015�2022 (USD Million)
Table 118 Turkey: Market, By End Use, 2015�2022 (Tons)
Table 119 Netherlands: Vinyl Ester Market, By Type, 2015�2022 (USD Million)
Table 120 Netherlands: Market, By Type, 2015�2022 (Tons)
Table 121 Netherlands : Market, By End Use, 2015�2022 (USD Million)
Table 122 The Netherlands: Market, By End Use, 2015�2022 (Tons)
Table 123 Rest of Europe: Vinyl Ester Market, By Type, 2015�2022 (USD Million)
Table 124 Rest of Europe: Market, By Type, 2015�2022 (Tons)
Table 125 Rest of Europe: Market, By End Use, 2015�2022 (USD Million)
Table 126 Rest of Europe: Market, By End Use, 2015�2022 (Tons)
Table 127 Middle East & Africa: Vinyl Ester Market, By Country, 2015-2022 (USD Million)
Table 128 Middle East & Africa: Market, By Country, 2015-2022 (Tons)
Table 129 Middle East & Africa: Market, By Type, 2015�2022 (USD Million)
Table 130 Middle East & Africa: Market, By Type, 2015�2022 (Tons)
Table 131 Middle East & Africa: Market, By End Use, 2015�2022 (USD Million)
Table 132 Middle East & Africa: Market, By End Use, 2015�2022 (Tons)
Table 133 Saudi Arabia: Vinyl Ester Market, By Type, 2015�2022 (USD Million)
Table 134 Saudi Arabia: Market, By Type, 2015�2022 (Tons)
Table 135 Saudi Arabia: Market, By End Use, 2015�2022 (USD Million)
Table 136 Saudi Arabia: Market, By End Use, 2015�2022 (Tons)
Table 137 UAE: Vinyl Ester Market, By Type, 2015�2022 (USD Million)
Table 138 UAE: Market, By Type, 2015�2022 (Tons)
Table 139 UAE: Market, By End Use, 2015�2022 (USD Million)
Table 140 UAE: Market, By End Use, 2015�2022 (Tons)
Table 141 South Africa: Vinyl Ester Market, By Type, 2015�2022 (USD Million)
Table 142 South Africa: Market, By Type, 2015�2022 (Tons)
Table 143 South Africa: Market, By End Use, 2015�2022 (USD Million)
Table 144 South Africa: Market, By End Use, 2015�2022 (Tons)
Table 145 Rest of Middle East & Africa: Vinyl Ester Market, By Type, 2015�2022 (USD Million)
Table 146 Rest of Middle East & Africa: Market, By Type, 2015�2022 (Tons)
Table 147 Rest of Middle East: Market, By End Use, 2015�2022 (USD Million)
Table 148 Rest of Middle East: Market, By End Use, 2015�2022 (Tons)
Table 149 South America: Vinyl Ester Market, By Country, 2015�2022 (USD Million)
Table 150 South America: Market, By Country, 2015�2022 (Tons)
Table 151 South America: Market, By Type, 2015�2022 (USD Million)
Table 152 South America: Market, By Type, 2015�2022 (Tons)
Table 153 South America: Market, By End Use, 2015�2022 (USD Million)
Table 154 South America: Market, By End Use, 2015�2022 (Tons)
Table 155 Brazil: Vinyl Ester Market, By Type, 2015�2022 (USD Million)
Table 156 Brazil: Market, By Type, 2015�2022 (Tons)
Table 157 Brazil: Market, By End Use, 2015�2022 (USD Million)
Table 158 Brazil: Market, By End Use, 2015�2022 (Tons)
Table 159 Argentina: Vinyl Ester Market, By Type, 2015�2022 (USD Million)
Table 160 Argentina: Market, By Type, 2015�2022 (Tons)
Table 161 Argentina: Market, By End Use, 2015�2022 (USD Million)
Table 162 Argentina: Market, By End Use, 2015�2022 (Tons)
Table 163 Chile: Vinyl Ester Market, By Type, 2015�2022 (USD Million)
Table 164 Chile: Market, By Type, 2015�2022 (Tons)
Table 165 Chile: Market, By End Use, 2015�2022 (USD Million)
Table 166 Chile: Market, By End Use, 2015�2022 (Tons)
Table 167 Peru: Vinyl Ester Market, By Type, 2015�2022 (USD Million)
Table 168 Peru: Market, By Type, 2015�2022 (Tons)
Table 169 Peru: Market, By End Use, 2015�2022 (USD Million)
Table 170 Peru: Market, By End Use, 2015�2022 (Tons)
Table 171 Rest of South America: Vinyl Ester Market, By Type, 2015�2022 (USD Million)
Table 172 Rest of South America: Market, By Type, 2015�2022 (Tons)
Table 173 Rest of South America: Market, By End Use, 2015�2022 (USD Million)
Table 174 Rest of South America: Market, By End Use, 2015�2022 (Tons)
List of Figures (28 Figures)
Figure 1 Vinyl Ester Market Segmentation
Figure 2 Vinyl Ester Market: Research Design
Figure 3 Bottom-Up Approach
Figure 4 Market Size Estimation: Top-Down Approach
Figure 5 Vinyl Ester Market: Data Triangulation
Figure 6 Bisphenol A Segment Estimated to Be the Largest Type Segment Between 2017 and 2022
Figure 7 Pipes & Tanks Segment Estimated to Be the Largest End Use Segment Between 2017 and 2022
Figure 8 North America Estimated to Dominate the Vinyl Ester Market in 2017
Figure 9 Growth of Pipes & Tanks and Marine Industries to Drive the Vinyl Ester Market Between 2017 and 2022
Figure 10 Asia Pacific Market is Projected to Grow at the Fastest Rate During the Forecast Period
Figure 11 Bisphenol A Type Segment to Account for the Largest Share of the North America Vinyl Ester Market in 2017
Figure 12 Pipes & Tanks is the Leading End Use Segment in All Regions
Figure 13 US to Lead the Vinyl Ester Market Between 2017 and 2022
Figure 14 Drivers, Restraints, Opportunities & Challenges: Fiberglass Market
Figure 15 Porter�s Five Forces Analysis
Figure 16 Bisphenol A Type Segment Projected to Lead the Vinyl Ester Market During the Forecast Period
Figure 17 Pipes & Tanks End Use Segment Anticipated to Lead the Vinyl Ester Market During the Forecast Period
Figure 18 Vinyl Ester Market: Country-Wise Growth
Figure 19 North America Vinyl Ester Market Snapshot
Figure 20 Asia Pacific Vinyl Ester Market Snapshot
Figure 21 Europe Vinyl Ester Market Snapshot
Figure 22 Middle East & Africa Vinyl Ester Market Snapshot
Figure 23 South America Vinyl Ester Market Snapshot
Figure 24 Vinyl Esters Market Share, By Key Companies, 2017
Figure 25 Ashland: Company Snapshot
Figure 26 Swancor Holding Company: Company Snapshot
Figure 27 Showa Denko: Company Snapshot
Figure 28 Hexion: Company Snapshot


Growth opportunities and latent adjacency in Vinyl Ester Market