
Sodium Reduction Ingredients Market by Types (Amino Acids, Mineral Salts, and Yeast Extracts), Applications (Dairy, Bakery & Confectionary, Meat Products, and Sauces, Seasonings & Snacks), & by Region - Global Trends & Forecast to 2020
Market Segmentation
| Report Metrics | Details |
|
Market size available for years |
2015 - 2020 |
|
CAGR % |
11.2 |
Top 10 companies in Sodium Reduction Ingredients Market


The U.S. Food and Drug Administration has been regulating the salt content used in product manufacturing along with making consumers aware of the nutritional content in various foods. Low-sodium solutions offered by sodium reduction ingredient manufacturers evolve according to end-use applications.
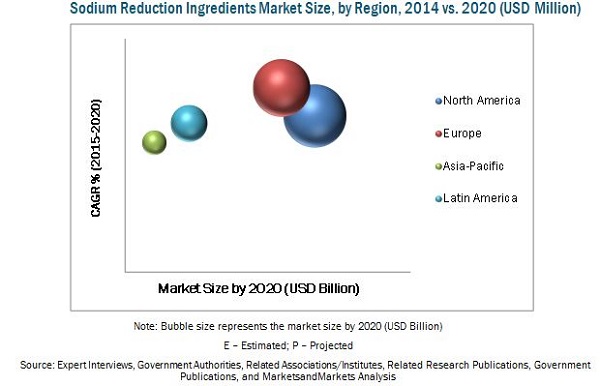
This report estimates the size of the global market in terms of value. The market for sodium reduction ingredients is projected to grow at a CAGR of 11.2% to reach USD 1.24 Billion by 2020. The market was dominated by the North American region in 2014 where the U.S., Canada, and Mexico were the leading countries in 2014. Drivers, restraints, opportunities, and challenges of the market are also discussed in detail in the report. In the next five years, mineral salts are projected to gain better prospects as the fastest-growing segment in various regions. The application of sodium reduction ingredients is projected to witness strong demand from bakery & confectionery and meat products industries.
This report provides a complete analysis of key global players in the sodium reduction ingredients market, with a clear insight on developments, trends, and their product portfolio. This report includes the profile of the leading players of this industry such as Cargill, Incorporated (U.S.), Kerry Group Plc (U.K.), Royal DSM N.V. (Netherlands), Angel Yeast Co. Ltd. (Japan), E.I. du Pont de Nemours & Co. (U.S.), and Innophos Holdings Incorporated (U.S.). Due to the tremendous opportunities in the market, the business segments and product portfolios of these companies have been undergoing a significant shift to be organized into a structurally and strategically strong market force.
The current competitive scenario of this market provides valuable inputs that can validate the strategic decisions to be employed in the future by sodium reduction ingredient manufacturers. Companies engaged in the development and marketing of sodium reduction ingredients portfolio comprising mineral salts, amino acids, and yeast extracts can avail a concrete view about the market structure in key countries. The report projects the analytical and qualitative requirements for important stakeholders, such as packaged food manufacturers & traders, flavor formulators, specialty food manufacturers, and processed meat industries involved in the sodium reduction ingredients market.
Get online access to the report on the World's First Market Intelligence Cloud
Request Sample Scope of the Report

This research study categorizes sodium reduction ingredients on the basis of type, application, and region.
On the basis of region, the market has been segmented as follows:
- North America
- Europe
- Asia-Pacific
- Rest of the World (RoW)
On the basis of type, the market has been segmented as follows:
- Mineral salts
- Amino acids
- Yeast extracts
- Others (hydrolyzed vegetable protein, trehalose, and nucleotides)
On the basis of application, the market has been segmented as follows:
- Bakery & confectionery
- Dairy & frozen foods
- Meat products
- Sauces, seasonings & snacks
- Others (breakfast cereals, baby foods, and beverages)
Available Customizations
With the given market data, MarketsandMarkets offers customizations according to the company�s specific scientific needs.
The following customization options are available for the report:
Product Analysis
- Product matrix which gives a detailed comparison of product portfolio of each company
Regional Analysis
- Further breakdown of the Rest of Europe sodium reduction ingredients market into Ireland, Ukraine, Norway, Austria, and Poland
- Further breakdown of the Rest of Asia-Pacific market into Vietnam, Philippines, Malaysia, and Pakistan
- Breakdown of the Rest of the Latin American market into Chile, Venezuela, and Peru
- Further breakdown of the other countries in RoW market into Iran, Egypt, Morocco, and Saudi Arabia
Company Information
- � Detailed analysis and profiling of additional market players (Up to 5)
The sodium reduction ingredients market is projected to reach USD 1.24 Billion by 2020, at a CAGR of 11.2% from 2015 to 2020.
The market for sodium reduction ingredient products has a significant impact on the nutritional food and health care sectors. Sodium reduction ingredients are broadly categorized based on their type into amino acids, mineral salts, yeast extracts, and others including hydrolyzed vegetable protein, trehalose, and nucleotides. The sodium reduction ingredients market is also segmented on the basis of application into dairy & frozen foods, bakery & confectionery, meat products, and sauces, seasonings & snacks, and others that include breakfast cereals, baby foods, and beverages.
Sodium reduction ingredients are used in the food & beverage industry to reduce the sodium content in the daily diet. The hazards related to a high-sodium diet such as high blood pressure and hypertension have been documented widely in the past decade. They are common risk factors associated with cardiovascular diseases (CVDs).
The existing companies in this market are actively introducing new products with different ingredients and flavors. The demand for sodium reduction ingredients is expected to increase in the near future due to health-related concerns and the rising global population.
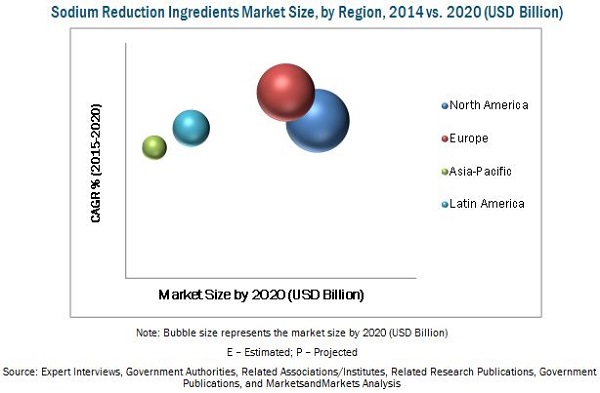
The market in North America is projected to reach nearly USD 536.50 Million by 2020 and is expected to remain as a strong market along with Europe. The North American region accounted for the largest market share in 2015; however, Europe is projected to be the fastest-growing market during the forecast period.
The global market of key developing regions such as Asia-Pacific and the Middle East witnessed the entry of important market players, business units, and research centers of key players.
The key players in this market have been involved in the process of developing a range of customized solutions to target specific needs of the food manufacturers and consumer health. Thus, the sodium reduction ingredients market has been gaining more global presence and acceptance among authorities. Leading participants in this market include Cargill, Incorporated (U.S.), Kerry Group Plc (U.K.), Royal DSM N.V. (Netherlands), Angel Yeast Co. Ltd. (Japan), E.I. du Pont de Nemours & Co. (U.S.), Innophos Holdings Incorporated (U.S.), and Jungbunzlauer AG (Switzerland). These players have been implementing different strategies to achieve growth and development in the global market.
Investments on the development of new innovative products and capacity expansions exhibit the strong competition to capitalize on the potential market demand for sodium reduction ingredient products.
Table of Contents
1 Introduction (Page No. - 15)
1.1 Objectives of the Study
1.2 Market Definition
1.3 Market Scope
1.3.1 Years Considered for the Study
1.4 Currency Considered for the Study
1.5 Unit Considered for the Study
1.6 Limitations
1.7 Stakeholders
2 Research Methodology (Page No. - 18)
2.1 Research Data
2.1.1 Secondary Data
2.1.1.1 Key Data Taken From Secondary Sources
2.1.2 Primary Data
2.1.2.1 Key Data From Primary Sources
2.1.2.2 Breakdown of Primaries
2.2 Factor Analysis
2.2.1 Introduction
2.2.2 Demand-Side Analysis
2.2.2.1 Diversified Food Demand of A Growing Population
2.2.3 Supply-Side Analysis
2.2.3.1 Availability of Sodium Reduction Ingredients
2.3 Market Size Estimation
2.3.1 Bottom-Up Approach
2.3.2 Top-Down Approach
2.4 Market Breakdown & Data Triangulation
2.5 Research Assumptions & Limitations
2.5.1 Assumptions
2.5.2 Limitations
3 Executive Summary (Page No. - 26)
4 Premium Insights (Page No. - 29)
4.1 Attractive Opportunities in this Market
4.2 Mineral Salts: Leading Segment By Type
4.3 Asia-Pacific: Fastest-Growing Sodium Reduction Ingredients Market
4.4 Sodium Reduction Ingredients Market Growth Rate, By Country, 2015-2020
4.5 Sodium Reduction Ingredients Market: Developed vs. Developing Nations
4.6 Life Cycle Analysis, By Region
5 Market Overview (Page No. - 33)
5.1 Introduction
5.2 Market Segmentation
5.2.1 By Type
5.2.2 By Application
5.2.3 By Region
5.3 Market Dynamics
5.3.1 Drivers
5.3.1.1 Government Intervention and Awareness
5.3.1.2 Increasing Awareness Among Consumers About the Ill-Effects of Excessive Sodium Intake
5.3.1.3 Rise in Demand for Processed Foods and Improved Efforts By Food Manufacturers
5.3.1.4 Improved Product Taste
5.3.1.5 Improvement in Government Initiatives
5.3.2 Restraints
5.3.2.1 High Ingredient Costs
5.3.3 Opportunities
5.3.3.1 New Product Applications
5.3.4 Challenges
5.3.4.1 Changing Consumer Perception
5.3.5 Burning Issues
5.3.5.1 Lack of Awareness About High Intake of Sodium
5.4 Regulatory Requirements
5.4.1 World Health Organisation (WHO)
5.4.2 Codex Alimentarius
5.4.3 Food and Drug Administration (FDA)
5.4.4 European Commission
6 Industry Trends (Page No. - 43)
6.1 Introduction
6.2 Value Chain Analysis
6.3 Supply Chain Analysis
6.4 Porter�s Five Forces Analysis
6.4.1 Intensity of Competitive Rivalry
6.4.2 Bargaining Power of Suppliers
6.4.3 Bargaining Power of Buyers
6.4.4 Threat of New Entrants
6.4.5 Threat of Substitutes
7 Sodium Reduction Ingredients Market, By Type (Page No. - 47)
7.1 Introduction
7.2 Amino Acids
7.3 Mineral Salts
7.3.1 Potassium Chloride
7.3.2 Magnesium Sulfate
7.3.3 Potassium Lactate
7.3.4 Calcium Chloride
7.4 Yeast Extracts
7.5 Others
8 Sodium Reduction Ingredients Market, By Application (Page No. - 54)
8.1 Introduction
8.2 Bakery & Confectionery
8.2.1 Dairy & Frozen Foods
8.3 Meat Products
8.4 Sauces, Seasonings & Snacks
8.5 Other Applications
9 Sodium Reduction Ingredients Market, By Brand (Page No. - 62)
9.1 Introduction
9.1.1 Royal DSM N.V.
9.1.1.1 Maxarome
9.1.1.2 Peptopro
9.1.2 Cargill Incorporated
9.1.2.1 Flakeselect
9.1.2.2 Alberger
9.1.3 E. I. Du Pont De Nemours and Company
9.1.3.1 Grindsted
9.1.4 Innophos Holdings Incorporated
9.1.4.1 Cal-Rise
9.1.5 Jungbunzlauer AG
9.1.5.1 Sub4salt
10 Sodium Reduction Ingredients Market, By Region (Page No. - 64)
10.1 Introduction
10.2 North America
10.2.1 U.S.
10.2.2 Canada
10.2.3 Mexico
10.3 Europe
10.3.1 U.K.
10.3.2 Germany
10.3.2.1 Prevalence of Various National Initiatives
10.3.3 France
10.3.3.1 Baked Goods at the Forefront of Low-Sodium Foods
10.3.4 Italy
10.3.5 the Netherlands
10.3.6 Rest of Europe
10.4 Asia-Pacific
10.4.1 China
10.4.2 Japan
10.4.3 Australia
10.4.3.1 Industry Partnerships Formed to Bring Down Sodium Levels
10.4.4 New Zealand
10.4.5 Rest of Asia-Pacific
10.5 Rest of the World (RoW)
10.5.1 Brazil
10.5.2 Middle East
10.5.3 Other Countries in RoW
11 Competitive Landscape (Page No. - 95)
11.1 Overview
11.2 Sodium Reduction Ingredients Market Share Analysis (Developments)
11.3 Competitive Situation & Trends
11.4 New Product Launches
11.5 Mergers and Acquisitions
11.6 Agreements, Collaborations & Partnerships
11.7 Expansions
12 Company Profiles (Page No. - 100)
12.1 Introduction
(Overview, Financials, Products & Services, Strategy, and Developments)*
12.2 Royal DSM N.V.
12.3 Cargill, Inc.
12.4 Angel Yeast Co. Ltd.
12.5 E. I. Du Pont De Nemours and Company
12.6 Kerry Group PLC
12.7 Innophos Holdings Inc.
12.8 Jungbunzlauer AG
12.9 Sensient Technologies Corporation
12.10 Tate & Lyle PLC
12.11 Givaudan SA
� * The companies listed are a representative sample of the market�s ecosystem and in no particular order�
*Details on Overview, Financials, Product & Services, Strategy, and Developments Might Not Be Captured in Case of Unlisted Companies.
13 Appendix (Page No. - 124)
13.1 Insights of Industry Experts
13.2 Discussion Guide
13.3 Introducing RT: Real-Time Market Intelligence
13.4 Available Customizations
13.5 Related Reports
List of Tables (82 Tables)
Table 1 Assumptions of the Study
Table 2 Limitations of the Study
Table 3 Sodium Content in Various Foods and Food Groups
Table 4 Claims Provided By FDA
Table 5 Global Sodium Reduction Ingredients Market Size, By Type, 2013 - 2020 (Thousand Tons)
Table 6 Global Sodium Reduction Ingredients Market Size, By Type, 2013 - 2020 (USD Million)
Table 7 Amino Acids Market Size, By Region, 2013 - 2020 (Thousand Tons)
Table 8 Amino Acids Market Size, By Region, 2013 � 2020 (USD Million)
Table 9 Mineral Salts Market Size, By Region, 2013 - 2020 (Thousand Tons)
Table 10 Mineral Salts Market Size, By Region, 2013 - 2020 (USD Million)
Table 11 Yeast Extracts Market Size, By Region, 2013 - 2020 (Thousand Tons)
Table 12 Yeast Extracts Market Size, By Region, 2013 - 2020 (USD Million)
Table 13 Other Sodium Reduction Ingredients Market Size, By Region, 2013 - 2020 (Thousand Tons)
Table 14 Other Sodium Reduction Ingredients Market Size, By Region, 2013 - 2020 (USD Million)
Table 15 Sodium Reduction Ingredients Market Size, By Application, 2013�2020 (Thousand Tons)
Table 16 Market Size, By Application, 2013�2020 (USD Million)
Table 17 Sodium Reduction Ingredients Market Size for Bakery & Confectionery, By Region, 2013�2020 (Thousand Tons)
Table 18 Market Size for Bakery & Confectionery, By Region, 2013�2020 (USD Million)
Table 19 Market Size for Dairy & Frozen Foods, By Region, 2013�2020 (Thousand Tons)
Table 20 Market Size for Dairy & Frozen Foods, By Region, 2013�2020 (USD Million)
Table 21 Market Size for Meat Products, By Region, 2013�2020 (Thousand Tons)
Table 22 Market Size for Meat Products, By Region, 2013�2020 (USD Million)
Table 23 Sodium Reduction Ingredients Market Size for Sauces, Seasonings & Snacks, By Region, 2013�2020 (Thousand Tons)
Table 24 Market Size for Sauces, Seasonings & Snacks, By Region, 2013�2020 (USD Million)
Table 25 Market Size for Other Applications, By Region, 2013�2020 (Thousand Tons)
Table 26 Market Size for Other Applications, By Region, 2013�2020 (USD Million)
Table 27 Market Size, By Region, 2013-2020 (Thousand Tons)
Table 28 Market Size, By Region, 2013-2020 (USD Million)
Table 29 North America: Sodium Reduction Ingredients Market Size, By Country, 2013-2020 (Thousand Tons)
Table 30 North America: Market Size, By Country, 2013-2020 (USD Million)
Table 31 North America: Market Size, By Type, 2013-2020 (USD Million)
Table 32 North America: Market Size, By Application, 2013-2020 (USD Million)
Table 33 U.S.: Sodium Reduction Ingredients Market Size, By Type, 2013-2020 (USD Million)
Table 34 U.S.: Market Size, By Application, 2013-2020 (USD Million)
Table 35 Canada: Sodium Reduction Ingredients Market Size, By Type, 2013-2020 (USD Million)
Table 36 Canada: Market Size, By Application, 2013-2020 (USD Million)
Table 37 Mexico: Sodium Reduction Ingredients Market Size, By Type, 2013-2020 (USD Million)
Table 38 Mexico: Market Size, By Application, 2013-2020 (USD Million)
Table 39 Europe: Sodium Reduction Ingredients Market Size, By Country (Thousand Tons)
Table 40 Europe: Market Size, By Country, 2013-2020 (USD Million)
Table 41 Europe: Market Size, By Type 2013-2020 (USD Million)
Table 42 Europe: Market Size, By Application (USD Million)
Table 43 U.K.: Sodium Reduction Ingredients Market Size, By Type, 2013-2020 (USD Million)
Table 44 U.K.: Market Size, By Application, 2013-2020 (USD Million)
Table 45 Germany: Sodium Reduction Ingredients Market Size, By Type, 2013-2020 (USD Million)
Table 46 Germany: Market Size, By Application, 2013-2020 (USD Million)
Table 47 France: Sodium Reduction Ingredients Market Size, By Type, 2013-2020 (USD Million)
Table 48 France: Market Size, By Application, 2013-2020 (USD Million)
Table 49 Italy: Sodium Reduction Ingredients Market Size, By Type, 2013-2020 (USD Million)
Table 50 Italy: Market Size, By Application, 2013-2020 (USD Million)
Table 51 The Netherlands: Sodium Reduction Ingredients Market Size, By Type, 2013-2020 (USD Million)
Table 52 The Netherlands: Market Size, By Application, 2013-2020 (USD Million)
Table 53 Rest of Europe: Sodium Reduction Ingredients Market Size, By Type, 2013-2020 (USD Million)
Table 54 Rest of Europe: Market Size, By Application, 2013-2020 (USD Million)
Table 55 Asia-Pacific: Sodium Reduction Ingredients Market Size, By Country, 2013-2020 (Thousand Tons)
Table 56 Asia-Pacific: Market Size, By Country, 2013-2020 (USD Million)
Table 57 Asia-Pacific: Market Size, By Type, 2013-2020 (USD Million)
Table 58 Asia-Pacific: Market Size, By Application, 2013-2020 (USD Million)
Table 59 China: Sodium Reduction Ingredients Market Size, By Type, 2013-2020 (USD Million)
Table 60 China: Market Size, By Application, 2013-2020 (USD Million)
Table 61 Japan: Sodium Reduction Ingredients Market Size, By Type, 2013-2020 (USD Million)
Table 62 Japan: Market Size, By Application, 2013-2020 (USD Million)
Table 63 Australia: Sodium Reduction Ingredients Market Size, By Type, 2013-2020 (USD Million)
Table 64 Australia: Market Size, By Application, 2013-2020 (USD Million)
Table 65 New Zealand: Sodium Reduction Ingredients Market Size, By Type, 2013-2020 (USD Million)
Table 66 New Zealand: Market Size, By Application, 2013-2020 (USD Million)
Table 67 Rest of Asia-Pacific: Sodium Reduction Ingredients Market Size, By Type, 2013-2020 (USD Million)
Table 68 Rest of Asia-Pacific: Market Size, By Application, 2013-2020 (USD Million)
Table 69 RoW: Sodium Reduction Ingredients Market Size, By Country, 2013-2020 (Thousand Tons)
Table 70 RoW: Market Size, By Country, 2013-2020 (USD Million)
Table 71 RoW: Market Size, By Type, 2013-2020 (USD Million)
Table 72 RoW: Market Size, By Application, 2013-2020 (USD Million)
Table 73 Brazil: Sodium Reduction Ingredients Market Size, By Type, 2013-2020 (USD Million)
Table 74 Brazil: Market Size, By Application, 2013-2020 (USD Million)
Table 75 Middle East: Market Size, By Type, 2013-2020 (USD Million)
Table 76 Middle East: Market Size, By Application, 2013-2020 (USD Million)
Table 77 Others in RoW: Market Size, By Type, 2013-2020 (USD Million)
Table 78 Others in RoW: Market Size, By Application, 2013-2020 (USD Million)
Table 79 New Product Launches, 2010-2015
Table 80 Mergers and Acquisitions, 2010-2015
Table 81 Agreements & Collaborations, 2010-2015
Table 82 Expansions, 2010-2015
List of Figures (50 Figures)
Figure 1 Sodium Reduction Ingredients Market Segmentation
Figure 2 Research Design
Figure 3 Breakdown of Primary Interviews: By Company Type, Designation & Region
Figure 4 Population Growth Trend, 1961-2050
Figure 5 Market Size Estimation Methodology: Bottom-Up Approach
Figure 6 Market Size Estimation Methodology: Top-Down Approach
Figure 7 Data Triangulation
Figure 8 Market Snapshot (2015 vs. 2020)
Figure 9 Market, By Application ( USD Million)
Figure 10 Market, By Region (USD Million)
Figure 11 Market Share (Value), By Region, 2014
Figure 12 An Emerging Market With Promising Growth Potential, 2015-2020 (USD Million)
Figure 13 Mineral Salts Projected to Be the Largest Segment By 2020
Figure 14 Mineral Salts Segment Accounted for the Largest Share in the Asia-Pacific Sodium Reduction Ingredients Market, 2014 (USD Million)
Figure 15 New Zealand to Grow at the Highest CAGR in Sodium Reduction Ingredients Market, 2015-2020
Figure 16 Developed Markets Dominate and Offer Growth Opportunities, 2015-2020 (USD Million)
Figure 17 Sodium Reduction Ingredients Market is Projected to Experience Strong Growth in Europe
Figure 18 By Type
Figure 19 By Application
Figure 20 By Region
Figure 21 Increasing Health Awareness Drives Growth of this Market
Figure 22 Multi-Sector Salt Reduction Initiatives
Figure 23 R&D Contributes Major Value to Overall Price of this Market
Figure 24 Research Organizations & Technologists: Integral Part of Supply Chain of this Market
Figure 25 Porter�s Five Forces Analysis: Sodium Reduction Ingredients Market
Figure 26 Global Market Size, By Type, 2015 vs. 2020 (USD Million)
Figure 27 Market Size, By Application, 2015 vs. 2020 (USD Million)
Figure 28 Geographic Snapshot (2015-2020): European Markets Projected to Be High Growth Regions
Figure 29 The North American Sodium Reduction Ingredients Market Snapshot: U.S. Accounting for the Largest Market Share
Figure 30 European Sodium Reduction Ingredients Market Snapshot: U.K. Projecting the Highest Growth Rate
Figure 31 The Asia-Pacific Sodium Reduction Ingredients Market Snapshot: Australia Accounted for the Largest Market Share in 2014
Figure 32 New Product Launches & Expansions: Leading Strategies of Key Companies
Figure 33 Market Share (Development), By Company, 2010-2015
Figure 34 New Product Launches Fueled Growth & Innovation of Sodium Reduction Ingredients
Figure 35 New Product Launches: the Key Strategy, 2010-2015
Figure 36 Geographic Revenue Mix of Top 5 Sodium Reduction Ingredients Manufacturers
Figure 37 Royal DSM N.V.: Company Snapshot
Figure 38 Royal DSM N.V.: SWOT Analysis
Figure 39 Cargill, Inc.: Company Snapshot
Figure 40 Cargill, Inc.: SWOT Analysis
Figure 41 Angel Yeast Co. Ltd.: Company Snapshot
Figure 42 Angel Yeast Co. Ltd.: SWOT Analysis
Figure 43 E. I. Du Pont De Nemours and Company: Company Snapshot
Figure 44 E. I. Du Pont De Nemours and Company: SWOT Analysis
Figure 45 Kerry Group PLC: Company Snapshot
Figure 46 Kerry Group PLC: SWOT Analysis
Figure 47 Innophos Holdings Inc.: Company Snapshot
Figure 48 Sensient Technologies Corporation: Company Snapshot
Figure 49 Tate & Lyle PLC: Company Snapshot
Figure 50 Givaudan SA: Company Snapshot


Growth opportunities and latent adjacency in Sodium Reduction Ingredients Market