
Refrigerated Warehousing Market by Technology (Blast Freezing, Vapor Compression, PLC, Evaporative Cooling), Temperature (Chilled, Frozen), Application (Fruits & Vegetables, Bakery, Dairy, Meat, Seafood, Beverages), and Region - Global Forecast to 2022
Market Segmentation
| Report Metrics | Details |
|
Market size available for years |
2017 - 2022 |
|
CAGR % |
10.2 |
Top 10 companies in Refrigerated Warehousing Market
Refrigerated Warehousing Market News
| Publish Date | Refrigerated Warehousing Market Updates |
|---|---|
| 30-May-2023 | Emergent Cold Latin America Achieves Status of Largest Regional Warehousing Provider |


[167 Pages Report] The refrigerated warehousing market was valued at USD 16.67 Billion in 2016 and is projected to grow at a CAGR of 10.2% from 2017, to reach USD 29.17 Billion by 2022. The base year considered for the study is 2016, and the forecast period is from 2017 to 2022. The basic objective of the report is to define, segment, and project the global market size of the refrigerated warehousing market on the basis of technology, application, temperature, and region. It also helps to understand the structure of the refrigerated warehousing market by identifying its various segments. The other objectives include analyzing the opportunities in the market for stakeholders and providing the competitive landscape of market trends, the supply chain of this market, and projecting the size of the refrigerated warehousing market and its submarkets, in terms of value.
This report includes estimations of the market size in terms of value (USD billion). Both top-down and bottom-up approaches have been used to estimate and validate the size of the global refrigerated warehousing market and to estimate the size of various other dependent submarkets in the overall market. The key players in the market have been identified through secondary research, some of the sources are press releases, paid databases such as Factiva and Bloomberg, annual reports, and financial journals; their market share in the respective regions have also been determined through primary and secondary research. All percentage shares, splits, and breakdowns have been determined using secondary sources and were verified through primary sources. The figure below shows the breakdown of profiles of industry experts that participated in the primary discussions.
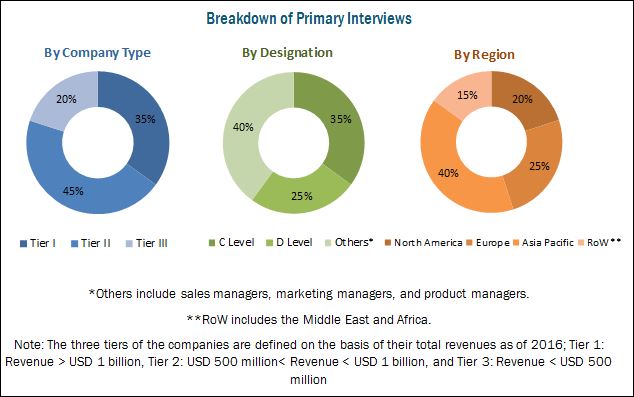
To know about the assumptions considered for the study, download the pdf brochure
The key participants in the refrigerated warehousing are the food & beverages manufacturers, equipment manufacturers, end users, and retail channels/supermarkets. The key players that are profiled in the report include AmeriCold Logistics (US), Lineage Logistics (US), Preferred Freezer Services (US), John Swire (UK), and AGRO Merchants (US), Nichirei Logistics (Japan), Kloosterboer Services (Netherlands), Interstate Cold Storage (US), Cloverleaf Cold Storage (US), Burris Logistics (US), Frialsa Frigor�ficos (Mexico), and Henningsen Cold Storage (US).
This report is targeted at the existing players in the industry, which include the following:
- Infrastructure providers: Refrigerated warehouse/cold storage owners, refrigeration and cold chain equipment, and refrigeration solution providers
- Intermediary providers: Refrigerated storage service providers, refrigerated warehousing players, warehousing agents, and supply chain solution providers
- End-user industries: Food processing businesses, seafood companies, and meat processors
�The study answers several questions for stakeholders, primarily which market segments to focus on in next two to five years for prioritizing efforts and investments.�
Get online access to the report on the World's First Market Intelligence Cloud
Request Sample Scope of the Report

On the basis of Technology, the refrigerated warehousing market has been segmented into:
- Blast freezing
- Vapor compression
- PLC
- Evaporative cooling
On the basis of Application, the refrigerated warehousing market has been segmented into:
- Fruits & vegetables
- Bakery & confectionery
- Milk & dairy products
- Meat
- Seafood
- Beverages
On the basis of Temperature, the refrigerated warehousing market has been segmented into:
- Chilled
- Frozen
On the basis of Region, the refrigerated warehousing market has been segmented into:
- North America
- Europe
- Asia Pacific
- RoW (The Middle East and Africa)
Available Customizations
With the given market data, MarketsandMarkets offers customizations according to the company�s specific needs.
The following customization options are available for the report:
Segment Analysis
- Product matrix, which gives a detailed comparison of the product portfolio of each company
- Detailed analysis in terms of volume can also be provided
Regional Analysis
- Further breakdown of the Rest of Asia Pacific refrigerated warehousing market, by country
- Further breakdown of the Rest of Europe refrigerated warehousing market, by country
- Further breakdown of other countries in the RoW refrigerated warehousing market, by country
Company Information
- Detailed analysis and profiling of additional market players (up to five)
The refrigerated warehousing market is projected to grow at a CAGR of 10.2% from 2017, to reach a value of USD 29.17 Billion by 2022. The global demand for refrigerated warehousing is increasing significantly due to the growing demand for frozen food products such as fish, meat, and seafood, leading to a rise in the requirement for refrigerated storage for these perishable foods. Growing health-consciousness among consumers and rising incomes have boosted the consumption of a wide variety of perishable products, particularly seafood, meat, and fruits & vegetables.
On the basis of technology, the refrigerated warehousing market was led by the blast freezing segment in 2016. Blast freezing is the most versatile method for freezing seafood, meat, fruits, and vegetables. This technology ensures increased control and protection from bacteria, preserves the nutrients of the food products, and is one of the most cost-effective methods for storing food products over a long period of time.
The refrigerated warehousing market, on the basis of application, is segmented into fruits & vegetables, bakery & confectionery, milk & dairy products, meat, seafood, and beverages. The fruits & vegetables segment accounted for the largest market share in 2016; this is attributed to the growing health-consciousness among consumers and their rising incomes which have boosted the consumption of a wide variety of frozen and chilled products, particularly fruits & vegetables. In North America and Europe, health concerns are driving the demand for fruits & vegetables, as consumers prefer healthier and more nutritious options in their diet.
The refrigerated warehousing market, based on temperature, is segmented into chilled and frozen. The frozen segment accounted for the larger market share owing to the increase in demand for perishable food products such as meat, fish, and seafood which require frozen temperature for storage. The demand for frozen food is increasing, particularly in the North American region.
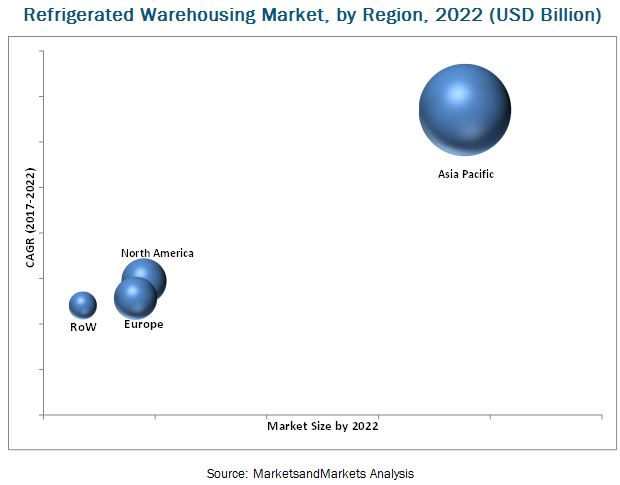
Asia Pacific accounted for the largest share of the refrigerated warehousing markets in 2016, owing to rapid urbanization and the expansion of retail channels. The major countries that contribute significantly to the growth of the Asia Pacific region are China, Japan, India, and Australia & New Zealand. The increasing demand for frozen food is further expected to boost the refrigerated warehousing market.
The major restraining factor for the refrigerated warehousing market is high energy consumption and infrastructure cost.
Companies such AmeriCold Logistics (US), Lineage Logistics (US), Preferred Freezer Services (US), John Swire (UK), and AGRO Merchants (US) have acquired a leading market position through the provision of large refrigerated warehousing capacity, catering to the varied requirements of the market, along with a focus on the diverse end-user segments. They also focus on expanding their presence geographically.
To speak to our analyst for a discussion on the above findings, click Speak to Analyst
Table of Contents
1 Introduction (Page No. - 16)
1.1 Objectives of the Study
1.2 Market Definition
1.3 Market Scope
1.4 Periodization
1.5 Currency
1.6 Units
1.7 Stakeholders
2 Research Methodology (Page No. - 21)
2.1 Research Data
2.1.1 Secondary Data
2.1.1.1 Key Data From Secondary Sources
2.1.2 Primary Data
2.1.2.1 Breakdown of Primaries
2.1.2.2 Key Industry Insights
2.2 Market Size Estimation
2.2.1 Bottom-Up Approach
2.2.2 Top-Down Approach
2.3 Data Triangulation
2.4 Research Assumptions & Limitations
2.4.1 Assumptions
2.4.2 Limitations
3 Executive Summary (Page No. - 32)
4 Premium Insights (Page No. - 37)
4.1 Attractive Opportunities in the Refrigerated Warehousing Market
4.2 Refrigerated Warehousing Market Growth, By Country
4.3 Milk & Dairy Products: the Fastest-Growing Market for Refrigerated Warehousing in Asia Pacific
4.4 Refrigerated Warehousing Market, By Technology
4.5 Refrigerated Warehouse Equipment Market, By Equipment Type
5 Market Overview (Page No. - 41)
5.1 Introduction
5.2 Market Dynamics
5.2.1 Drivers
5.2.1.1 Growth in Consumer Demand for Perishable Foods
5.2.1.2 Government Support for Infrastructural Development in the Refrigerated Warehousing Industry
5.2.1.3 Requirement of Food Safety & Taste Consistency
5.2.1.4 Development of Strong Retail Channels
5.2.2 Restraints
5.2.2.1 High Energy Consumption & Infrastructure Costs
5.2.3 Opportunities
5.2.3.1 Government Initiatives to Reduce Post-Harvest & Processed Food Wastage
5.2.3.2 Need for Expansion of Refrigerated Warehouses in Asian Countries
5.2.4 Challenges
5.2.4.1 Lack of Infrastructural Support in Emerging Markets & Skilled Resources in Global Markets
6 Refrigerated Warehousing Market, By Technology (Page No. - 48)
6.1 Introduction
6.2 Blast Freezing
6.3 Vapor Compression
6.4 Programmable Logic Controller (PLC)
6.5 Evaporative Cooling
6.6 Others
7 Refrigerated Warehousing Market, By Temperature (Page No. - 56)
7.1 Introduction
7.2 Chilled
7.3 Frozen
8 Refrigerated Warehousing Market, By Application (Page No. - 61)
8.1 Introduction
8.2 Fruits & Vegetables
8.3 Bakery & Confectionery Products
8.4 Milk & Dairy Products
8.5 Meat
8.6 Seafood
8.7 Beverages
8.8 Others
9 Refrigerated Warehousing Equipment Market, By Type (Page No. - 72)
9.1 Introduction
9.2 Compressors
9.3 Condensers
9.4 Evaporators
9.5 Controls
9.6 Vessels, Pumps, Valves, and Auxiliary Equipment
10 Refrigerated Warehousing Market, By Region (Page No. - 76)
10.1 Introduction
10.2 North America
10.2.1 US
10.2.2 Canada
10.2.3 Mexico
10.3 Europe
10.3.1 Germany
10.3.2 UK
10.3.3 France
10.3.4 Italy
10.3.5 Rest of Europe
10.4 Asia Pacific
10.4.1 China
10.4.2 India
10.4.3 Japan
10.4.4 Australia & New Zealand
10.4.5 Rest of Asia-Pacific
10.5 RoW
10.5.1 Brazil
10.5.2 South Africa
10.5.3 Others in RoW
11 Refrigerated Warehousing Market: Regulations (Page No. - 118)
11.1 Introduction
11.2 Food Safety
11.2.1 US
11.2.2 Canada
11.2.3 UK
11.2.4 India
11.2.5 China
11.2.6 Australia
12 Competitive Landscape (Page No. - 124)
12.1 Market Ranking Analysis, By Key Player
13 Company Profiles (Page No. - 125)
(Business Overview, Services Offered, Strength of Service Portfolio, Business Strategy Excellence, Recent Developments)*
13.1 Introduction
13.2 Americold Logistics
13.3 Lineage Logistics
13.4 Preferred Freezer Services
13.5 John Swire
13.6 Agro Merchants
13.7 Nichirei Logistics
13.8 Kloosterboer Services
13.9 Interstate Cold Storage
13.10 Cloverleaf Cold Storage
13.11 Burris Logistics
13.12 Frialsa Frigor�ficos
13.13 Henningsen Cold Storage
*Details on Business Overview, Services Offered, Strength of Service Portfolio, Business Strategy Excellence, Recent Developments Might Not Be Captured in Case of Unlisted Companies.
14 Appendix (Page No. - 159)
14.1 Discussion Guide
14.2 Knowledge Store: Marketsandmarkets� Subscription Portal
14.3 Introducing RT: Real Time Market Intelligence
14.4 Available Customizations
14.5 Related Reports
14.6 Author Details
List of Tables (111 Tables)
Table 1 Organizations Working Around the World to Improve the Food System
Table 2 Refrigerated Warehousing Market Size, By Technology, 2015�2022 (USD Million)
Table 3 Refrigerated Warehousing Market Size, By Technology, 2015�2022 (MCM)
Table 4 Blast Freezing in Refrigerated Warehousing Market Size, By Region, 2015�2022 (USD Million)
Table 5 Blast Freezing in Refrigerated Warehousing Market Size, By Region, 2015�2022 (MCM)
Table 6 Vapor Compression in Refrigerated Warehousing Market Size, By Region, 2015�2022 (USD Million)
Table 7 Vapor Compression in Refrigerated Warehousing Market Size, By Region, 2015�2022 (MCM)
Table 8 PLC in Refrigerated Warehousing Market Size, By Region, 2015�2022 (USD Million)
Table 9 PLC in Refrigerated Warehousing Market Size, By Region, 2015�2022 (MCM)
Table 10 Evaporative Cooling in Refrigerated Warehousing Market Size, By Region, 2015�2022 (USD Million)
Table 11 Evaporative Cooling in Refrigerated Warehousing Market Size, By Region, 2015�2022 (MCM)
Table 12 Other Technologies in Refrigerated Warehousing Market Size, By Region, 2015�2022 (USD Million)
Table 13 Other Technologies in Refrigerated Warehousing Market Size, By Region, 2015�2022 (MCM)
Table 14 Refrigerated Warehousing Market Size, By Temperature, 2017�2022 (USD Million)
Table 15 Refrigerated Warehousing Market Size, By Temperature, 2017�2022 (MCM)
Table 16 Refrigerated Warehousing Market Size for Chilled Products, By Region, 2017�2022 (USD Million)
Table 17 Refrigerated Warehousing Market Size for Chilled Products, By Region, 2017�2022 (MCM)
Table 18 Refrigerated Warehousing Market Size for Frozen Products, By Region, 2017�2022 (USD Million)
Table 19 Refrigerated Warehousing Market Size for Frozen Products, By Region, 2017�2022 (MCM)
Table 20 Refrigerated Warehousing Market Size, By Application, 2015�2022 (USD Million)
Table 21 Refrigerated Warehousing Market Size, By Application, 2015�2022 (MCM)
Table 22 Refrigerated Warehousing Market Size in Fruits & Vegetables, By Region, 2015�2022 (USD Million)
Table 23 Refrigerated Warehousing Market Size for Fruits & Vegetables, By Region, 2015�2022 (MCM)
Table 24 Effect of Time and Temperature on Quality Loss in Storage
Table 25 Refrigerated Warehousing Market Size for Bakery & Confectionery Products, By Region, 2015�2022 (USD Million)
Table 26 Refrigerated Warehousing Market Size for Bakery & Confectionery Products, By Region, 2015�2022 (MCM)
Table 27 Refrigerated Warehousing Market Size for Milk & Dairy Products, By Region, 2015�2022 (USD Million)
Table 28 Refrigerated Warehousing Market Size for Milk & Dairy Products, By Region, 2015�2022 (MCM)
Table 29 Refrigerated Warehousing Market Size for Meat, By Region, 2015�2022 (USD Million)
Table 30 Refrigerated Warehousing Market Size for Meat, By Region, 2015�2022 (MCM)
Table 31 Refrigerated Warehousing Market Size for Seafood, By Region, 2015�2022 (USD Million)
Table 32 Refrigerated Warehousing Market Size for Seafood, By Region, 2015�2022 (MCM)
Table 33 Refrigerated Warehousing Market Size for Beverages, By Region, 2015�2022 (USD Million)
Table 34 Refrigerated Warehousing Market Size for Beverages, By Region, 2015�2022 (MCM)
Table 35 Refrigerated Warehousing Market Size for Other Applications, By Region, 2015�2022 (USD Million)
Table 36 Refrigerated Warehousing Market Size for Others, By Region, 2015�2022 (MCM)
Table 37 Refrigerated Warehousing Equipment Market Size, By Region, 2015�2022 (USD Million)
Table 38 Refrigerated Warehousing Equipment Market Size, By Type, 2015�2022 (USD Million)
Table 39 Refrigerated Warehousing Market Size, By Region, 2015-2022 (USD Million)
Table 40 North America: Refrigerated Warehousing Market Size, By Country, 2015�2022 (MCM)
Table 41 North America: Refrigerated Warehousing Market Size, By Country, 2015�2022 (USD Million)
Table 42 North America: Refrigerated Warehousing Market Size, By Technology, 2015�2022 (MCM)
Table 43 North America: Refrigerated Warehousing Market Size, By Technology, 2015�2022 (USD Million)
Table 44 North America: Refrigerated Warehousing Market Size, By Temperature, 2015�2022 (MCM)
Table 45 North America: Refrigerated Warehousing Market Size, By Temperature, 2015�2022 (USD Million)
Table 46 North America: Refrigerated Warehousing Market Size, By Application, 2015�2022 (MCM)
Table 47 North America: Refrigerated Warehousing Market Size, By Application, 2015�2022 (USD Million)
Table 48 North America: Refrigerated Warehouse Equipment Market, By Type, 2015�2022 (USD Million)
Table 49 US: Refrigerated Warehousing Market Size, By Temperature, 2015�2022 (MCM)
Table 50 US: Refrigerated Warehousing Market Size, By Temperature, 2015�2022 (USD Million)
Table 51 Canada: Refrigerated Warehousing Market Size, By Temperature, 2015�2022 (MCM)
Table 52 Canada: Refrigerated Warehousing Market Size, By Temperature, 2015�2022 (USD Million)
Table 53 Mexico: Refrigerated Warehousing Market Size, By Temperature, 2015�2022 (MCM)
Table 54 Mexico: Refrigerated Warehousing Market Size, By Temperature, 2015�2022 (USD Million)
Table 55 Europe: Refrigerated Warehousing Market Size, By Country, 2015�2022 (MCM)
Table 56 Europe: Refrigerated Warehousing Market Size, By Country, 2015�2022 (USD Million)
Table 57 Europe: Refrigerated Warehousing Market Size, By Technology, 2015�2022 (MCM)
Table 58 Europe: Refrigerated Warehousing Market Size, By Technology, 2015�2022 (USD Million)
Table 59 Europe: Refrigerated Warehousing Market Size, By Temperature, 2015�2022 (MCM)
Table 60 Europe: Refrigerated Warehousing Market Size, By Temperature, 2015�2022 (USD Million)
Table 61 Europe: Refrigerated Warehousing Market Size, By Application, 2015�2022 (MCM)
Table 62 Europe: Refrigerated Warehousing Market Size, By Application, 2015�2022 (USD Million)
Table 63 Europe: Refrigerated Warehouse Equipment Market Size, By Type, 2015�2022 (USD Million)
Table 64 Germany: Refrigerated Warehousing Market Size, By Temperature, 2015�2022 (MCM)
Table 65 Germany: Refrigerated Warehousing Market Size, By Temperature, 2015�2022 (USD Million)
Table 66 UK: Refrigerated Warehousing Market Size, By Temperature, 2015�2022 (MCM)
Table 67 UK: Refrigerated Warehousing Market Size, By Temperature, 2015�2022 (USD Million)
Table 68 France: Refrigerated Warehousing Market Size, By Temperature, 2015�2022 (MCM)
Table 69 France: Refrigerated Warehousing Market Size, By Temperature, 2015�2022 (USD Million)
Table 70 Italy: Refrigerated Warehousing Market Size, By Temperature, 2015�2022 (MCM)
Table 71 Italy: Refrigerated Warehousing Market Size, By Temperature, 2015�2022 (USD Million)
Table 72 Rest of Europe: Refrigerated Warehousing Market Size, By Temperature, 2015�2022 (MCM)
Table 73 Rest of Europe: Refrigerated Warehousing Market Size, By Temperature, 2015�2022 (USD Million)
Table 74 Asia Pacific: Refrigerated Warehousing Market Size, By Country, 2015�2022 (MCM)
Table 75 Asia Pacific: Refrigerated Warehousing Market Size, By Country, 2015�2022 (USD Million)
Table 76 Asia Pacific: Refrigerated Warehousing Market Size, By Technology, 2015�2022 (MCM)
Table 77 Asia Pacific: Refrigerated Warehousing Market Size, By Technology, 2015�2022 (USD Million)
Table 78 Asia Pacific: Refrigerated Warehousing Market Size, By Temperature, 2015�2022 (MCM)
Table 79 Asia Pacific: Refrigerated Warehousing Market Size, By Temperature, 2015�2022 (USD Million)
Table 80 Asia Pacific: Refrigerated Warehousing Market Size, By Application, 2015�2022 (MCM)
Table 81 Asia Pacific: Refrigerated Warehousing Market Size, By Application, 2015�2022 (USD Million)
Table 82 Asia Pacific: Refrigerated Warehousing Equipment Market Size, By Type, 2015�2021 (MCM)
Table 83 China: Refrigerated Warehousing Market Size, By Temperature, 2015�2022 (MCM)
Table 84 China: Refrigerated Warehousing Market Size, By Temperature, 2015�2022 (USD Million)
Table 85 India: Refrigerated Warehousing Market Size, By Temperature, 2015�2022 (MCM)
Table 86 India: Refrigerated Warehousing Market Size, By Temperature, 2015�2022 (USD Million)
Table 87 Japan: Refrigerated Warehousing Market Size, By Temperature, 2015�2022 (MCM)
Table 88 Japan: Refrigerated Warehousing Market Size, By Temperature, 2015�2022 (USD Million)
Table 89 Australia & New Zealand: Refrigerated Warehousing Market Size, By Temperature, 2015�2022 (MCM)
Table 90 Australia & New Zealand: Refrigerated Warehousing Market Size, By Temperature, 2015�2022 (USD Million)
Table 91 Rest of Asia Pacific: Refrigerated Warehousing Market Size, By Temperature, 2015�2022 (MCM)
Table 92 Rest of Asia Pacific: Refrigerated Warehousing Market Size, By Temperature, 2015�2022 (USD Million)
Table 93 RoW: Refrigerated Warehousing Market Size, By Country, 2015�2022 (MCM)
Table 94 RoW: Refrigerated Warehousing Market Size, By Country, 2015�2022 (USD Million)
Table 95 RoW: Refrigerated Warehousing Market Size, By Technology, 2015�2022 (MCM)
Table 96 RoW: Refrigerated Warehousing Market Size, By Technology, 2015�2022 (USD Million)
Table 97 RoW: Refrigerated Warehousing Market Size, By Temperature, 2015�2022(MCM)
Table 98 RoW: Refrigerated Warehousing Market Size, By Temperature, 2015�2022 (USD Million)
Table 99 RoW: Refrigerated Warehousing Market Size, By Application, 2015�2022 (MCM)
Table 100 RoW: Refrigerated Warehousing Market Size, By Application, 2015�2022 (USD Million)
Table 101 RoW: Refrigerated Warehouse Equipment Market Size, By Type, 2015�2021 (MCM)
Table 102 Brazil: Refrigerated Warehousing Market Size, By Temperature, 2015�2022 (MCM)
Table 103 Brazil: Refrigerated Warehousing Market Size, By Temperature, 2015�2022 (USD Million)
Table 104 South Africa: Refrigerated Warehousing Market Size, By Temperature, 2015�2022 (MCM)
Table 105 South Africa: Refrigerated Warehousing Market Size, By Temperature, 2015�2022 (USD Million)
Table 106 Others in RoW: Refrigerated Warehousing Market Size, By Temperature, 2015�2022 (MCM)
Table 107 Others in RoW: Refrigerated Warehousing Market Size, By Temperature, 2015�2022 (USD Million)
Table 108 Storage Time for Refrigerated Foods
Table 109 Baseline Insulation for Refrigerated Storage Facilities
Table 110 Interior Partition Door Selection for Refrigerated Storage Facilities
Table 111 Top Five Players in the Refrigerated Warehousing Market, 2017
List of Figures (33 Figures)
Figure 1 Market Segmentation: Refrigerated Warehousing Market
Figure 2 Market Segmentation: Refrigerated Warehousing Equipment Market
Figure 3 Geographic Scope
Figure 4 Refrigerated Warehousing Market: Research Design
Figure 5 Refrigerated Warehousing: Market Size Estimation Methodology: Bottom-Up Approach
Figure 6 Refrigerated Warehousing Equipment: Market Size Estimation Methodology: Bottom-Up Approach
Figure 7 Refrigerated Warehousing: Market Size Estimation Methodology: Top-Down Approach
Figure 8 Refrigerated Warehousing Equipment: Market Size Estimation Methodology: Top-Down Approach
Figure 9 Data Triangulation
Figure 10 Assumptions of the Research Study
Figure 11 Limitations of the Research Study
Figure 12 Refrigerated Warehousing Market Size, By Temperature, 2017 vs 2022 (USD Billion)
Figure 13 Refrigerated Warehousing Market Size, By Technology, 2017 vs 2022 (USD Billion)
Figure 14 Refrigerated Warehousing Market, By Application, 2017 vs 2022 (USD Billion)
Figure 15 Refrigerated Warehousing Equipment Market Size, 2017 vs 2022 (USD Million)
Figure 16 Refrigerated Warehousing Market: Regional Snapshot
Figure 17 Refrigerated Warehousing: an Emerging Market With Promising Growth Potential
Figure 18 China to Grow at the Highest CAGR in Refrigerated Warehousing Market, 2017-2022
Figure 19 Milk & Dairy Products Dominated the Asia Pacific Market in 2016
Figure 20 Blast Freezing Technology Expected to Dominate the Market Throughout the Forecast Period (2017�2022)
Figure 21 Compressors Expected to Dominate the Market Throughout the Forecast Period (2017 vs 2022)
Figure 22 Increase in Demand for Perishable Foods is Driving the Global Market for Refrigerated Warehousing
Figure 23 Import of Perishable Foods in Developed Economies (2009�2013)
Figure 24 Export of Perishable Foods in Developing Economies (2009�2013)
Figure 25 Refrigerated Warehousing Market: Blast Freezing is the Largest Segment, 2017 vs 2022 (USD Million)
Figure 26 Refrigerated Warehousing Market Share, By Temperature, 2017 vs 2022 (USD Million)
Figure 27 Refrigerated Warehousing Market: Fruits & Vegetables to Be the Largest Segment, 2017 vs 2022 (USD Million)
Figure 28 Refrigerated Warehousing Equipment Market: Compressors Segment Projected to Be the Largest, 2017 vs 2022 (USD Million)
Figure 29 Geographic Snapshot (2017�2022): Rapidly Growing Asia Pacific Markets are Emerging as New Hotspots
Figure 30 Asia Pacific Projected to Dominate the Global Refrigerated Warehousing Market
Figure 31 North America: Market Snapshot
Figure 32 Europe: Refrigerated Warehousing Market Snapshot
Figure 33 Asia Pacific: Market Snapshot


Growth opportunities and latent adjacency in Refrigerated Warehousing Market