
Polyol Sweeteners Market by Type (Sorbitol, Maltitol, Isomalt, Erythritol, Xylitol), Application (Bakery & Confectionery, Oral Care, Pharmaceuticals, Beverages, Dairy), Form (Powder/Crystal, Liquid/Syrup), and Region - Global Forecast to 2022
Market Segmentation
| Report Metrics | Details |
|
Market size available for years |
2017 - 2022 |
|
CAGR % |
5.9 |
Top 10 companies in Polyol Sweeteners Market


The polyol sweeteners market was valued at USD 2.34 billion in 2016 and is projected to grow at a CAGR of 5.9% from 2017, to reach a projected value of USD 3.30 Billion by 2022.
The years considered for the study are as follows:
- Base year – 2016
- Estimated year – 2017
- Projected year – 2022
- Forecast period – 2017 to 2022
The objectives of the report are as follows:
- To define, segment, and measure the polyol sweeteners market with respect to its source, form, method of production, application, and region
- To provide detailed information regarding the crucial factors influencing the growth of the market (drivers, restraints, opportunities, and industry-specific challenges)
- To project the size of the market, in terms of value (USD million), in the key regions, namely, North America, Europe, Asia Pacific, South America, and the Rest of the World (RoW)
- To analyze opportunities in the market for stakeholders and study the details of the competitive landscape, to be provided to the key market leaders
- To strategically profile the key players and comprehensively analyze their market share and core competencies
- To analyze the competitive developments such as new product launches, acquisitions, investments, expansions, partnerships, agreements, joint ventures, and collaborations in the polyol sweetener market
Research Methodology:
- Major regions were identified along with countries contributing the maximum share.
- Secondary research was conducted to obtain the value of the global polyol sweeteners market for regions such as North America, Europe, Asia Pacific, South America, and RoW.
- Key players have been identified through secondary sources, such as the Bloomberg Businessweek, Factiva and companies’ annual reports, while their market share in the respective regions has been determined through both, primary and secondary research.
- The research methodology includes the study of annual and financial reports of top market players as well as interviews with industry experts (such as CEOs, VPs, directors, and marketing executives) for key insights (both quantitative and qualitative) for the global market.
To know about the assumptions considered for the study, download the pdf brochure
The key players profiled in this report include Cargill (US), Archer Daniels Midland Company (US), E.I. Du Point De Nemours and Company (US), Roquette Frères S.A. (France), Tereos Starch & Sweeteners (France), Südzucker AG (Germany), Ingredion Incorporated (US), Jungbunzlauer Suisse AG (Switzerland), Gulshan Polyols Limited (India), Batory Foods (US), B Food Science Co., Ltd. (Japan), and Dfi Corporation (US).
Target Audience:
- Raw material suppliers
- Polyol sweeteners manufacturers
- Technology providers to the polyol sweetener manufacturers
- Regulatory bodies including government agencies and NGOs
- Food safety agencies such as the Food & Drug Administration (FDA) and The European Food Information Council (EUFIC)
- Food ingredient manufacturers/suppliers
- Commercial research & development (R&D) institutions and financial institutions
- Importers and exporters of polyol sweeteners
- Polyol sweetener traders, distributors, and suppliers
- Government organizations, research organizations, and consulting firms
- Trade associations and industry bodies
Scope of the Polyol Sweeteners Market report
On the basis of type, the market has been segmented as follows:
- Sorbitol
- Erythritol
- Maltitol
- Isomalt
- Xylitol
- Others
On the basis of Application, the market has been segmented as follows:
- Powder/Crystal
- Liquid/Syrup
On the basis of Form, the market has been segmented as follows:
- Bakery & Confectionery
- Beverages
- Dairy
- Oral Care
- Pharmaceuticals
- Others
On the basis of Function, the market has been segmented as follows:
- Flavoring or Sweetening Agents
- Bulking Agents
- Excipients
- Humectants
- Others
On the basis of Region, the market has been segmented as follows:
- North America
- Europe
- Asia Pacific
- Rest of the World (RoW)
Available Customizations
With the given market data, MarketsandMarkets offers customizations according to the company’s specific scientific needs.
The following customization options are available for the report:
Product Analysis
- Product matrix, which gives a detailed comparison of the product portfolio of each company
Geographic Analysis
- Further breakdown of the Rest of Europe polyol sweeteners market into Russia, Denmark, Sweden, Belgium, Poland, and Norway
- Further breakdown of the Rest of Asia-Pacific market into Malaysia, Indonesia, and Vietnam
- Further breakdown of the RoW market into Paraguay, Uruguay, Chile, and Cuba
Company Information
- Detailed analyses and profiling of additional market players (up to five)
The demand for low-calorie products is high as the food & beverage companies use polyols that provide quality and functional benefits.
The report categorizes the global polyol sweetener market by type (Sorbitol, Erythritol, Maltitol, Isomalt, Xylitol, and Others), form (powder and liquid), application (bakery & confectionery, beverages, dairy, oral care, pharmaceuticals, and others), function (flavoring or sweetening agents, bulking agents, excipients, humectants, and others), and region.
In terms of type, sorbitol is expected to represent the largest segment in the market in 2017. The growth in the cosmetics & personal care industry is also projected to fuel the demand for sorbitol across regions.
The powder/crystal segment dominated the polyol sweeteners market with the largest share of 65.6% in 2017. This is attributed to convenience in usage, storing, and transportation of the polyol sweeteners in this form.
The bakery & confectionery segment is estimated to dominate the global market in terms of application. Due to the increasing number of health issues, consumers are more inclined toward the consumption of low-calorie products.
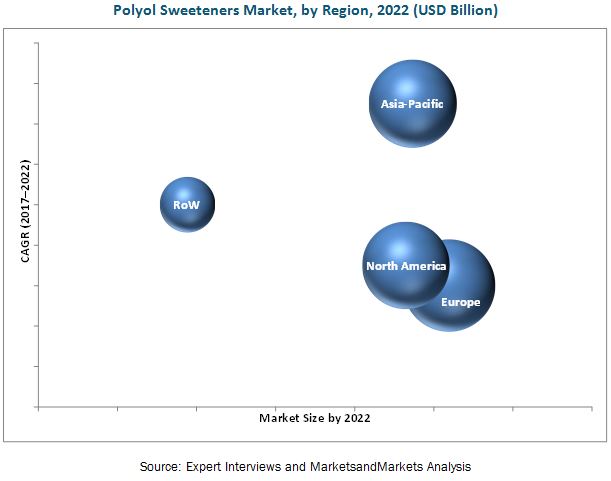
Europe is expected to account for the largest share in the global polyol sweeteners market in 2017. As the consumers in the European countries are health conscious, they prefer checking the ingredients of the food products before making a purchase decision. Increasing awareness among consumers in this region has led to a surge in demand for low-calorie foods. This is projected to contribute toward the growth of the global market over the coming years.
Key players identify in the polyol sweetener market include Cargill (US), Archer Daniels Midland Company (US), E.I. Du Point De Nemours and Company (US), Roquette Frères S.A. (France), Tereos Starch & Sweeteners (France), and Südzucker AG (Germany).
To speak to our analyst for a discussion on the above findings, click Speak to Analyst
Table of Contents
1 Introduction (Page No. - 14)
1.1 Objectives of the Study
1.2 Market Definition
1.3 Study Scope
1.4 Periodization Considered
1.5 Currency Considered
1.6 Unit Considered
1.7 Stakeholders
2 Research Methodology (Page No. - 18)
2.1 Research Data
2.1.1 Secondary Data
2.1.2 Primary Data
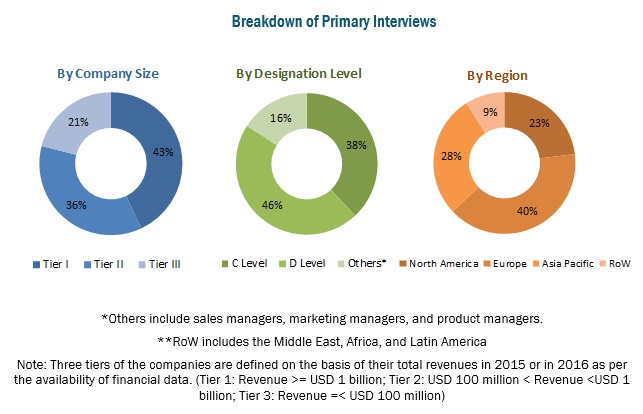
2.1.2.1 Breakdown of Primary Interviews
2.2 Polyol Sweeteners Market Breakdown and Data Triangulation
2.3 Market Size Estimation
2.4 Market Breakdown & Data Triangulation
2.5 Research Assumptions & Limitations
2.5.1 Assumptions
2.5.2 Limitations
3 Executive Summary (Page No. - 25)
4 Premium Insights (Page No. - 29)
4.1 Opportunities in this Market
4.2 Polyol Sweeteners Market, By Type & Region
4.3 Europe: Market, By Form & Country
4.4 Market, By Application & Region
4.5 Market, By Form
5 Market Overview (Page No. - 33)
5.1 Introduction
5.2 Value Chain Analysis
5.3 Market Dynamics
5.3.1 Drivers
5.3.1.1 Rising Consumer Demand for Low-Calorie and Healthier Food & Beverage Products
5.3.1.2 Increasing Disposable Income and Improving Lifestyles
5.3.1.3 Growing Awareness About the Functionalities of Polyol Sweeteners in Pharmaceutical Applications
5.3.2 Restraints
5.3.2.1 Higher Cost of Production of Food & Beverage Products With Polyol Sweeteners Compared to Sugar
5.3.3 Opportunities
5.3.3.1 R&D to Develop Innovative and Safer Sugar Substitutes
5.3.4 Challenges
5.3.4.1 Ambiguity Related to the Side-Effects of Polyol Sweeteners Among Consumers
5.3.4.2 Stringent Regulations and International Quality Standards for Polyol Sweeteners
6 Polyol Sweeteners Market, By Type (Page No. - 39)
6.1 Introduction
6.2 Sorbitol
6.3 Erythritol
6.4 Maltitol
6.5 Isomalt
6.6 Xylitol
6.7 Others
7 Polyol Sweeteners Market, By Form (Page No. - 49)
7.1 Introduction
7.2 Powder/Crystal
7.3 Liquid/Syrup
8 Polyol Sweeteners Market, By Application (Page No. - 55)
8.1 Introduction
8.2 Bakery & Confectionery
8.3 Beverages
8.4 Dairy
8.5 Oral Care
8.6 Pharmaceuticals
8.7 Others
9 Polyol Sweeteners Market, By Function (Qualitative) (Page No. - 62)
9.1 Introduction
9.2 Flavoring Or Sweetening Agents
9.3 Bulking Agents
9.4 Excipients
9.5 Humectants
9.6 Others
10 Polyol Sweeteners Market, By Region (Page No. - 64)
10.1 Introduction
10.2 North America
10.2.1 U.S.
10.2.2 Canada
10.2.3 Mexico
10.3 Europe
10.3.1 Germany
10.3.2 France
10.3.3 U.K.
10.3.4 Italy
10.3.5 Spain
10.3.6 Rest of Europe
10.4 Asia-Pacific
10.4.1 China
10.4.2 Japan
10.4.3 India
10.4.4 Australia & New Zealand
10.4.5 Rest of Asia-Pacific
10.5 Rest of the World (RoW)
10.5.1 South America
10.5.2 Middle East & Africa
11 Competitive Landscape (Page No. - 95)
11.1 Introduction
11.2 Vendor Dive
11.2.1 Vanguard
11.2.2 Innovator
11.2.3 Dynamic
11.2.4 Emerging
11.3 Competitive Benchmarking
11.3.1 Product Offering Scorecard (For All 25 Players)
11.3.2 Business Strategy Scorecard (For All 25 Players)
*Top 25 Companies Analyzed for This Study are – Cargill (U.S.), Archer Daniels Midland Company (U.S.), Ingredion Incorporated. (U.S.), E. I. Du Pont De Nemours and Company (U.S.), Tereos(France), Roquette Freres S.A. (France), Jungbunzlauer Suisse AG (Switzerland), Gulshan Polyol Limited (India), Batory Foods (U.S.), Südzucker(Germany), Fraken Biochem (China), Beckman Kenko (Germany), B Food Science Co., Ltd. (Japan), Dfi Corporation (U.S.), Mitsubishi Shoji Foodtech Co., Ltd. (Japan), Novagreen Inc. (Canada), Kashyap Sweeteners (India), Zuchem Inc. (U.S.), American International Foods Inc. (U.S.), Ecogreen Oleochemicals GmbH (Singapore), Sweeteners Plus Inc. (U.S.), the Ingredeint House (U.S.), Spi Pharma (U.S.), Hyet Sweet (U.S.), the Sukhjit Starch & Chemicals Ltd. (India)
12 Company Profiles (Page No. - 99)
(Business Overview, Products Offered & Services Strategies, Key Insights, Recent Developments, MnM View)*
12.1 Cargill
12.2 Archer Daniels Midland Company
12.3 E.I. Du Point De Nemours and Company
12.4 Roquette Frères S.A.
12.5 Tereos Starch & Sweeteners
12.6 Südzucker AG
12.7 Ingredion Incorporated
12.8 Jungbunzlauer Suisse AG
12.9 Gulshan Polyols Limited
12.10 Batory Foods
12.11 B Food Science Co., Ltd.
12.12 Dfi Corporation
*Details on Business Overview, Products Offered & Services Strategies, Key Insights, Recent Developments, MnM View Might Not Be Captured in Case of Unlisted Companies.
13 Appendix (Page No. - 129)
13.1 Discussion Guide
13.2 Knowledge Store: Marketsandmarkets’ Subscription Portal
13.3 Introducing RT: Real-Time Market Intelligence
13.4 Available Customizations
13.5 Related Reports
13.6 Author Details
List of Tables (70 Tables)
Table 1 Global Diabetes Prevalence in 2015 & 2040, Population (Million)
Table 2 Polyol Sweeteners Market Size, By Type, 2015–2022 (USD Million)
Table 3 Market Size, By Type, 2015–2022 (KT)
Table 4 Sorbitol Market Size, By Region, 2015–2022 (USD Million)
Table 5 Sorbitol Market Size, By Region, 2015–2022 (KT)
Table 6 Erythritol Market Size, By Region, 2015–2022 (USD Million)
Table 7 Erythritol Market Size, By Region, 2015–2022 (KT)
Table 8 Maltitol Market Size, By Region, 2015–2022 (USD Million)
Table 9 Maltitol Market Size, By Region, 2015–2022 (KT)
Table 10 Isomalt Market Size, By Region, 2015–2022 (USD Million)
Table 11 Isomalt Market Size, By Region, 2015–2022 (KT)
Table 12 Xylitol Market Size, By Region, 2015–2022 (USD Million)
Table 13 Xylitol Market Size, By Region, 2015–2022 (KT)
Table 14 Other Polyol Sweeteners Market Size, By Region, 2015–2022 (USD Million)
Table 15 Other Polyol Sweeteners Market Size, By Region, 2015–2022 (KT)
Table 16 Polyol Sweeteners Market Size, By Form, 2015–2022 (USD Million)
Table 17 Market Size, By Form, 2015–2022 (KT)
Table 18 Powder/Crystal Polyol Sweeteners Market Size, By Region, 2015–2022 (USD Million)
Table 19 Powder/Crystal Polyol Sweetener Market Size, By Region, 2015–2022 (KT)
Table 20 Liquid/Syrup Polyol Sweetener Market Size, By Region, 2015–2022 (USD Million)
Table 21 Liquid/Syrup Polyol Sweetener Market Size, By Region, 2015–2022 (KT)
Table 22 Polyol Sweeteners Market Size, By Application, 2015–2022 (USD Million)
Table 23 Bakery & Confectionery Market Size, By Region, 2015–2022 (USD Million)
Table 24 Beverages Market Size, By Region, 2015–2022 (USD Million)
Table 25 Dairy Products Market Size, By Region, 2015–2022 (USD Million)
Table 26 Oral Care Market Size, By Region, 2015–2022 (USD Million)
Table 27 Pharmaceuticals Market Size, By Region, 2015–2022 (USD Million)
Table 28 Polyol Sweetener Market Size for Other Applications, By Region, 2015–2022 (USD Million)
Table 29 Market Size, By Region, 2015–2022 (USD Million)
Table 30 Market Size, By Region, 2015–2022 (KT)
Table 31 North America: Polyol Sweetener Market Size, By Country, 2015–2022 (USD Million)
Table 32 North America: Market Size, By Country, 2015–2022 (KT)
Table 33 North America: Market Size, By Type, 2015–2022 (USD Million)
Table 34 North America: Market Size, By Type, 2015–2022 (KT)
Table 35 North America: Market Size, By Form, 2015–2022 (USD Million)
Table 36 North America: Market Size, By Application, 2015–2022 (USD Million)
Table 37 U.S.: Market Size, By Application, 2015–2022 (USD Million)
Table 38 Canada: Market Size, By Application, 2015–2022 (USD Million)
Table 39 Mexico: Market Size, By Application, 2015–2022 (USD Million)
Table 40 Europe: Polyol Sweeteners Market Size, By Country, 2015–2022 (USD Million)
Table 41 Europe: Market Size, By Country, 2015–2022 (KT)
Table 42 Europe: Market Size, By Type, 2015–2022 (USD Million)
Table 43 Europe: Market Size, By Type, 2015–2022 (KT)
Table 44 Europe: Market Size, By Form, 2015–2022 (USD Million)
Table 45 Europe: Market Size, By Application, 2015–2022 (USD Million)
Table 46 Germany: Market Size, By Application, 2015–2022 (USD Million)
Table 47 France: Market Size, By Application, 2015–2022 (USD Million)
Table 48 U.K.: Market Size, By Application, 2015–2022 (USD Million)
Table 49 Italy: Market Size, By Application, 2015–2022 (USD Million)
Table 50 Spain: Market Size, By Application, 2015–2022 (USD Million)
Table 51 Rest of Europe: Market Size, By Application, 2015–2022 (USD Million)
Table 52 Asia-Pacific: Polyol Sweetener Market Size, By Country, 2015–2022 (USD Million)
Table 53 Asia-Pacific: Market Size, By Country, 2015–2022 (KT)
Table 54 Asia-Pacific: Market Size, By Type, 2015–2022 (USD Million)
Table 55 Asia-Pacific: Market Size, By Type, 2015–2022 (KT)
Table 56 Asia-Pacific: Market Size, By Form, 2015–2022 (USD Million)
Table 57 Asia-Pacific: Market Size, By Application, 2015–2022 (USD Million)
Table 58 China: Polyol Sweetener Market Size, By Application, 2015–2022 (USD Million)
Table 59 Japan: Market Size, By Application, 2015–2022 (USD Million)
Table 60 India: Market Size, By Application, 2015–2022 (USD Million)
Table 61 Australia & New Zealand: Polyol Sweetener Market Size, By Application, 2015–2022 (USD Million)
Table 62 Rest of Asia-Pacific: Market Size, By Application, 2015–2022 (USD Million)
Table 63 RoW: Polyol Sweeteners Market Size, By Region, 2015–2022 (USD Million)
Table 64 RoW: Market Size, By Region, 2015–2022 (KT)
Table 65 RoW: Market Size, By Type, 2015–2022 (USD Million)
Table 66 RoW: Market Size, By Type, 2015–2022 (KT)
Table 67 RoW: Market Size, By Form, 2015–2022 (USD Million)
Table 68 RoW: Market Size, By Application, 2015–2022 (USD Million)
Table 69 South America: Polyol Sweeteners Market Size, By Application, 2015–2022 (USD Million)
Table 70 Middle East & Africa: Market Size, By Application, 2015–2022 (USD Million)
List of Figures (37 Figures)
Figure 1 Market Segmentation
Figure 2 Regional Scope
Figure 3 Polyol Sweeteners Market: Research Design
Figure 4 Breakdown of Primary Interviews: By Company, Designation, and Region
Figure 5 Market Breakdown & Data Triangulation
Figure 6 Market Size Estimation Methodology: Top-Down Approach
Figure 7 Market Size Estimation Methodology: Bottom-Up Approach
Figure 8 Polyol Sweetener Market, By Type, 2015–2022 (USD Million)
Figure 9 Market Size, By Form, 2017 vs 2022 (USD Million)
Figure 10 Market Size, By Application, 2017 vs 2022 (USD Million)
Figure 11 Market Share, By Region, 2017
Figure 12 Rise in Demand for Polyol Sweeteners in Low-Calorie Food Products to Drive this Market
Figure 13 Sorbitol Segment Estimated to Record the Largest Share in 2017
Figure 14 Bakery & Confectionery Segment Estimated to Hold the Largest Share in Europe, 2017
Figure 15 Bakery & Confectionery Estimated to Be the Largest Segment in 2017
Figure 16 Powder/Crystal Form of Polyol Sweeteners Estimated to Hold the Largest Share in 2017
Figure 17 Value Chain Analysis: Major Value is Added During Manufacturing and Quality Control
Figure 18 Demand for Bread and Related Bakery Products to Drive the Market Growth
Figure 19 Sorbitol Segment to Dominate the Market Through 2022 (USD Million)
Figure 20 Powder/Crystal Segment to Lead the Market Through 2022 (USD Million)
Figure 21 Bakery & Confectionery Segment to Lead the Market Through 2022 (USD Million)
Figure 22 Polyol Sweeteners Market Size, By Region, 2017 vs 2022 (USD Million)
Figure 23 U.S. to Dominate the Market for Polyol Sweeteners in North America Through 2022 (USD Million)
Figure 24 The U.K. is Projected to Be the Fastest-Growing in the Market in Europe Between 2017 & 2022
Figure 25 Germany is Projected to Dominate the Market for Polyol Sweeteners in Europe Through 2022
Figure 26 China to Witness the Fastest Growth in the Polyol Sweetener Market in Asia-Pacific Through 2022 (USD Million)
Figure 27 China to Lead the Market for Polyol Sweeteners in Asia-Pacific Through 2022 (USD Million)
Figure 28 South America to Lead the Market for Polyol Sweeteners in RoW Through 2022 (USD Million)
Figure 29 Dive Chart
Figure 30 Cargill: Company Snapshot
Figure 31 Archer Daniels Midland Company: Company Snapshot
Figure 32 E.I. Du Point De Nemours and Company: Company Snapshot
Figure 33 Roquette Frères S.A.: Company Snapshot
Figure 34 Tereos Starch & Sweeteners: Company Snapshot
Figure 35 Südzucker AG: Company Snapshot
Figure 36 Ingredion Incorporated: Company Snapshot
Figure 37 Gulshan Polyols Limited: Company Snapshot


Growth opportunities and latent adjacency in Polyol Sweeteners Market