User Provisioning Market by Business Application (Role Management, Password Management, User Log Management, User Governance and Compliance), Business Function (IT, HR, and Finance), Service, Deployment, and Vertical - Global Forecast to 2022


[156 Pages Report] The user provisioning market size expected to grow from $3.81 Billion in 2016 to reach $7.56 Billion by 2022, at a Compound Annual Growth Rate (CAGR) of 12.2%.
Objectives of the Study
The main objective of the report is to define, describe, and forecast the user provisioning market size on the basis of components (solution and services), business applications, business functions, verticals, organization sizes, deployment types, and regions. The report provides detailed information on the major factors (drivers, restraints, opportunities, and challenges) influencing the growth of the market. The report attempts to forecast the market size with respect to the 5 main regions, namely, North America, Europe, Asia Pacific (APAC), Middle East and Africa (MEA), and Latin America. The report strategically profiles the key market players and comprehensively analyzes their core competencies. It also tracks and analyzes the competitive developments, such as joint ventures, mergers and acquisitions, and new product developments, in the market.
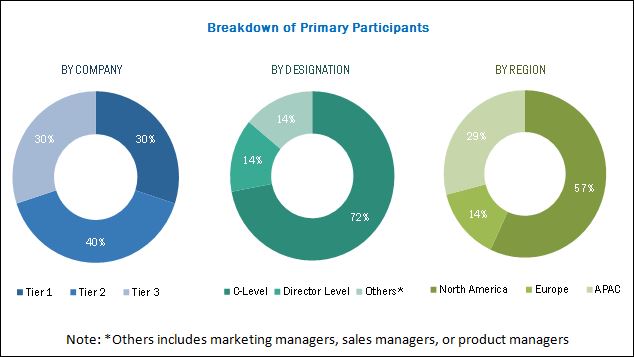
The research methodology used to estimate and forecast the user provisioning market size began with collection and analysis of data on the key vendor revenues through secondary sources, including annual reports and press releases, investor presentations, conferences and associations (ISSA: Information Systems Security Association, ICAM: Identity, Credential, and Access Management, ISF: Information Security Forum, and The Open Group Identity Management Forum), technology journals, certified publications, articles from recognized authors, directories, and databases. The vendor offerings were also taken into consideration to determine the market segmentations. The bottom-up procedure was employed to arrive at the overall market size of the market from the revenue of the key players and their market shares. The user provisioning market spending across all regions, along with the geographical split in various verticals, was considered to arrive at the overall market size. After arriving at the overall market size, the total market was split into several segments and subsegments, which were then verified through primary research by conducting extensive interviews with key people, such as Chief Executive Officers (CEOs), Vice Presidents (VPs), directors, and executives. The data triangulation and market breakdown procedures were employed to complete the overall market engineering process and arrive at the exact statistics for all the segments and subsegments. The breakdown of the profiles of the primary participants is depicted in the below figure:
To know about the assumptions considered for the study, download the pdf brochure
The user provisioning market includes various vendors providing solutions to commercial clients across globe. Companies such IBM (US), Oracle (US), CA Technologies (US), Microsoft (US), Hitachi ID Systems (Canada), SAP (Germany), Dell (US), Happiest Minds (India), OneLogin (US), EmpowerID (US), Centrify Corporation (US), and Atos (France) have adopted partnerships, agreements, and collaborations as their key strategies to enhance their market reach. These User Provisioning Software Vendors are rated and listed by us on the basis of product quality, reliability, and their business strategy. Please visit 360Quadrants to see the vendor listing of User Provisioning Software.
Key Target Audience for User Provisioning Market
- Identity and Access Management (IAM) solution vendors
- Cybersecurity vendors
- Cloud service providers
- System integrators
- Managed Security Service Providers (MSSPs)
- Application design and software developers
- Consultancy firms and advisory firms
- Regulatory agencies
- Technology consultants
- Government
The study answers several questions for the stakeholders, primarily, which market segments to focus on in the next 2 to 5 years for prioritizing efforts and investments.
Get online access to the report on the World's First Market Intelligence Cloud
Request Sample Scope of the Report

The research report segments the user provisioning market into the following submarkets:
By Component:
- Solution
- Services
User Provisioning Market By Business Application:
- Role management
- Administration and management
- User log management
- Password management
- User governance and compliance
Market By Business Function:
- IT
- Administration
- HR
- Marketing and Sales
- Finance
User Provisioning Market By Service:
- Professional services
- Managed services
By Organization Size:
- Large enterprises
- Small and Medium-Sized Enterprises (SMEs)
User Provisioning Market By Deployment Type:
- Cloud
- On-Premises
By Vertical:
- Telecom
- Banking, Financial Services and Insurance (BFSI)
- Education
- Government and Public Sector
- Healthcare
- Retail
- Manufacturing
- Energy and Utilities
- Others (Automotive, Transportation, and Logistics and Media and Entertainment)
User Provisioning Market By Region:
- North America
- Europe
- APAC
- MEA
- Latin America
Available Customizations
With the given market data, MarketsandMarkets offers customizations as per the company�s specific needs. The following customization options are available for the report:
Geographic Analysis
- Further breakdown of the North American market into the US and Canada
- Further breakdown of the European market into the UK, Germany, and France
Company Information
- Detailed analysis and profiling of additional market players
MarketsandMarkets forecasts the user provisioning market size to grow from USD 4.25 Billion in 2017 to USD 7.56 Billion by 2022, at a Compound Annual Growth Rate (CAGR) of 12.2%.
The user provisioning market is segmented on the basis of components (solution and services), business applications, business functions, verticals, organization sizes, deployment types, and regions. The market is witnessing a critical need for centrally managed user provisioning and reliable authentication solutions, rising adoption of cloud-based Single Sign-On (SSO), and password management solutions. Furthermore, the rise in awareness and criticality of user compliance management and governance, and the increased traction for security and risk mitigation are said to be driving the adoption of reliable solutions and services.
The role management business application segment is expected to hold the largest size in user provisioning market during the forecast period, as role-based provisioning offers course-grained and fine-grained real-time user provisioning and authorization decisions to IT administrators. Additionally, it provides the necessary framework to enterprises to efficiently govern access to data based on the employee�s job. It is instrumental in granting access and rights according to the employee roles. The deployment type segment is categorized into cloud and on-premises. The business function segment is categorized into IT, administration, HR, marketing and sales, and finance. The vertical segment is further categorized into telecom, Banking, Financial Services and Insurance (BFSI), education, government and public sector, healthcare, retail, manufacturing, energy and utilities, and others (automotive, transportation, and logistics and media and entertainment).
User provisioning solutions are the main component of identity administration activities, which are instrumental in providing features, such as SSO, Multifactor Authentication (MFA), role life cycle management, privileged access security, risk-based access control, Separation of Duties (SoD), automated provisioning and de-provisioning, and self-service profile change and access request. User provisioning solutions and services are instrumental in ensuring organization cost savings, management control, operational efficiency, and the growth of the business. Moreover, they help in securing the systems, data, and applications from unauthorized access and enhance the employee productivity, thereby increasing the compliance efficiency.
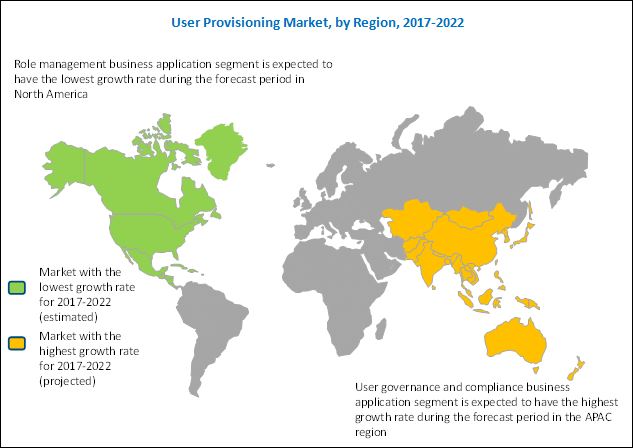
North America is expected to hold the largest market share and dominate the user provisioning market during the forecast period. North America has always witnessed a high number of identity thefts and fraud incidents, and as a result, it is driving organizations to more swiftly and proactively plan an enhanced adoption of new tools, services, and techniques for security provisions that accompany new technological implementation. Moreover, the increased budgets and grants have invited various big players to make significant investments in this region. User provisioning solutions promptly integrate new trends including mobility, IoT, and cloud, therefore making credentials and passwords more secure to protect sensitive data and systems from sophisticated attackers, who are growing by numbers. These are some important factors driving the growth of the user provisioning market in North America, such as the advent of Small and Medium-Sized Enterprises (SMEs) and the startup culture in North America is growing at a faster pace as compared to the other regions.
Asia Pacific (APAC) has witnessed an advanced and dynamic adoption of new technologies and has always been a lucrative region. It is expected to grow at the highest CAGR during the forecast period. In addition, the region has witnessed advanced and dynamic adoption of new technologies and has always been a lucrative region for user provisioning and Identity and Access Management (IAM) solutions. Moreover, this region is expected to invest more in on deploying security solutions, owing to the increasing threat of identity and access breaches.
Shadow IT risk is likely to be one of the restraining factors for the user provisioning market. However, the recent developments, new product launches, and acquisitions undertaken by the major market players are said to be boosting the growth of the market.
To speak to our analyst for a discussion on the above findings, click Speak to Analyst
Table of Contents
1 Introduction (Page No. - 15)
1.1 Objectives of the Study
1.2 Market Definition
1.3 Years Considered for the Study
1.4 Currency
1.5 Stakeholders
2 Research Methodology (Page No. - 18)
2.1 Research Data
2.1.1 Secondary Data
2.1.2 Primary Data
2.1.2.1 Breakdown of Primaries
2.1.2.2 Key Industry Insights
2.2 Market Size Estimation
2.3 Microquadrant Methodology
2.3.1 Microquadrant Matrix: Weightage Criteria
2.3.2 Microquadrant Description
2.4 Research Assumptions and Limitations
2.4.1 Assumptions
2.4.2 Limitations
3 Executive Summary (Page No. - 27)
4 Premium Insights (Page No. - 31)
4.1 Attractive Opportunities in the User Provisioning Market
4.2 Market By Business Application and Region, 2017
4.3 Life Cycle Analysis, By Region, 2017
4.4 Market By Region, 2017�2022
4.5 Market Investment Scenario
4.6 Top 3 Business Applications, 2017�2022
5 User Provisioning Market Overview (Page No. - 35)
5.1 Introduction
5.2 Market Dynamics
5.2.1 Drivers
5.2.1.1 Rising Adoption of Cloud-Based Single Sign-On and Password Management Solutions
5.2.1.2 Rise in Awareness and the Criticality of User Compliance Management and Governance
5.2.1.3 Increased Traction of Security and Risk Mitigation
5.2.2 Restraints
5.2.2.1 Shadow IT Risks
5.2.3 Opportunities
5.2.3.1 Trending Technologies, Such as IoT and Cloud, are Redefining the IAM and Provisioning Landscapes
5.2.3.2 Aligning the Management Strategies With the Organizational Strategic Initiatives
5.2.4 Challenges
5.2.4.1 Higher Costs Incurred for Manual Provisioning and Deprovisioning
5.2.4.2 Lack of Security, Expertise, and Awareness
5.3 Features and Functionalities
5.3.1 Role Life Cycle Management
5.3.2 Single Sign-On
5.3.3 Multifactor Authentication
5.3.4 Privileged Access Security
5.3.5 Identity Synchronization
5.3.6 Segregation of Duties
5.3.7 Automated Provisioning and Deprovisioning
5.4 Components
5.4.1 Connector
5.4.2 Internal Database
5.4.3 Auto-Discovery System
5.4.4 User Interface
5.4.5 Workflow Engine
5.4.6 Policy Engine
5.4.7 Reporting Engine
6 Market Analysis, By Business Application (Page No. - 43)
6.1 Introduction
6.2 Role Management
6.3 Administration and Management
6.4 User Log Management
6.5 Password Management
6.6 User Governance and Compliance
7 User Provisioning Market Analysis, By Service (Page No. - 50)
7.1 Introduction
7.2 Professional Services
7.2.1 System Integration Services
7.2.2 Planning and Consulting Services
7.2.3 Support and Maintenance Services
7.3 Managed Services
8 Market Analysis, By Business Function (Page No. - 57)
8.1 Introduction
8.2 Information Technology
8.3 Administration
8.4 Human Resources
8.5 Marketing and Sales
8.6 Finance
9 User Provisioning Market Analysis, By Organization Size (Page No. - 63)
9.1 Introduction
9.2 Large Enterprises
9.3 Small and Medium-Sized Enterprises
10 Market Analysis, By Deployment Type (Page No. - 67)
10.1 Introduction
10.2 On-Premises
10.3 Cloud
11 User Provisioning Market Analysis, By Vertical (Page No. - 71)
11.1 Introduction
11.2 Telecom
11.3 Banking, Financial Services, and Insurance
11.4 Education
11.5 Government and Public Sector
11.6 Healthcare
11.7 Retail
11.8 Manufacturing
11.9 Energy and Utilities
11.10 Others
12 Geographic Analysis (Page No. - 81)
12.1 Introduction
12.2 North America
12.3 Europe
12.4 Asia Pacific
12.5 Middle East and Africa
12.6 Latin America
13 Competitive Landscape (Page No. - 105)
13.1 Microquadrant Overview
13.1.1 Visionary Leaders
13.1.2 Innovators
13.1.3 Dynamic Differentiators
13.1.4 Emerging Companies
13.2 Competitive Benchmarking
13.2.1 Strength of Product Portfolio Adopted By Major Players in the User Provisioning Market (25 Players)
13.2.2 Business Strategy Excellence Adopted By Major Players in the Market (25 Players)
14 Company Profiles (Page No. - 109)
(Business Overview, Strength of Product Portfolio, Business Strategy Excellence, Recent Developments)*
14.1 IBM
14.2 Oracle
14.3 ATOS
14.4 Hitachi ID Systems
14.5 Dell
14.6 Onelogin
14.7 SAP
14.8 Happiest Minds
14.9 CA Technologies
14.10 Empowerid
14.11 Microsoft
14.12 Centrify Corporation
*Details on Business Overview, Strength of Product Portfolio, Business Strategy Excellence, Recent Developments Might Not Be Captured in Case of Unlisted Companies.
15 Appendix (Page No. - 146)
15.1 Industry Experts
15.2 Discussion Guide
15.3 Nowledge Store: Marketsandmarkets� Subscription Portal
15.4 Introducing RT: Real-Time Market Intelligence
15.5 Available Customizations
15.6 Related Reports
15.7 Author Details
List of Tables (79 Tables)
Table 1 User Provisioning Market Size and Growth Rate 2017�2022 (USD Million, Y-O-Y %)
Table 2 Market Size, By Component, 2015�2022 (USD Million)
Table 3 Market Size, By Business Application, 2015�2022 (USD Million)
Table 4 Role Management: Market Size, By Region, 2015�2022 (USD Million)
Table 5 Administration and Management: Market Size, By Region, 2015�2022 (USD Million)
Table 6 User Log Management: Market Size, By Region, 2015�2022 (USD Million)
Table 7 Password Management: Market Size, By Region, 2015�2022 (USD Million)
Table 8 User Governance and Compliance: Market Size, By Region, 2015�2022 (USD Million)
Table 9 User Provisioning Market Size, By Service, 2015�2022 (USD Million)
Table 10 Professional Services: Market Size, By Type, 2015�2022 (USD Million)
Table 11 Professional Services: Market Size, By Region, 2015�2022 (USD Million)
Table 12 System Integration Services Market Size, By Region, 2015�2022 (USD Million)
Table 13 Planning and Consulting Services Market Size, By Region, 2015�2022 (USD Million)
Table 14 Support and Maintenance Services Market Size, By Region, 2015�2022 (USD Million)
Table 15 Managed Services: Market Size, By Region, 2015�2022 (USD Million)
Table 16 User Provisioning Market Size, By Business Function, 2015�2022 (USD Million)
Table 17 Information Technology: Market Size, By Region, 2015�2022 (USD Million)
Table 18 Administration: Market Size, By Region, 2015�2022 (USD Million)
Table 19 Human Resources: Market Size, By Region, 2015�2022 (USD Million)
Table 20 Marketing and Sales: Market Size, By Region, 2015�2022 (USD Million)
Table 21 Finance: Market Size, By Region, 2015�2022 (USD Million)
Table 22 Market Size, By Organization Size, 2015�2022 (USD Million)
Table 23 Large Enterprises: User Provisioning Market Size, By Region, 2015�2022 (USD Million)
Table 24 Small and Medium-Sized Enterprises: Market Size, By Region, 2015�2022 (USD Million)
Table 25 Market Size, By Deployment Type, 2015�2022 (USD Million)
Table 26 On-Premises: Market Size, By Region, 2015�2022 (USD Million)
Table 27 Cloud: Market Size, By Region, 2015�2022 (USD Million)
Table 28 Market Size, By Vertical, 2015�2022 (USD Million)
Table 29 Telecom: User Provisioning Market Size, By Region, 2015�2022 (USD Million)
Table 30 Banking, Financial Services, and Insurance: Market Size, By Region, 2015�2022 (USD Million)
Table 31 Education: Market Size, By Region, 2015�2022 (USD Million)
Table 32 Government and Public Sector: Market Size, By Region, 2015�2022 (USD Million)
Table 33 Healthcare: Market Size, By Region, 2015�2022 (USD Million)
Table 34 Retail: Market Size, By Region, 2015�2022 (USD Million)
Table 35 Manufacturing: Market Size, By Region, 2015�2022 (USD Million)
Table 36 Energy and Utilities: Market Size, By Region, 2015�2022 (USD Million)
Table 37 Others: Market Size, By Region, 2015�2022 (USD Million)
Table 38 User Provisioning Market Size, By Region, 2015�2022 (USD Million)
Table 39 North America: Market Size, By Component, 2015�2022 (USD Million)
Table 40 North America: Market Size, By Business Application, 2015�2022 (USD Million)
Table 41 North America: Market Size, By Business Function, 2015�2022 (USD Million)
Table 42 North America: Market Size, By Service, 2015�2022 (USD Million)
Table 43 North America: Market Size, By Professional Service, 2015�2022 (USD Million)
Table 44 North America: Market Size, By Organization Size, 2015�2022 (USD Million)
Table 45 North America: Market Size, By Deployment Type, 2015�2022 (USD Million)
Table 46 North America: Market Size, By Vertical, 2015�2022 (USD Million)
Table 47 Europe: Market Size, By Component, 2015�2022 (USD Million)
Table 48 Europe: Market Size, By Business Application, 2015�2022 (USD Million)
Table 49 Europe: User Provisioning Market Size, By Business Function, 2015�2022 (USD Million)
Table 50 Europe: Market Size, By Service, 2015�2022 (USD Million)
Table 51 Europe: Market Size, By Professional Service, 2015�2022 (USD Million)
Table 52 Europe: Market Size, By Organization Size, 2015�2022 (USD Million)
Table 53 Europe: Market Size, By Deployment Type, 2015�2022 (USD Million)
Table 54 Europe: Market Size, By Vertical, 2015�2022 (USD Million)
Table 55 Asia Pacific: Market Size, By Component, 2015�2022 (USD Million)
Table 56 Asia Pacific: Market Size, By Business Application, 2015�2022 (USD Million)
Table 57 Asia Pacific: Market Size, By Business Function, 2015�2022 (USD Million)
Table 58 Asia Pacific: Market Size, By Service, 2015�2022 (USD Million)
Table 59 Asia Pacific: Market Size, By Professional Service, 2015�2022 (USD Million)
Table 60 Asia Pacific: Market Size, By Organization Size, 2015�2022 (USD Million)
Table 61 Asia Pacific: Market Size, By Deployment Type, 2015�2022 (USD Million)
Table 62 Asia Pacific: User Provisioning Market Size, By Vertical, 2015�2022 (USD Million)
Table 63 Middle East and Africa: Market Size, By Component, 2015�2022 (USD Million)
Table 64 Middle East and Africa: Market Size, By Business Application, 2015�2022 (USD Million)
Table 65 Middle East and Africa: Market Size, By Business Function, 2015�2022 (USD Million)
Table 66 Middle East and Africa: Market Size, By Service, 2015�2022 (USD Million)
Table 67 Middle East and Africa: Market Size, By Professional Service, 2015�2022 (USD Million)
Table 68 Middle East and Africa: Market Size, By Organization Size, 2015�2022 (USD Million)
Table 69 Middle East and Africa: Market Size, By Deployment Type, 2015�2022 (USD Million)
Table 70 Middle East and Africa: Market Size, By Vertical, 2015�2022 (USD Million)
Table 71 Latin America: User Provisioning Market Size, By Component, 2015�2022 (USD Million)
Table 72 Latin America: Market Size, By Business Application, 2015�2022 (USD Million)
Table 73 Latin America: Market Size, By Business Function, 2015�2022 (USD Million)
Table 74 Latin America: Market Size, By Service, 2015�2022 (USD Million)
Table 75 Latin America: Market Size, By Professional Service, 2015�2022 (USD Million)
Table 76 Latin America: Market Size, By Organization Size, 2015�2022 (USD Million)
Table 77 Latin America: Market Size, By Deployment Type, 2015�2022 (USD Million)
Table 78 Latin America: Market Size, By Vertical, 2015�2022 (USD Million)
Table 79 Market Ranking for the Market, 2017
List of Figures (45 Figures)
Figure 1 User Provisioning Market: Market Segmentation
Figure 2 Market: Research Design
Figure 3 Data Triangulation
Figure 4 Market Size Estimation Methodology: Bottom-Up Approach
Figure 5 Market Size Estimation Methodology: Top-Down Approach
Figure 6 North America is Estimated to Have the Largest Market Share in 2017
Figure 7 Segments Dominating the Global Market, 2017
Figure 8 Solution Segment is Estimated to Hold the Larger Market Share in 2017
Figure 9 Critical Need for Centrally Managed User Provisioning and Reliable Authentication Solutions, Rise in Awareness, and the Criticality of User Governance and Compliance Management are Driving the Market
Figure 10 Role Management and North America are Estimated to Have the Largest Market Shares in 2017
Figure 11 Asia Pacific is Expected to Grow at the Highest CAGR During the Forecast Period
Figure 12 North America is Expected to Have the Largest Market Size During the Forecast Period
Figure 13 Asia Pacific is Expected to Emerge as the Best Market for Investments in the Next 5 Years
Figure 14 User Governance and Compliance, Password Management, and Administration and Management are Expected to Grow at High Growth Rates During the Forecast Period
Figure 15 User Provisioning Market: Drivers, Restraints, Opportunities, and Challenges
Figure 16 Role Management Business Application Segment is Expected to Dominate the Market During the Forecast Period
Figure 17 North America is Expected to Hold the Largest Market Size in the Role Management Business Application Segment During the Forecast Period
Figure 18 North America is Expected to Dominate the User Governance and Compliance Business Application Segment During the Forecast Period
Figure 19 Professional Services Segment is Expected to Hold the Larger Market Size During the Forecast Period
Figure 20 Planning and Consulting Services Segment is Expected to Dominate the Professional Services Segment During the Forecast Period
Figure 21 North America is Expected to Dominate the System Integration Services Segment During the Forecast Period
Figure 22 North America is Expected to Hold the Largest Market Size in the Planning and Consulting Services Segment During the Forecast Period
Figure 23 Asia Pacific is Expected to Grow at the Highest CAGR in the Managed Services Segment During the Forecast Period
Figure 24 IT Business Function is Expected to Hold the Largest Market Size During the Forecast Period
Figure 25 North America is Expected to Have the Largest Market Size for in the IT Segment During the Forecast Period
Figure 26 Large Enterprises Segment is Expected to Have the Larger Market Size During the Forecast Period
Figure 27 North America is Expected to Dominate the Large Enterprises Segment in the User Provisioning Market During the Forecast Period
Figure 28 Cloud Deployment Type is Expected to Hold the Larger Market Size During the Forecast Period
Figure 29 North America is Expected to Dominate the Cloud Deployment Type in the User Provisioning Market During the Forecast Period
Figure 30 Telecom Vertical is Expected to Hold the Largest Market Size in 2017
Figure 31 North America is Expected to Have the Largest Market Size in the Telecom Sector During the Forecast Period
Figure 32 Asia Pacific is Expected to Grow at the Highest CAGR in the Education Segment During the Forecast Period
Figure 33 Asia Pacific is Expected to Exhibit the Highest CAGR in the Market During the Forecast Period
Figure 34 Asia Pacific is an Attractive Destination in the Market, 2017�2022
Figure 35 North America Market Snapshot
Figure 36 Solution Segment is Expected to Hold the Largest Market Size in North America During the Forecast Period
Figure 37 Asia Pacific Market Snapshot
Figure 38 User Governance and Compliance Segment is Expected to Showcase the Highest CAGR in the Asia Pacific Market During the Forecast Period
Figure 39 User Provisioning Market (Global), Competitive Leadership Mapping, 2017
Figure 40 IBM: Company Snapshot
Figure 41 Oracle: Company Snapshot
Figure 42 ATOS: Company Snapshot
Figure 43 SAP: Company Snapshot
Figure 44 CA Technologies: Company Snapshot
Figure 45 Microsoft: Company Snapshot


Growth opportunities and latent adjacency in User Provisioning Market