Micro Turbines Market by Power Rating (12�50 kW, 50�250 kW, and 250�500 kW), Application (Combined Heat and Power and Standby Power), End-User (Industrial, Commercial, and Residential), and Region - Global Forecast to 2022


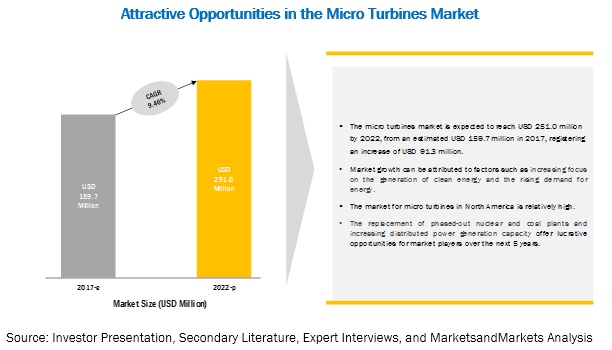
MarketsandMarkets forecasts the Micro Turbines Market is projected to reach USD 251.0 million by 2022, from an estimated USD 149.8 million in 2016, at a CAGR of 9.46%. Factors such as increasing global electricity demand & subsequent investments in power plants, economic benefits of implementing micro turbines, increasing efforts to reduce global greenhouse gas emissions, and growing adoption of CHP are driving the micro turbine market. However, falling oil & gas prices can hinder the growth of the market.
The commercial segment is expected to be the fastest growing market in the micro turbines market from 2017 to 2022.
The commercial segment is estimated to be the fastest growing segment of the micro turbines market, by end-user, from 2017 to 2022. This segment is being driven by the expansion of urban areas and the development of commercial trade hubs. The opportunities coming from the commercial sector will increase the number of shopping malls, sport complexes, resorts, and hotels. The advancement of digital economy and the growth of the IT and telecommunication sector has resulted in an increase in the construction of office complexes, which demand continuous power.
CHP: The fastest growing market for micro turbines market
Based on application, the micro turbine market has been categorized into CHP and standby power. The CHP application market is expected to grow at the highest CAGR during the forecast period. This application is highly useful for industries such as wastewater treatment plants, breweries, rubber mills, and paper mills which require heat to drive various internal processes. CHP-generating micro turbines also provide heat to residential households, which are typically seen in colder climates such as in Europe, North America, and some parts of China
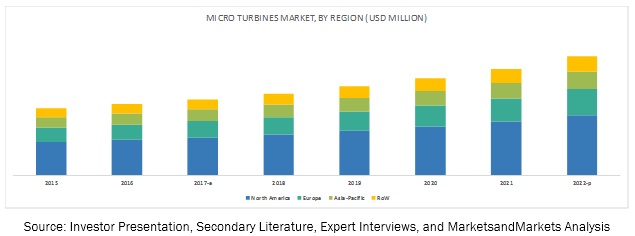
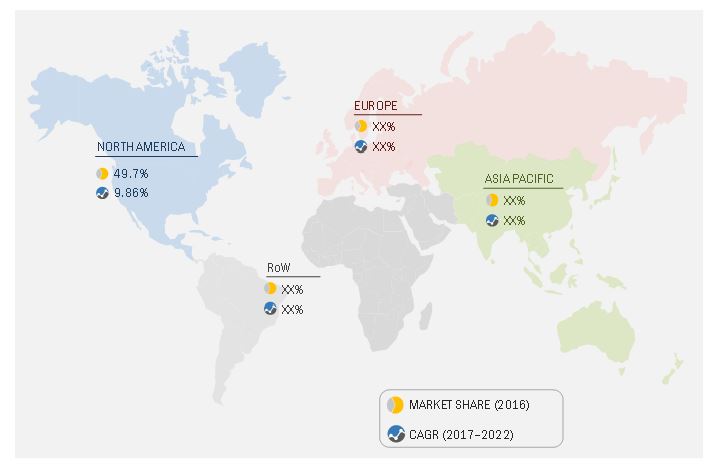
North America: The largest growing market for micro turbines market
North American is the largest market for micro turbines followed by Europe and Asia-pacific. The US accounted for a majority share in the North American region in 2016, whereas Canada is projected to grow at the highest CAGR from 2017 to 20221. Aging power plants and frequent natural calamities have created enormous growth opportunities for the micro turbine market in this region. The Shale gas boom in North America and decommissioning of nuclear plants in Europe are boosting the demand for micro turbines in those regions.
Market Dynamics
Driver: Increasing focus on the generation of clean energy
During the last decade, there has been an increased focus on energy generation from sustainable and non-polluting sources. Many climate change agreements, including the Kyoto Protocol (1997) and the United Nations Framework Convention on Climate Change (1992), have been enacted in response to the detrimental effects of global warming. The use of conventional fuels including crude oil, coal, and natural gas contributes to high amounts of emissions of greenhouse gases such as carbon dioxide (CO2) and carbon monoxide (CO). Micro turbines release very low emissions, in terms of the concentrations of sulfur oxide (SO) and nitrogen oxide (NO), as compared to fossil fuels.
Various countries are phasing out nuclear plants and focusing on achieving energy efficiency targets. This has resulted in a greater emphasis on the use of clean energy, which causes no damage to the environment. According to the International Energy Outlook 2017 (IEO2017) reference case, the world�s natural gas producers are expected to increase supply by 42% from 2015 to 2040. In Russia, the production of natural gas is expected to increase mainly due to the increasing development of resources in the country�s Arctic and eastern regions. The production growth in the US and China can be attributed to shale resources; in China, shale is projected to account for more than half of the total natural gas production by 2040.
Restraint: Falling oil & gas prices
With the decline in oil & gas prices, the companies operating in the sector experienced a dip in revenue, profits, and operating margins. According to the World Bank, crude oil prices have drastically declined from USD 101.92 per barrel in August 2014 to USD 48.48 per barrel in June 2016. The drastic fall in prices has resulted in a surplus of crude oil for electricity generation using internal combustion engines which are direct substitutes of micro turbines for distributed power generation applications. Crude oil also has a higher calorific value as compared to natural gas, leading to internal combustion engines producing more power than micro turbines.
Opportunity: Replacement of phased-out nuclear & coal plants
Nuclear power plants used to be viewed as clean, reliable, and affordable sources of power generation at a large scale; however, this perception is changing. The Fukushima nuclear accident in Japan, in the wake of the tsunami in 2011, had a catalyzing effect on the debate on the cost-benefit analyses of nuclear power generation. There are a number of nuclear power plants under construction which have been delayed or abandoned due to large cost overruns and regulatory norms. For instance, in July 2017, two unfinished nuclear reactors were abandoned in South Carolina (US) due to cost overruns. After the Fukushima nuclear accident, Japan offset the loss in nuclear power generation through natural gas-fired power generation. In the US, the likely implementation of the Mercury and Air Toxics Standards by the Environmental Protection Agency is expected to result in the retirement of existing coal-fired plants on a large scale and dramatic downturns in proposed new plants. Natural gas, as a less polluting fuel than coal or petroleum liquid, would continue to be the favored replacement for redundant nuclear and coal-fired capacities, thereby, providing growth opportunities to the micro turbines market.
Challenge: Electrical grid modernization & network upgradation
The aging T&D infrastructure has resulted in policy changes in developing and developed nations. New investments are being made in the modernization of existing electrical grids to counter unreliable grid operation. For instance, the US Department of Energy (DOE) has implemented a new grid modernization multi-year program. Under the provisions of the program, funds worth USD 220 million will be awarded over the next 3 years, subject to Congressional appropriations, to the DOE�s National Labs and partners to support critical R&D projects. These projects will focus on advanced storage systems, clean energy integration, standards and tests procedures, and a number of other key grid modernization areas.
India is expected to enact the Restructured Accelerated Power Development and Reform Programme (R-APDRP), which will provide funds worth USD 10 billion over the coming years for grid modernization. Under the first phase of the R-APDRP, approximately USD 2 billion will be allocated toward quantifying transmission losses in the existing power T&D infrastructure. These developments in modernizing the existing power T&D infrastructure will reduce power losses and help lower the demand for distributed power generation, resulting in the reduced demand for micro turbine-based power generation.
Get online access to the report on the World's First Market Intelligence Cloud
- Easy to Download Historical Data & Forecast Numbers
- Company Analysis Dashboard for high growth potential opportunities
- Research Analyst Access for customization & queries
- Competitor Analysis with Interactive dashboard
- Latest News, Updates & Trend analysis
Request Sample Scope of the Report
Get online access to the report on the World's First Market Intelligence Cloud
- Easy to Download Historical Data & Forecast Numbers
- Company Analysis Dashboard for high growth potential opportunities
- Research Analyst Access for customization & queries
- Competitor Analysis with Interactive dashboard
- Latest News, Updates & Trend analysis

|
Report Metric |
Details |
|
Market size available for years |
2015�2022 |
|
Base year considered |
2016 |
|
Forecast period |
2017�2022 |
|
Forecast units |
Million (USD) |
|
Segments covered |
Power Rating (12-50 kW, 50-250 kW, and 250-500 kW), Application (Combined heat and power, and standby power), End-User (Industrial, commercial, and residential), and Region |
|
Geographies covered |
Asia Pacific, Europe, North America, and RoW |
|
Companies covered |
Capstone Turbine (US), Ansaldo Energia (Italy), Toyota Turbine and Systems (Japan), Bowman (UK), Bladon Jets (UK), Brayton Energy (US), FlexEnergy (US), Eneftech Innovation (Switzerland), Aurelia (Finland), ICRTec (US), MIT (The Netherlands), Turbo Tech (India), and 247Solar (US) |
The research report categorizes the Micro Turbines Market to forecast the revenues and analyze the trends in each of the following sub-segments:
By Application
- Combined Heat and Power (CHP)
- Standby Power
By End-User
- Industrial
- Commercial
- Residential
By Power Rating
- 12 kW�50 kW
- 50 kW�250 kW
- 250 kW�500 kW
By Region
- North America
- Europe
- Asia-Pacific
- Rest of the World
Key Market Players
Capstone Turbine (US), Ansaldo Energia (Italy), Toyota Turbine and Systems (Japan), Bowman (UK), Bladon Jets (UK), Brayton Energy (US), FlexEnergy (US), Eneftech Innovation (Switzerland), Aurelia (Finland), ICRTec (US), MIT (The Netherlands), Turbo Tech (India), and 247Solar (US).
Capstone Turbines is a leading manufacturer of clean and green micro turbines worldwide. The company offers a complete set of micro turbine solutions from 30 kW to 1 MW of electric power output. The company is mainly involved in the development, manufacturing, marketing, and provision of services related to micro turbine technology. Capstone�s micro turbine technology solutions are used in stationary distributed power generation applications, including cogeneration (combined heat and power), integrated combined heat and power (ICHP), combined cooling, heat and power (CCHP), and renewable energy, natural resources and critical power supply. Capstone also remanufactures micro turbine engines and provides aftermarket parts and services for the same. The company markets and sells its products internationally, mainly through distributors and original equipment manufacturers. The company adopted contracts & agreements as one of its key growth strategies to maintain its market position. In September 2017, the company executed a 5-year agreement with a large greenhouse operation in Colorado, US. The firm would be installing multiple propane-fired C65 micro turbines to provide electricity for the Colorado greenhouse.
Recent Developments
- In October 2017, Aurelia partnered with Greenray Energy Solutions to develop business for its A400 gas turbine in the UK, Asia, and the Middle East.
- In September 2017, Capstone Turbine�s energy financing joint venture, Capstone Energy Finance, executed a 5-year agreement with a large greenhouse operation in Colorado, US. The firm would be installing multiple propane-fired C65 micro turbines to provide electricity for the Colorado greenhouse.
- In July 2017, Capstone Turbine�s Australian distributor, Optimal Group, secured a follow-on CHP order of a C600S Signature Series micro turbine and 4 C200S Signature Series micro turbines to provide electricity for 3 office towers in Melbourne�s Central Business District.
- In April 2017, MTT entered into an agreement with the Dutch contract manufacturer, Addit BV, to manufacture commercial EnerTwin micro CHP systems for the European market.
- In April 2017, Capstone Turbine partnered with FGC Plasma Solutions LLC (US) for the testing of a new plasma-assisted fuel injection technology in its C65 micro turbine.
Critical questions the report answers:
- Where will all these developments take the industry in the long term?
- What are the upcoming trends for the Micro turbines market?
- Which segment provides the most opportunity for growth?
- Who are the leading vendors operating in this market?
- What are the opportunities for new market entrants?
To speak to our analyst for a discussion on the above findings, click Speak to Analyst
Table of Contents
1 Introduction (Page No. - 13)
1.1 Objectives of the Study
1.2 Market Definition
1.3 Markets Covered
1.3.1 Regional Scope
1.4 Years Considered for the Study
1.5 Currency \
1.6 Stakeholders
2 Research Methodology (Page No. - 16)
2.1 Introduction
2.1.1 Secondary Data
2.1.1.1 Key Data From Secondary Sources
2.1.2 Primary Data
2.1.2.1 Key Data From Primary Sources
2.1.2.2 Key Industry Insights
2.1.2.3 Breakdown of Primary Interviews
2.2 Market Size Estimation
2.2.1 Bottom-Down Approach
2.2.2 Top-Down Approach
2.3 Market Breakdown & Data Triangulation
2.4 Research Assumptions
2.4.1 Assumptions of the Research Study
3 Executive Summary (Page No. - 25)
4 Premium Insights (Page No. - 30)
4.1 Micro Turbine Market Overview
4.2 North American Market Size, By Application & By Country
4.3 Market, By Country
4.4 Market, By Power Rating
4.5 Market, By Application
4.6 Market, By End-User
5 Market Overview (Page No. - 34)
5.1 Introduction
5.2 Market Dynamics
5.2.1 Drivers
5.2.1.1 Increasing Focus on the Generation of Clean Energy
5.2.1.2 Rising Demand for Energy
5.2.2 Restraints
5.2.2.1 Falling Oil & Gas Prices
5.2.2.2 Low Electrical Efficiency
5.2.3 Opportunities
5.2.3.1 Replacement of Phased-Out Nuclear & Coal Plants
5.2.3.2 Increase in Distributed Power Generation Capacity
5.2.4 Challenges
5.2.4.1 Electrical Grid Modernization & Network Upgradation
5.2.4.2 Competition From Existing Distributed Power Generation Technologies
6 Market, By Power Rating (Page No. - 41)
6.1 Introduction
6.2 12�50 kW
6.3 50�250 kW
6.4 250�500 kW
7 Market, By Application (Page No. - 46)
7.1 Introduction
7.2 Combined Heat & Power
7.3 Standby Power
8 Market, By End-User (Page No. - 50)
8.1 Introduction
8.2 Industrial
8.3 Commercial
8.4 Residential
9 Market, By Region (Page No. - 55)
9.1 Introduction
9.2 North America
9.2.1 By Power Rating
9.2.2 By End-User
9.2.3 By Application
9.2.4 By Country
9.2.4.1 US
9.2.4.2 Canada
9.3 Europe
9.3.1 By Power Rating
9.3.2 By End-User
9.3.3 By Application
9.3.4 By Country
9.3.4.1 Russia
9.3.4.2 UK
9.3.4.3 Germany
9.3.4.4 Rest of Europe
9.4 Asia Pacific
9.4.1 By Power Rating
9.4.2 By End-User
9.4.3 By Application
9.4.4 By Country
9.4.4.1 Australia
9.4.4.2 China
9.4.4.3 Malaysia
9.4.4.4 Rest of Asia Pacific
9.5 Rest of the World
9.5.1 By Power Rating
9.5.2 By End-User
9.5.3 By Application
9.5.4 By Country
9.5.4.1 Mexico
9.5.4.2 Brazil
9.5.4.3 Colombia
9.5.4.4 Others
10 Competitive Landscape (Page No. - 87)
10.1 Introduction
10.1.1 Key Company Focus Areas
10.2 Market Ranking Analysis
10.2.1 Global Market Scenario
10.3 Competitive Situations & Trends
10.3.1 Contracts & Agreements
10.3.2 Partnerships, Collaborations, Alliances, & Joint Ventures
10.3.3 New Product Developments
10.3.4 Investments & Expansions
10.3.5 Mergers & Acquisitions
11 Company Profiles (Page No. - 93)
(Overview, Strength of Product Portfolio, Business Strategy Excellence, Recent Developments, MnM View)*
11.1 Ansaldo Energia
11.2 Capstone Turbine
11.3 Brayton Energy
11.4 Bladon Jets
11.5 Flexenergy
11.6 Eneftech Innovation
11.7 Aurelia
11.8 Icrtec
11.9 MTT
11.10 Toyota Turbine and Systems
11.11 247solar
11.12 Bowman
11.13 Turbotech
*Details on Overview, Strength of Product Portfolio, Business Strategy Excellence, Recent Developments, MnM View Might Not Be Captured in Case of Unlisted Companies.
12 Appendix (Page No. - 123)
12.1 Insights of Industry Experts
12.2 Discussion Guide
12.3 Knowledge Store: Marketsandmarkets� Subscription Portal
12.4 Introducing RT: Real-Time Market Intelligence
12.5 Available Customizations
12.6 Related Reports
12.7 Author Details
List of Tables (70 Tables)
Table 1 Micro Turbines Market Snapshot
Table 2 Micro Turbines Market Size, By Power Rating, 2015�2022 (USD Million)
Table 3 12�50 kW: Market Size, By Region, 2015�2022 (USD Million)
Table 4 50�250 kW: Market Size, By Region, 2015�2022 (USD Million)
Table 5 250�500 kW: Market Size, By Region, 2015�2022 (USD Million)
Table 6 Market Size, By Application, 2015�2022 (USD Million)
Table 7 Combined Heat & Power: Micro Turbine Market Size, By Region, 2015�2022 (USD Million)
Table 8 Standby Power: Market Size, By Region, 2015�2022 (USD Million)
Table 9 Market Size, By End-User, 2015�2022 (USD Million)
Table 10 Industrial: Micro Turbine Market Size, By Region, 2015�2022 (USD Million)
Table 11 Commercial: Market Size, By Region, 2015�2022 (USD Million)
Table 12 Residential: Market Size, By Region, 2015�2022 (USD Million)
Table 13 Market Size, By Region, 2015�2022 (USD Million)
Table 14 North America: Market Size, By Power Rating, 2015�2022 (USD Million)
Table 15 North America: Market Size, By End-User, 2015�2022 (USD Million)
Table 16 North America: Market Size, By Application, 2015�2022 (USD Million)
Table 17 North America: Combined Heat & Power Market Size, By Country, 2015�2022 (USD Million)
Table 18 North America: Standyby Power Market Size, By Country, 2015�2022 (USD Million)
Table 19 North America: Micro Turbine Market Size, By Country, 2015�2022 (USD Million)
Table 20 US: Micro Turbines Market Size, By End-User, 2015�2022 (USD Million)
Table 21 US: Market Size, By Application, 2015�2022 (USD Million)
Table 22 Canada: Market Size, By End-User, 2015�2022 (USD Million)
Table 23 Canada: Market Size, By Application, 2015�2022 (USD Million)
Table 24 Europe: Market Size, By Power Rating, 2015�2022 (USD Million)
Table 25 Europe: Market Size, By End-User, 2015�2022 (USD Million)
Table 26 Europe: Market Size, By Application, 2015�2022 (USD Million)
Table 27 Europe: Combined Heat & Power Market Size, By Country, 2015�2022 (USD Million)
Table 28 Europe: Standby Power Market Size, By Country, 2015�2022 (USD Million)
Table 29 Europe: Market Size, By Country, 2015�2022 (USD Million)
Table 30 Russia: Market Size, By End-User, 2015�2022 (USD Million)
Table 31 Russia: Micro Turbine Market Size, By Application, 2015�2022 (USD Million)
Table 32 UK: Market Size, By End-User, 2015�2022 (USD Million)
Table 33 UK: Market Size, By Application, 2015�2022 (USD Million)
Table 34 Germany: Market Size, By End-User, 2015�2022 (USD Million)
Table 35 Germany: Market Size, By Application, 2015�2022 (USD Million)
Table 36 Rest of Europe: Market Size, By End-User, 2015�2022 (USD Million)
Table 37 Rest of Europe: Market Size, By Application, 2015�2022 (USD Million)
Table 38 Asia Pacific: Market Size, By Power Rating, 2015�2022 (USD Million)
Table 39 Asia Pacific: Market Size, By End-User, 2015�2022 (USD Million)
Table 40 Asia Pacific: Market Size, By Application, 2015�2022 (USD Million)
Table 41 Asia Pacific: Combined Heat & Power Market, By Country, 2015�2022 (USD Million)
Table 42 Asia Pacific: Standby Power Market, By Country, 2015�2022 (USD Million)
Table 43 Asia Pacific: Market, By Country, 2015�2022 (USD Million)
Table 44 Australia: Market Size, By End-User, 2015�2022 (USD Million)
Table 45 Australia: Market Size, By Application, 2015�2022 (USD Million)
Table 46 China: Market Size, By End-User, 2015�2022 (USD Million)
Table 47 China: Market Size, By Application, 2015�2022 (USD Million)
Table 48 Malaysia: Market Size, By End-User, 2015�2022 (USD Million)
Table 49 Malaysia: Market Size, By Application, 2015�2022 (USD Million)
Table 50 Rest of Asia Pacific: Market Size, By End-User, 2015�2022 (USD Million)
Table 51 Rest of Asia Pacific: Market Size, By Application, 2015�2022 (USD Million)
Table 52 Rest of the World: Market Size, By Power Rating, 2015�2022 (USD Million)
Table 53 Rest of the World: Market Size, By End-User, 2015�2022 (USD Million)
Table 54 Rest of the World: Market Size, By Application, 2015�2022 (USD Million)
Table 55 Rest of the World: Combined Heat & Power Market Size, By Country, 2015�2022 (USD Million)
Table 56 Rest of the World: Standby Power Market Size, By Country, 2015�2022 (USD Million)
Table 57 Rest of the World: Market Size, By Country, 2015�2022 (USD Million)
Table 58 Mexico: Market Size, By End-User, 2015�2022 (USD Million)
Table 59 Mexico: Market Size, By Application, 2015�2022 (USD Million)
Table 60 Brazil: Market Size, By End-User, 2015�2022 (USD Million)
Table 61 Brazil: Market Size, By Application, 2015�2022 (USD Million)
Table 62 Colombia: Market Size, By End-User, 2015�2022 (USD Million)
Table 63 Colombia: Market Size, By Application, 2015�2022 (USD Million)
Table 64 Others: Market Size, By End-User, 2015�2022 (USD Million)
Table 65 Others: Market Size, By Application, 2015�2022 (USD Million)
Table 66 Contracts & Agreements, 2014�2017
Table 67 Partnerships, Collaborations, Alliances, & Joint Ventures, 2014�2017
Table 68 New Product Developments, 2014�2017
Table 69 Investments & Expansions, 2014�2017
Table 70 Mergers & Acquisitions, 2014�2017
List of Figures (36 Figures)
Figure 1 Markets Covered: Market
Figure 2 Country-Wise Scope: Market
Figure 3 Market: Research Design
Figure 4 Breakdown of Primary Interviews: By Company Type, Designation, & Region
Figure 5 Market Size Estimation Methodology: Bottom-Up Approach
Figure 6 Market Size Estimation Methodology: Top-Down Approach
Figure 7 Market: Market Estimation Approach & Data Triangulation Methodology
Figure 8 The North American Market Dominated the Market in 2016
Figure 9 The 50�250 kW Segment is Expected to Lead the Market, By Power Rating, During the Forecast Period
Figure 10 The Combined Heat & Power Segment is Expected to Lead the Market in 2017
Figure 11 The Industrial End-User Segment is Expected to Lead the Market
Figure 12 Increasing Focus on the Generation of Clean Energy and Rising Demand for Energy are Expected to Drive the Market During the Forecast Period
Figure 13 The Combined Heat & Power Application Segment & US Market Held the Maximum Share of the Market in 2016
Figure 14 The US Market Held the Largest Share in 2016
Figure 15 The 50�250 kW Power Rating Segment is Projected to Dominate the Market During the Forecast Period
Figure 16 The Combined Heat & Power Application Segment is Expected to Lead the Micro Turbines Market During the Forecast Period
Figure 17 The Industrial End-User Segment is Expected to Dominate the Micro Turbines Market During the Forecast Period
Figure 18 Increasing Focus on the Generation of Clean Energy to Drive the Micro Turbine Market
Figure 19 Increase in World Natural Gas Production, 2015�2040 (Trillion Cubic Feet)
Figure 20 World Net Electricity Generation, By Fuel, 2012�2040 (Trillion KWH)
Figure 21 Oil Price Trend (January 2014�July 2017)
Figure 22 Market ,By Power Rating, 2016
Figure 23 The Combined Heat & Power Segment to Account for the Larger Share in 2016
Figure 24 Market, By End-User, 2016
Figure 25 Regional Snapshot: the North American Market is Expected to Grow at the Highest CAGR During the Forecast Period
Figure 26 The North American Market Led the Market in 2016
Figure 27 North America: Market Snapshot
Figure 28 US: Market, By Application, 2017�2022
Figure 29 Europe: Market Snapshot
Figure 30 Russia: Market, By Application, 2017�2022
Figure 31 Australia: Market, By Application, 2017�2022
Figure 32 Mexico: Market, By Application, 2017�2022
Figure 33 Key Developments in the Market, 2014�2017
Figure 34 Market Rankings Based on Revenue, 2016
Figure 35 Ansaldo Energia: Company Snapshot
Figure 36 Capstone Turbine: Company Snapshot


Growth opportunities and latent adjacency in Micro Turbines Market